HAL Id: cea-02339713
https://hal-cea.archives-ouvertes.fr/cea-02339713
Submitted on 4 Nov 2019HAL is a multi-disciplinary open access archive for the deposit and dissemination of sci-entific research documents, whether they are pub-lished or not. The documents may come from teaching and research institutions in France or abroad, or from public or private research centers.
L’archive ouverte pluridisciplinaire HAL, est destinée au dépôt et à la diffusion de documents scientifiques de niveau recherche, publiés ou non, émanant des établissements d’enseignement et de recherche français ou étrangers, des laboratoires publics ou privés.
Influence of light ion irradiation of the oxide layer on
the oxidation rate of zircaloy-4: Irradiation of the
post-transition oxide layer
M. Tupin, B. Venague, G. Gutierrez
To cite this version:
M. Tupin, B. Venague, G. Gutierrez. Influence of light ion irradiation of the oxide layer on the oxidation rate of zircaloy-4: Irradiation of the post-transition oxide layer. Corrosion Science, Elsevier, 2018, 161, pp.108190. �10.1016/j.corsci.2019.108190�. �cea-02339713�
1
I
NFLUENCE OF LIGHT ION IRRADIATION OF THE OXIDE LAYER ON THE OXIDATION RATE OF ZIRCALOY-4
:
IRRADIATION OF THE POST
-
TRANSITION OXIDE LAYERMarc Tupin1, Boris Venague1, Gaëlle Gutierrez2,
1
CEA/DEN/Service d’Etude des Matériaux Irradiés, CEA/Saclay, 91191 Gif-sur-Yvette Cedex, France 2
CEA/DEN/Service de Recherche en Métallurgie Physique, CEA/Saclay, 91191 Gif-sur-Yvette Cedex,
France
Corresponding Author: Marc Tupin _ Tel/Fax: +33-(0)1 69 08 88 69/ 90 73 marc.tupin@cea.fr
Abstract
The oxidation rate of Zircaloy-4 fuel cladding in nuclear reactor strongly increases at high burnups. This
kinetics acceleration could be in large part due to the irradiation damage. The irradiation effect of the
post-transition oxide layer on the Zircaloy-4 corrosion rate has been investigated using protons. As
previously observed on pre-transition oxide layer, irradiation defects increases the oxidation rate of the
alloy up to around 30 days in autoclave in agreement with the irradiation defect annealing characterized
by Raman spectroscopy. The model proposed in previous works is able to describe the oxidation rate
after irradiation of post-transition oxide layers.
2 zirconium (A) Raman spectroscopy (B) SIMS (B) reactor conditions (C) oxidation (C)
1 Introduction
In Pressurized Water Reactors (PWR), fuel cladding made of zirconium alloys are immersed in primary
water at around 300°C and 15.5 MPa containing 0.7 to 2.2 wt.ppm Li, 10 to 1200 wt.ppm B and around
25 cm3 H2/kg of water. In these conditions, the corrosion kinetics of Zircaloy-4 alloy shows a great
acceleration beyond a critical burnup of approximately 35 GWd/tU [1, 2].
The main assumptions suggested in the literature to explain this acceleration are the precipitation of
zirconium hydrides under the metal/oxide interface resulting from the hydrogen uptake by the matrix
during the corrosion process, the tin distribution evolution, the amorphization of the Second Phases
Particles (SPPs) and their dissolution under irradiation [3-14]. This high burnup acceleration could also be
partially caused by the accumulation of irradiation damage in the cladding material or the radiolysis of
the water.
Irradiation in PWR changes indeed the local chemical composition and the microstructure of the
components such as the metal, the oxide layer formed on the cladding and the primary coolant. These
modifications significantly affects the oxidation rate of Zy4 cladding compared to out-of-pile corrosion
experiments [15]. The irradiation effects of each component on the corrosion rate of the fuel cladding
are not currently well known. Unlike oxide layers, metal irradiation was widely studied in the literature
more from a metallurgical point of view than that of the corrosion resistance [16, 17].
However few studies in the literature dealt with the irradiation effect of thin nanometric oxide films on
the corrosion behavior of Zy4. They showed a significant increase of the corrosion rate and these results
were interpreted either by the effect of metal irradiation [18] or in terms of electric field effect or oxygen
diffusion paths through the dislocations induced by irradiation[19]. Progress was recently made on the
3 alloys [20-22]. It was indeed proved that ion irradiation defects and especially oxygen vacancies
generated in thin oxide layers formed on Zy4 result in a significant increase of its oxidation rate. A model
taking into account the vacancy concentration produced by ion irradiation and their thermal stability in
the primary water was proposed in reference [20]. It describes quite well the evolution of the oxidation
kinetics after irradiation. The accelerating factor (~2-3) found with ions in this study is quite close to that
measured between cladding corroded in autoclave and in PWR at low burnup[17, 3] but the oxide layers
formed in reactor are significantly thicker than those studied previously in the references [18, 19, 20, 21,
22] which were obtained during the pre-transition kinetics stage (<2µm).
The present work is then focused on the effect of ion irradiation of a post-transition oxide on the oxidation rate of Zircaloy-4 and on the lifetime of irradiation defects during corrosion in PWR conditions.
It should now be remembered that the oxidation kinetics of zirconium alloys is divided up into two
regimes separated by a kinetic transition :
- the pre-transition one consists in the growth of a protective oxide on the metal and the
oxidation kinetics follows a cubic law [7, 23] ;
- the post-transition one which first shows an increase of the oxidation rate due to the
degradation of the initial protective oxide layer followed by the formation of a new protective
layer beneath the initial one. The kinetics law is either nearly linear or resulting from a
succession of cubic laws.
The corrosion rate during the pre-transition regime is usually considered to be limited by the oxygen
diffusion through the oxide layer and the cubic law has been explained by an electric field effect [24], the
4 The kinetics transition between these two regimes is usually attributed to either the formation of a
porous layer with partial loss of its protective character due to the development of cracks close to the
metal/oxide interface [27, 28, 29] or a stress relaxation associated to the quadratic to monoclinic
transformation [30, 31, 32,] or the development of the metal/oxide interface rugosity [33, 34] or tensile
stresses in the oxide growth direction localized close to the delayed oxidation area [35].
The kinetics curves (linear or cyclic) in the post-transition period can be explained by the following
assumptions :
1. a succession of approximately sub-parabolic kinetics with no real change of kinetics regime
compared with the pre-transition phase whose the rate limiting step is the oxygen diffusion through
a protective layer,
2. a rate-limiting diffusion in a protective layer of constant thickness close to the metal/oxide interface,
3. the direct contact between the gas and the metal (without barrier layer) [28]
4. a rate-limiting diffusion through the outer part of the oxide layer composed of two sub-layers, an
external one and an internal one with their own oxygen transport properties [25, 36].
The last two proposals are confirmed by the increase in the oxidation rate with a water pressure increase
observed by many authors [25, 27, 28, 36, 37]. By doing a series of oxygen or water vapour pressure
changes during experiments, the pressure dependence of the oxidation rate measured just after the
change was approximately linear. But, after an equilibration time, the value of the oxidation rate became
nearly the same as before the pressure change. This behaviour was attributed to either the contact of
the gas with the metal [28] or surface hydroxyl (OHO°) groups transport through short-circuits of the
outer oxide layer [25, 36].
According to the bi-layer structure of the post-transition oxide, the objective of this work is first to
sub-5 layer controls the oxidation kinetics and to extend the model presented in reference [20] to the
post-transition oxide layer.
The experimental approach adopted during this study is similar to that used for the references [20, 21]
and is divided into many stages : preparation and pre-oxidation of the samples, SRIM calculations before
irradiation, irradiation experiments with ARAMIS facilities, RAMAN spectroscopy characterization after
irradiation, re-oxidation in light primary water or in 18O enriched environment, oxidation kinetics
followed by weight gains and 18O diffusion profiles followed by Secondary Ion Mass Spectrometry
analyses.
See reference [20] for more details.
2 Materials and experiments
2.1 Materials
Sheets of recrystallized Zircaloy-4 alloy supplied by CEZUS are used for this study. The chemical
composition of the alloy is given in Table 1. The specimens are cut from a 0.425 mm thick cold-worked
sheet which received a final heat treatment of recrystallization at 700°C for 2 hours. The alloy
microstructure is characterized by an average grain size of about 10 µm [25]. Four samples referenced
Zy4-370, Zy4-371, Zy4-372 and Zy4-373 are polished with diamond paste down to ¼ µm on both sides.
The samples are 25 mm long, 10 mm large and 0.425 mm thick.
Table 1. Chemical composition of Zircaloy-4 sheet (wt%) Alloying
elements
6
Zircaloy-4 0.22 0.11 1.46 0.13 21 Bal.
2.2 Corrosion tests
The Zircaloy-4 samples are first corroded in static autoclaves under PWR simulated conditions with light
water (H216O) at 360 °C and 18.7 MPa of pressure containing 2 wt. ppm of lithium and 1000 wt. ppm of
boron issued from, respectively, lithium hydroxide and boric acid. The aim of this step is to obtain
approximately a 3.5 µm thick oxide layer on the surface of the specimen. The oxidation kinetics is
followed by weight gains measured with a SARTORIUS MC 210 P scale after 64, 98, 150 and 200 days of
exposure time in primary water. The oxide thicknesses are deduced from the weight gain [36] and are in
the end around 3.5 µm as desired. Figure 1 compares the oxidation kinetics of the samples studied with
previous works [20, 7].
Figure 1: oxidation kinetics of Zircaloy-4 specimen (Zy4-370, Zy4-371, Zy4-372, Zy4-373) compared to previous study
7 The oxide growth obtained during the pre-oxidation stage is consistent with the literature data. It can be
also described by the successive power laws given in references [20, 7] by considering that the kinetics
transition occurs at about 140 days. As shown in Figure 1, the kinetics models of references [20, 7]
enclose quite well the experimental dots of this work.
2.3 Irradiation parameters and irradiation damage level
Before irradiation, the simulation code TRIM is used to determine the type of ions and their incident
needed to obtain the desired distribution of defects. TRIM calculations are performed with the same
parameters as reference [20].
In this study, the first goal was to get a relatively uniform defects distribution in the oxide layer in this
study and a similar nuclear damage as reference [20], secondly, to avoid the monoclinic-quadratic phase
transformation in the oxide [38, 39] and thirdly to have a ratio between the energy losses by electronic
interactions and nuclear interactions higher than 1000 as in the reactor core.
For all these reasons, we have irradiated the samples with 0.6 MeV protons ion beam up to a fluence of
1.35x10¹⁸ H+/cm2.
Figures 2 and 3 present, respectively, the location of the implanted hydrogen and the distribution of the
nuclear damage as well as the oxygen vacancy concentration profile in the oxide given by the TRIM
8 0 1 1022 2 1022 3 1022 4 1022 0 1 2 3 4 5 6 h yd ro g e n co n ce n tra ti o n ( A to ms/ cm3 ) depth ( µm) M/Ox interface
Figure 2 : implantation location of 0.6 MeV protons in
the material given by the TRIM code (the line indicates the metal/oxide interface).
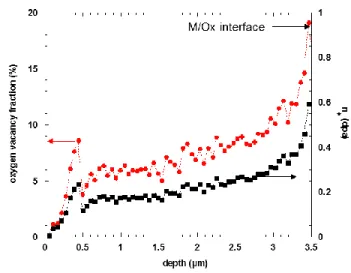
Figure 3 : oxygen vacancy concentration profile and
nuclear damage distribution through the oxide layer according to the TRIM code for a fluence of 1.35x10¹⁸ H+/cm2.
Proton implantation depth shown on Figure 2 is about 1 µm beneath the metal/oxide interface. The
most damaged part of the matrix is thus not immediately involved in the corrosion process and the
metal irradiation effect on the corrosion rate can be neglected just after irradiation (~0.5 dpa) [40]. According to the Figure 3, the nuclear damage and the oxygen vacancy concentration are relatively
uniform in the oxide except close to the metal/oxide interface where they are clearly higher compared
with the surface. Basically, they are multiplied by a factor of about 3.
Table 2 summarizes the irradiation parameters, the damage levels and the average value of the energy
loss ratio between electronic and nuclear interactions in the oxide. The displacement per atom, n (in
9 Table 2 : Irradiation parameters, average damage in the oxide and average energy loss ratio between electronic (Se) and nuclear (Sn) interactions in the oxide.
Ion type Energy (MeV) Fluence (ions/cm²) Flux (ions/cm²/s) Average damage in the oxide (dpa) Average
energy loss ratio between by electronic interactions and nuclear interactions
Se/Sn
H+ 0.6 1.35 x 10¹⁸ 2 x 10¹³ 0.2-0.25 3000
As previously mentioned, the ratio between the energy losses by electronic interactions and nuclear
interactions is higher than 1000. This means that more than 99.9% of the ion energy loss is due to
electronic interactions. This value is close to the ratio between ionizing and nuclear radiation doses in
the reactor core [41]. R. Verlet has proved during his PhD that the energy loss by electronic interactions
does not play a key role on the oxidation rate. Thus we will neglect in the following the effect of
ionization process.
Irradiation experiments were performed in the CSNSM JANNUS-Orsay of the University Paris Sud with
the 2 MeV tandem accelerator named ARAMIS ion implanter.
2.4 Characterization of the samples by Raman Spectroscopy
The samples are characterized before and after irradiation by Raman spectroscopy to qualitatively
estimate the concentration of irradiation defects in the oxide and follow their annealing during the
re-oxidation after the irradiation [45, 20].
The analyses of the damaged oxide structure are performed by a RENISHAW InVia Reflex® spectrometer
10 recorded with the same experimental parameters, namely with a 532 nm beam of a frequency-doubled
Nd-YAG laser focused on a 1 µm² spot and a power of 0.2 mW on the sample.
Because the real probe depth by the laser is difficult to evaluate (theoretically few microns maybe less),
two kinds of measurements have been carried out, either on the surface of the specimen or on a
cross-section of the specimen. In this case, many spectra at various depth from the surface have been acquired
in the oxide layer.
2.4.1 Surface analyses
As explained in reference [20] some pure phases of zirconia were first analyzed. As expected and
illustrated in Figure 4, the Raman spectrum of the 3.5 µm unirradiated thick oxide layer formed after a
200-days exposure time to PWR environment (see red continuous line with red full circle markers in Figure 4)
presents all the vibration bands of the monoclinic phase and some of the tetragonal zirconia, especially
the one at 145 cm-1 which is not very intense. A band at around 280 cm-1 corresponding to the tetragonal
phase is usually observed on thin oxide layers. The shift of this band in comparison to the band at 267
cm-1 on the spectrum of released tetragonal zirconia is often attributed to the compressive stresses
and/or low grain size in the oxide [43, 44]. The absence of this band on spectrum acquired from the surface
means probably that the laser light does not analyze the part of the oxide layer close to the metal/oxide
11 Figure 4: Raman spectra of a 3.5 µm unirradiated oxide layer – red continuous line with red full circle markers – and
an oxide layer irradiated with 0.6 MeV H+ ion at a fluence of 1.35x1018 cm-² -black continuous line with black full square markers. Long dotted line correspond to vibration bands of the tetragonal phase.
Since the maximum damage level is below 1 dpa (cf. Figure 3), phase transition should not happen [38,
39]. As previously described in reference [20], many changes are observed on the Raman spectra after
irradiation (see reference [20] for more details). The most important differences are the emergence of
two “new” vibration bands, one at 265 cm-1 corresponding theoretically to a vibration mode of the
tetragonal phase and the second one at 712 cm-1. This latter is a signature of irradiation defects and
allows following the evolution of their concentration in the oxide as described in the model developed in
reference [20].
2.4.2 Cross-section analyses
The aim of the cross-section analyses was to study the evolution of the vibration modes as a function of
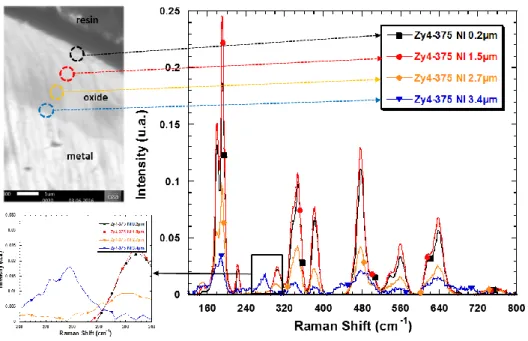
12 Figure 5 presents Raman spectra recorded at different oxide depths, basically, 0.2, 1.5, 2.7 and 3.4 µm
from the surface.
Figure 5: Raman spectra performed at different oxide depth from the surface of a 3.5 µm unirradiated oxide layer –
0.2 µm : black square – 1.5 µm : red circles – 2.7 µm : orange diamonds – 3.4 µm : blue triangle.
The Raman spectra recorded at 0.2 and 1.5 µm from the surface are very similar to that acquired on the
surface presented in Figure 4. However, these in the inner part of the oxide show a lower cumulative
intensity. The spectrum acquired close to the metal/oxide interface (line with blue triangles in Figure 5)
presents the typical vibration band at 280 cm-1 corresponding probably to a vibration mode of tetragonal
zirconia under stress.
Similar analyses have been carried out on an irradiated oxide. The example presented in Figure 6
corresponds to an irradiated oxide layer which has been re-oxidized 6 hours in primary water. Irradiation
defects should have been slightly annealed during this exposure time. However we observe an important
increase of 710 cm-1 Raman band intensity when the spectrum is acquired closer and closer to the
13 Figure 6 : Raman spectra performed at different oxide depth from the surface of a sample irradiated with protons
and re-oxidized 6 hours in primary water– 0.2 µm : light blue square – 1.1 µm : red circles – 1.9 µm : orange diamonds – 2.6 µm : blue triangle -3.4 µm : half full dark square. Ramam spectrum of unirradiated sample - green empty circles.
The increase of the 710 cm-1 Raman band magnitude as a function of the oxide depth is due to the
distribution of irradiation defects whose concentration increases in the inner part of the oxide according
to the TRIM calculations (Figure 3). As shown in Figure 7, the evolution of this Raman band intensity is
indeed correlated with the nuclear damage as well as oxygen vacancy concentration through the oxide
14 Figure 7 : relative intensity of the Raman band at 710 cm-1 (compared with the global intensity of the Raman spectrum and the maximum of magnitude of the 710 cm-1 Raman band) and nuclear damage versus oxide depth (from the surface to the M/Ox interface).
Finally, the irradiation defect concentration in the inner part of the oxide layer is likely two or three
times higher than those in the outer part.
3 Kinetics results and modelling
Two types of experiments have been carried out to study the irradiation effect of post-transition oxide
15 1. Experiments with isotopic markers of oxygen, 18O, have been performed in primary water enriched in
18
O at 20% to follow the oxygen diffusion through the bi-layer oxide structure and determine the
effect of irradiation on the diffusion processes;
2. Usual corrosion tests in autoclave have been done and the oxidation kinetics has been followed by
weight gains.
3.1 Isotopic exposure and SIMS profiles
During this study, unirradiated and irradiated specimens are (re-)oxidized during, successively, 6 hours,
24 hours, 48 hours and 14 days in a mixture containing 20 % of H218O (in volume) and 80% of heavy
water (D2O).
Then, after each isotopic exposure time (6 hours, 24 hours etc…), 18O diffusion profiles are studied using
Secondary Ion Mass Spectrometry. Raman spectra are also acquired from the surface to follow the
evolution of irradiation defect concentration.
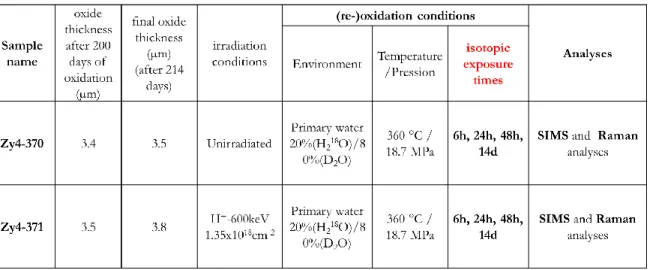
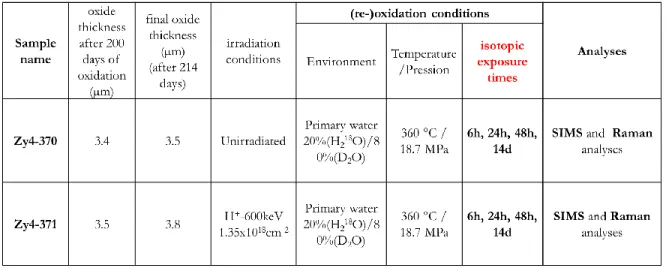
Experiment data are summarized in Table 3.
Table 3 : specimen name, irradiation parameters, oxidation conditions, isotopic exposure times, oxidation
16 The diffusion profiles in the oxide layers are recorded with a CAMECA IMS 7F (GeMaC CNRS laboratory of
the University of Versailles Saint-Quentin-en-Yvelines, France). The measurement parameters and the
data analyses are the same as reference [20]. Note that the SIMS profiles are normalized at 10 millions of
counts per second for oxygen 16 in order to be comparable with each other and 18O atomic fraction is
deduced from 18O treated signal compared to 16O intensity.
3.1.1 Short isotopic exposure times
As evidenced in Figure 8, the 18O SIMS profile obtained at 24 and 48 hours of isotopic exposure are very
similar in the outer part of the oxide. The steady state is thus attained very quickly in this part. Due to
the very low 18O concentrations in the middle of the outer oxide, this sub-layer could play a role as
bottleneck and could take part in the control of the oxidation rate by limiting the oxygen flux arriving to
the intermediate interface between the outer part and the inner part of the oxide which could explain
the progressive increase of 18O concentration at this interface. This behavior of the oxygen transport
17 Figure 8 : 18O atomic fraction versus oxide depth for unirradiated material (Zy4370_empty markers) and irradiated Zy4 (Zy4371_full markers) exposed to various exposure times (6 hours (diamonds), 24 hours (squares) and 48 hours (circles)).
Secondly, an 18O accumulation area is observed at an oxide depth of around 2 µm corresponding to the
thickness of the kinetics transition. The 18O concentrations at this oxide depth increase with the isotopic
exposure time. The oxygen penetration depth, in particular for the unirradiated material, is also deeper
when the exposure time is higher. The two previous experimental observations mean that both the
reaction at the interface between the outer oxide and the inner oxide and the oxygen diffusion through
18 The comparison between unirradiated and irradiated materials leads to the conclusion that the 18O
concentration at the interface between the outer oxide and the inner oxide as well as the 18O
penetration depth in the inner oxide are higher for the irradiated specimen whatever the exposure time.
3.1.2 Long term exposure
For longer exposure times, the oxygen 18 penetrates and diffuses within the metaland the 18O diffusion
profiles give information on the main diffusion process through the oxide layer.
In this case, we chose to represent the 18O SIMS profiles in 18O normalized intensity (cs/s) versus depth
rather than with 18O atomic fraction.
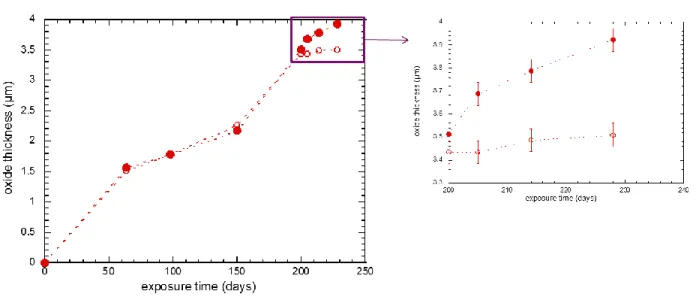
Figure 9 shows the 18O distribution in the material for irradiated and unirradiated samples having
undergone 48 hours and 14 days of isotopic exposure times. The irradiated material exposed during 14
days in H218O presents a significant oxide growth from 3.5 up to 3.8 µm while the reference specimen
shows an increase of its oxide thickness of approximately 0.1 µm. As drawn on Figure 9, the metal/oxide
interfaces during 14 days are thus moved from the grey dotted line to the large black dotted line for the
19 Figure 9 : 18O SIMS intensity versus depth for unirradiated material (Zy4370_ empty markers) and irradiated Zy4
(Zy4371_ full markers)) exposed to various exposure times (circles for 48 hours and diamonds for 14 days).
As already mentioned, the irradiated specimen re-oxidized 48 hours in H218O has much more 18O in the
inner part of the oxide in comparison with the unirradiated sample.
The high concentration of 18O beneath the metal/oxide interface observed on the irradiated material and
the huge penetration depth in the metal evidences the spreading and the strong diffusion of oxygen 18
within the metal. The 18O amount integrated in the irradiated metal is much greater than the one in the
reference material, which shows the strong difference of oxidation rates between both materials again.
As explained by Basu and co-workers [45], these results reveal also that oxygen diffuses mainly through
short circuits in the oxide such as grain boundaries, cracks and pores rather than in the volume of the
20
3.1.3 Average
18O diffusion flux ratio between unirradiated and irradiated materials
As explained in reference [20], the average diffusion flux is given by the following formula (Eq. 1):
ex ox e 0 O 18 O 18 Δt x I =A J d (Eq. 1)
where A is a constant, I18O, the intensity of 18O SIMS profiles, eox, the oxide thickness (µm) , tex, the isotopic exposure time (24 hours).
The oxygen diffusion flux variations due to irradiation damage can be compared to that of the
unirradiated material using the following equation (Eq. 2):
ox e NI O ox e O NI O Ox
I
x
I
J
J
0 18 0 18 18 18d
d
=
(Eq. 2) whereI
18Oand NI OI
18 are, respectively, the 18O SIMS profile intensities of the irradiated () and the unirradiated materials (NI).
O J18 and
NI O
J18 are, respectively, the average diffusion fluxes of
18
O in the
oxides irradiated at the fluence or not (NI) during a given exposure time. eox is the oxide thickness. In the oxide, the intensity of 18O SIMS profiles (I18O) can be replaced by the 18O atomic fraction (x18O) in
the previous formula. Only the value of the constant A will be changed in the equation (Eq.1). The
equation (Eq.2) is unmodified by this substitution.
The ratio of the average diffusion fluxes during the isotopic exposure time is then deduced from the ratio
of 18O atomic fraction signal integration. Table 4 summarizes the values of the oxygen diffusion flux
21 Table 4 : values of the oxygen diffusion flux ratios for various exposure times.
Re-oxidation time (hours)
Oxygen diffusion flux ratio J(18O)/Jref(18O)
6 1.62
24 1.67
48 1.58
The oxygen diffusion flux ratio between the irradiated material and the unirradiated one is around 1.6
which shows the effect of the oxide irradiation on the diffusion rate even though the damage level is
relatively low (<0.5 dpa).
For the most exposed materials (14 days), the ratio of the 18O amount (Figure 9) integrated within the
materials (oxide + metal) between irradiated and unirradiated specimen is higher, basically
approximately 2.5, compared with the values provided in Table 4, which indicates a greater difference of
oxidation rate.
3.1.4 Evolution of the irradiation defect concentration by Raman Spectroscopy
As the variations of the 710 cm-1 Raman band intensity allow following the progressive annealing of the
irradiation defects, Raman spectroscopy has been performed after each exposure time on the irradiated
specimen. Figure 10 describes the evolutions of Raman spectra and the 710 cm-1 Raman band
22 Figure 10 : Raman spectra acquired on the surface of the 3.5 µm unirradiated oxide layer –line with red full circle
markers -, the irradiated oxide layer - line with black full square markers - , the irradiated oxide layer formed on Zy4 specimen, re-oxidized 6 hours in primary water –line with light green full diamond markers -, the irradiated oxide layer formed on Zy4 specimen, re-oxidized 24 hours in primary water–line with blue half full blue square markers (cut in diagonal) - the irradiated oxide layer formed on Zy4 specimen re-oxidized 48 hours in primary water – dark green continuous line with half full dark green square markers -, the irradiated oxide layer formed on Zy4 specimen re-oxidized 14 days in primary water –line with full blue triangle markers - . Long dotted line: tetragonal phase.
In accordance with reference [20], a slight decrease of the magnitude of the 710 cm-1 Raman band is
observed during 6 hours of exposure in primary water compared to that obtained just after irradiation.
Then the intensity does not significantly evolve up to 48 hours. In other words, irradiation defect
concentration slightly decreases first and is then constant.
After 14 days of re-oxidation, the presence of the irradiation defects is always detectable but the
intensity has significantly decreased.
3.2 Oxidation kinetics
3.2.1 Kinetics curves obtained by weight gains
Corrosion tests in light primary water in autoclave have been also performed during 28 days after proton
23 rate. The oxidation kinetics has been followed by the weight gain at three different exposure times of
re-oxidation, 5, 14, 28 days.
Table 5 sums up the specimen and the experiments performed during this study.
Table 5: Oxide thicknesses, oxidation conditions, exposure times and experimental analyses.
Figure 11 shows the evolution of the oxide thicknesses as a function of time for both specimen
(irradiated Zy4-372, unirradiated Zy4-373).
Figure 11 : oxide thickness versus exposure time in light primary water for the unirradiated material (Zy4373_
24 The irradiated sample oxidizes considerably faster compared to the unirradiated material, in particular,
just after irradiation. Basically, by drawing and measuring the slopes of the kinetics curves just after
irradiation, the oxidation rate ratio between the irradiated specimen and the unirradiated sample is
greater than 3 and close to 4. This value is clearly much higher than the oxygen diffusion flux ratio
measured by 18O SIMS profiles which was about 1.6. It is probably due to the fact that the global oxygen
amount measured from the SIMS profile takes into account the contribution of 18O in the outer part of
the oxide. The oxygen profile in this latter is quickly constant which means that the oxygen ions have to
be considered as trapped in the oxide. In other words, we take into account oxygen in the outer part
while this oxygen does not really take part in the rate–limiting diffusion process. The oxygen diffusion
rate ratio underestimate thus the oxidation rate increases after irradiation.
Secondly, the irradiation effect decreases with exposure time but still remains up to 28 days.
To sum up, irradiating the post-transition oxide layer induces a strong increase of the oxidation rate of
the material.
3.2.2 Evolution of the irradiation defect concentration by Raman Spectroscopy
After each exposure time, Raman spectroscopy analyses have been performed on the surface in order to
follow the annealing rate of the irradiation defect. Figure 12 presents the Raman spectra focused on the
band characteristic of the irradiation defects obtained after each exposure time on the irradiated
25 Figure 12 : Raman spectra acquired on the surface in the range between 680 and 780 cm-1 of a 3.5 µm unirradiated oxide layer – empty circle markers -, the irradiated oxide layer - black full circle markers - , an irradiated oxide layer formed on the specimen re-oxidized 5 days in light primary water – light blue full square markers -, an irradiated oxide layer formed on the specimen re-oxidized 14 days in light primary water – red full diamonds markers (cut in diagonal) - , an irradiated oxide layer formed on the specimen re-oxidized 28 days in light primary water –orange full triangle markers.
In agreement with the Raman spectrum evolution obtained during the SIMS study (cf. Figure 9),
irradiation defects remain after 14-days re-oxidation time. However, the band has completely
disappeared for the longest exposure time (28 days).
This result means that there is no more defects in the outer part of the oxide after 28 days. The
annealing rate of irradiation defects is very similar to the one already observed in the pre-transition
oxide layer [20].
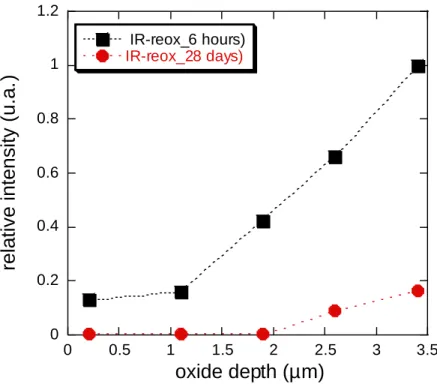
But, due to the irradiation defect concentration gradient through the oxide (cf. Figure 7), a residual
re-26 oxidation time as illustrated on Figure 13. This result can explain the fact that the oxidation rate of the
irradiated sample is still superior to the one of the unirradiated material 28 days after irradiation
Figure 13 : relative intensity versus oxide depth for the irradiated Zy4 re-oxidized 6 hours (Zy4371_ full square
markers) and 28 days in primary water (Zy4373_ full circle markers).
3.3 Modelling of the oxidation kinetics after irradiation
The model developed in reference [20] has been tested on the kinetics curve obtained after irradiation
of the post-transition oxide layer.
It is remembered the basis of the modelling. Ion irradiation produces two types of irradiation defects
according to reference [46]. The annealing rates of the two types of defects follow first order kinetics.
The annealing kinetics law of irradiation defect in the pre-transition oxide found in reference [20] is
written as follows (Eq. 3):
0 0.2 0.4 0.6 0.8 1 1.2 0 0.5 1 1.5 2 2.5 3 3.5 IR-reox_6 hours) IR-reox_28 days)
re
la
ti
ve i
nte
n
sity (u
.a.
)
oxide depth (µm)
27
(Eq. 3)
where I(t), Imax(t=0) are the intensities of the 710 cm-1 Raman bands at the times, t and t equal to 0 (t,
exposure time after irradiation).
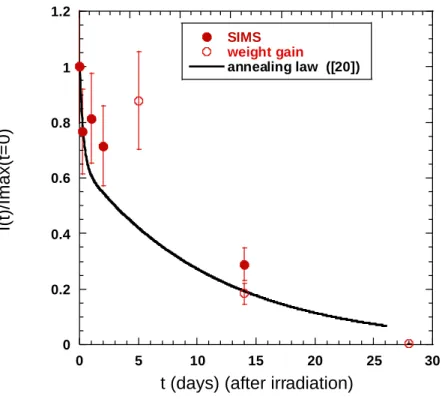
This annealing law is drawn in Figure 14 and is compared with the relative intensity of the 710 cm-1
Raman band obtained at different re-oxidation time for the SIMS and weight gain studies.
Figure 14 : annealing law of irradiation defects (Eq. 3) (black continuous line) and relative intensity of the 710 cm-1
Raman band (compared with the maximum intensity obtained just after irradiation) versus exposure time after irradiation for the SIMS study (full circles) and weight gain study (empty circles).
This annealing law obtained in the pre-transition stage describes from a satisfactory manner the
experimental evolution of the irradiation defect fraction within the post-transition oxide layer
(represented by the relative intensity of the 710 cm-1 Raman Band).
0 0.2 0.4 0.6 0.8 1 1.2 0 5 10 15 20 25 30 SIMS weight gain annealing law ([20]) I(t) /Ima x(t= 0)
28 This modelling is secondly based on the assumption that the oxygen flux in the irradiated oxide is the
sum of two contributions, the one coming from the thermal defects existing in the unirradiated oxide
(such as vacancies created at the M/Ox interface) and the second due to the irradiation defects.
It is thus expressed as follows (Eq. 4):
(Eq.4)
where Jϕ(t) is the oxygen flux for the irradiated material as a function of the exposure time in primary
water (after irradiation), JNI is the oxygen flux of the unirradiated material given by the first Fick’s law and
Jd(t) the oxygen flux through the irradiation defects.
For the post-transition stage we will consider that the oxidation rate is controlled by the oxygen diffusion process through the inner part of the oxide layer (see Figure 8).
Assuming a diffusion process exclusively through the grain boundaries as in the reference [20], the
oxygen flux through the unirradiated oxide is proportional to the volume fraction of grain boundaries
(Eq. 5):
(Eq.5)
where fgb is the volume fraction of grain boundaries in the oxide, Dgb the oxygen diffusion coefficient
through grain boundaries (cm2/s), eox_int(t) the oxide thickness of the inner oxide at the time t and Co the
oxygen concentration in the oxide (mol/cm3).
The oxygen flux through the irradiation defects is expressed as a function of the defect density and the
diffusion coefficient via the defects (Eq. 6):
(Eq. 6)
where fd is the defect density in the oxide and Dd the oxygen diffusion coefficient through irradiation
29 The defect density at time t is proportional to the relative intensity of the 710 cm-1 Raman band and is
thus given by the following formula (Eq. 7) :
(Eq. 7)
To “solve” the problem, we need to know the initial concentration of defects, .
In reference [20], this defect density is not directly estimated. But by fitting the oxygen flux ratio with the
equation (Eq. 8) depending of the annealing law of irradiation defects, the defect concentration can be
integrated in the fitted parameter, A :
(Eq. 8)
The fitted parameter A is equal to 2.5 in reference [Verlet_2012] for a nuclear damage level of around
0.4 dpa.
We will suppose that the concentration of oxygen vacancies produced by irradiation decreases with the
same rate wherever the location of defects in the oxide. This concentration is proportional to the value
of displacement per atom, n The driving force of the oxygen diffusion flux is the production of oxygen
vacancies at the metal/oxide interface during the oxidation of the metal. The highest concentration of
vacancy defects induced by irradiation is localized close to the metal/oxide interface. Thus the oxygen
flux through the whole oxide will be imposed by the flux at the metal/oxide interface acting as a oxygen
30 As shown in Figure 7, the nuclear damage is around 0.6 dpa so an increase of around 50% compared to
the dpa value in pre-transition (0.4) for reference [20]. For this study, A has thus been taken equal to 3.8
(~2.5x1.5).
The oxide growth rate is proportional to the oxygen diffusion flux through the inner oxide and is
expressed as follows (Eq. 9) :
(Eq. 9)
The evolution of the oxide thickness of the irradiated material is given by the following formula (Eq. 10) :
which can be also written :
which also expresses as follows (Eq. 11):
(Eq.10)
with tpreox the preoxidation time (200 days)
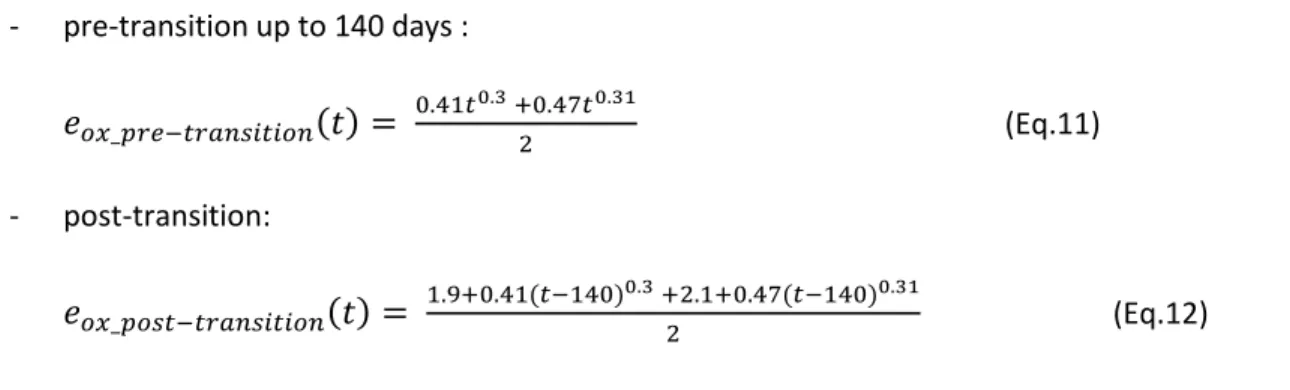
For the unirradiated material, the kinetics law drawn in Figure 15 is taken to be equal to the arithmetic
mean of the oxide thicknesses coming from the kinetics laws of references [7, 20] (see Figure 1). It thus
31 - pre-transition up to 140 days :
(Eq.11) - post-transition:
(Eq.12)
The kinetics law for the irradiated material deduced from the arithmetic mean of the power laws of
references [7, 20] is expressed as the following formula (Eq. 13) :
It is also possible to write the same expression from the kinetics law of reference [7] (Eq. 12):
(Eq.13)
Figure 15: Oxidation Kinetics of irradiated Zircaloy-4 specimen (Zy4-372_ full square) compared to the kinetics law
deduced from the model for irradiated (dotted line with empty squares) and unirradiated (dotted line with empty circles) materials.
32 As evidenced in Figure 15, the kinetics model developed in reference [20] describing the irradiation
effect of the pre-transition oxide layer is also able to simulate from a very satisfactory manner the
experimental kinetics obtained after irradiation of a post-transition oxide layer.
In other words, the model developed in the pre-transition stage [20] can be extrapolated to the
post-transition kinetics regime by considering that the oxidation rate of the unirradiated material is mainly
controlled by the oxygen flux through the short-circuits of the inner layer and the irradiation defects
provide new oxygen diffusion paths within this part of the oxide.
4 Conclusions
The experimental approach developed in reference [20] has been used to study the irradiation effect of a
post-transition oxide layer on the oxidation kinetics of Zircaloy-4. After pre-oxidation of Zircaloy-4
coupons up to the post-transition kinetics regime, proton irradiation tests have been performed to get a
“quasi-uniform distribution of defects”.
The main conclusions drawn from Raman spectroscopy, SIMS analyses and direct measurements of mass
gain are the followings :
1. The 710cm-1 Raman band characteristic of the irradiation defects is still observed after proton
irradiation of a post-transition oxide layer. Its intensity across the oxide follows the irradiation
defect density given by the SRIM calculations. As already observed in pre-transition, their
presence in the outer part of the oxide lasts at least 14 days and they completely disappeared
after 28 days. However they are always detected close to the metal/oxide interface (up to 28
days).
2. According to SIMS results, both the reaction at the interface between the outer oxide and the
inner oxide and the oxygen diffusion through the inner oxide layer take apparently part in the
33 irradiation, leading to an oxygen diffusion rate around 1.6 times higher than the one obtained on
the unirradiated material. The 18O amount integrated in the irradiated metal is also much greater
than the quantity within the reference material which shows the strong difference of oxidation
rates between both materials.
3. The increase of the oxidation rate after irradiation observed on the kinetics curves is huge and
more pronounced than the oxygen diffusion rate ratio. This acceleration then decreases when
the irradiation defects are progressively annealed and lasts up to 28 days.
4. The model developed in pre-transition allows also describing the kinetics results obtained during
this study on the post-transition regime.
The ion irradiation of the oxide layer has a marked effect on the corrosion rate of zircaloy-4 alloy. If the
irradiation defects are present within the oxide formed in reactor, the kinetic impact of irradiation
defects is probably added to the effect of the hydrides precipitated beneath the metal/oxide interface
and both could contribute to the high burn up acceleration of the oxidation of zircaloy-4 alloy in the
nuclear power plants. Nevertheless, their presence has still to be proved by analyzing fuel rod claddings
with RAMAN Spectroscopy.
Acknowledgments
EDF and FRAMATOME are acknowledged for their financial support. The writers would like to thank all
who have contributed to this study and in particular the staff of ARAMIS accelerators of JANNUS-Orsay
and of JANNUS-Saclay for the accessibility of the Raman Spectroscopy facility.
References
[1] G.L. Garner, B.A. Hilton and E. Mader, “Performance of alloy M5TM cladding and structure”, LWR Fuel Performance Meeting/Top Fuel, San Francisco, 30th septembre-3th October, 2007
34
[2] P. Bossis, D. Pêcheur, K. Hanifi, J. Thomazet and M. Blat, "Comparison of the high burn-up corrosion on M5 and low tin Zircaloy-4", in: Zirconium in the Nuclear Industry: 14th International Symposium, ASTM STP 1467 (2005) 494-525 (paper ID JAI12404 available online at www.astm.org).
[3] M. Blat and D. Noel, "Detrimental role of hydrogen on the corrosion rate of zirconium alloys", in: Zirconium in the Nuclear Industry: 11th International Symposium, ASTM STP 1295 (1996) 319-337.
[4] M. Blat, L. Legras, D. Noel and H. Amanrich, "Contribution to a better understanding of the detrimental role of hydrogen on the corrosion rate of Zircaloy-4 cladding materials", in: Zirconium in the Nuclear Industry: 12th International Symposium, ASTM STP 1354 (2000) 563-591.
[5] M. Tupin, C. Bisor, R. Verlet, F. Martin, P. Bossis, F. Jomard, P. Berger, S. Pascal, N. Nuns, Corrosion Science 98 (2015) 478-493
[6] V. Bouineau, A. Ambard, G. Bénier, D. Pêcheur, J. Godlewski, L. Fayette, and T. Duverneix, "A new model to predict the oxidation kinectics of zirconium alloys in a Pressurized Water Reactor", in: Zirconium in the nuclear industry: 15th International Symposium, ASTM STP 1505 (2008) 405-429 (paper ID JAI10131 available online at
www.astm.org).
[7] M. Tupin, F. Martin, C. Bisor, R. Verlet, P. Bossis, F. Jomard, P. Berger, S. Pascal, N. Nuns, Corrosion Science 16 (2017) 1-13
[8] Kido, T., "A study on enhanced uniform corrosion of Zircaloy-4 cladding during high burnup operation in PWR's", in: 6th International Symposium on Environmental Degradation of Materials in Nuclear Power Systems, Hardcover (1993) 449-454.
[9] X. Iltis, F. Lefebvre and C. Lemaignan, "Microstructure Evolutions and Iron Redistribution in Zircaloy Oxide Layers: Comparative Effects of Neutron Irradiation Flux and Irradiation Damages", in: Zirconium in the Nuclear Industry: 11th International Symposium, ASTM STP 1295 (1996) 242-264.
[10] X. Iltis, F. Lefebvre, C. Lemaignan, Journal of Nuclear Materials 224 (1995) 121-130
[11] M. Tupin, R. Verlet, K. Colas, M. Jublot, G. Baldacchino, K. Wolski, Corrosion Science 136 (2018) 28–37
35
[13] F. Garzarolli, Y. Broy and R. A. Busch, "Comparison of the long-time corrosion behavior of certain Zr alloys in PWR, BWR, and laboratory tests", in: Zirconium in the Nuclear Industry: 11th International Symposium, ASTM STP 1295 (1996) 12-32.
[14] A. M. Garde, A. R. Pati, M. A. Krammen, G. P. Smith and R. K. Endter, "Corrosion Behavior of Zircaloy-4 Cladding with Varying Tin Content in High-Temperature Pressurized Water Reactors", in: Zirconium in the Nuclear Industry: 10th International Symposium, ASTM STP 1245 (1994) 760-778.
[15] D. Gilbon, “Les matériaux de gaines et d’assemblage” Les combustibles Nucléaires, monographie de la DEN, Edition du Moniteur, Paris, 2008, p. 38.
[16] F. Onimus, J.L. Bechade, Radiation Effects in Zirconium Alloys, Comprehensive Nuclear Materials, Elsevier, Oxford, 2012.
[17] P. Dayal, D. Bhattacharyya, W.M. Mook, E.G. Fu, Y.-Q. Wang, D.G. Carr, O. Anderoglu, N.A. Mara, A. Misra, R.P. Harrison, L. Edwards, Journal of Nuclear Materials 438 (2013) 108-115
[18] P. J. Harrop, N. J. M. Wilkins and J. N. Wanklyn, Corrosion Science 7 (1967) 289-297
[19] X. D. Bai, S. G. Wag, J. Xu, J. Bao, H. M. Chen and Y. D. Fan, Journal of Nuclear Materials 254 (1998) 266-270
[20] R. Verlet, M. Tupin, G. Baldacchino, K. Wolski, S. Miro, D. Gosset, K. Colas, M. Jublot, F. Jomard, Corrosion Science 98 (2015) 327–338.
[21] M. Tupin, J. Hamann, D. Cuisinier, P. Bossis, M. Blat, A. Ambard, A. Miquet and D. Kaczorowski, “Understanding of corrosion mechanisms of zirconium alloys after irradiation: effect of ion irradiation of the oxide layers on the corrosion rate”, in: Zirconium in the nuclear industry, 17th international symposium, ASTM STP 1543 (2014) 438-478.
[22] M. Tupin, R. Verlet, K. Wolski, S. Miro, G. Baldacchino, M. Jublot, K. Colas, P. Bossis, A. Ambard,D. Kaczorowski, M. Blat and I. Idarraga, "Understanding of corrosion mechanisms after irradiation : effect of ion irradiation of the oxide layers on the corrosion rate of M5® " in Zirconium in the Nuclear Industry, 18th International symposium, ASTM STP 1597 (2018) 415-447
36
[23] A. Couet, A. T. Motta, R. J. Comstock, Journal of Nuclear Materials 451 (2014) 1–13
[24] A. Couet, A. T. Motta, A. Ambard, Corrosion Science 100 (2015) 73–84
[25] Y. Dali, M. Tupin, P. Bossis, M. Pijolat, Journal of Nuclear Material 426 (2012) 148-159
[26] G. Zumpicchiat, S. Pascal, M. Tupin, C. Berdin-Méric, Corros. Sci. 100 (2015) 209–221.
[27] J.K. Dawson, G. Long, W.E. Seddon and J.F. White, Journal of Nuclear Materials 25 (1968) 179
[28] B. Cox, Journal of Nuclear Materials 148 (1987) 332
[29] N. Ni, S. Lozano-Perez, J.M. Sykes, G.D.W. Smith, C.R.M. Grovenor, Corrosion Science 53 (2011) 4073–4083
[30] P. Barberis, Journal of Nuclear Materials 226 (1995) 34
[31] N. Pétigny, P. Barberis, C. Lemaignan, Ch. Valot and M. Lallemant, Journal of Nuclear Materials 280 (2000) 318
[32] P. Platt, P. Frankel, M. Gass, R. Howells, M. Preuss, Journal of Nuclear Materials 454 (2014) 290-297
[33] P. Bossis, F. Lefebvre, P. Barberis and A. Galerie, « Corrosion of zirconium alloys: link between the metal / oxide interface roughness, the degradation of the protective oxide layer and the corrosion kinetics » Materials Science Forum Vols. 369-372 (2001) pp 255-262
[34] P. Platt, S. Wedge, P. Frankel, M. Gass, R. Howells, M. Preuss, Journal of Nuclear Materials 459 (2015) 166–174
[35] P. Platt, P. Frankel, M. Gass and M. Preuss, Journal of Nuclear Materials 464 (2015) 313-319
[36] M. Tupin, M. Pijolat, F. Valdivieso, M. Soustelle, A. Frichet, P. Barberis, Journal of Nuclear Materials 317 (2003) 130-144
[37] Y. Ok and Y. Kim, J. Korean Nuclear Society 30 (1998) 396
37
[39] C. Gibert-Mougel, F. Couvreur, J. M. Costantini, S. Bouffard, F. Levesque, S. Hémon, E. Paumier and C. Dufour, Journal of Nuclear Materials 295 (2001) 121-125
[40] G.G. Bentini, M. Berti, A. Carnera, G. Della Mea, A.V. Drigo, S. Lo Russo, P. Mazzoldi and G. Dernaley, Corrosion Science 20 (1980) 27-39.
[41] R. Salot, “Influence de la radiolyse sur la cinétique d’oxydation des alliages de zirconium en milieu REP”, PhD Thesis, Institut National Polytechnique de Grenoble, 1996.
[42] S. Miro, E. Bordas, L. Thomé,J.-M. Costantini, D. Gosset, F. Leprêtre, P. Trocellier,L. Beck, R. Verlet, J. Huguet-Garcia, Y. Serruys, M. Tupin and M. Belleil, “Monitoring of the microstructure of ion-irradiated nuclear ceramics by
in situ Raman spectroscopy” Journal of Raman spectroscopy (2015) (wileyonlinelibrary.com) DOI 10.1002/jrs.4837
[43] J. Godlewski, J.P. Gros, M. Lambertin, J.F. Wadier and H. Weidinger, “Raman spectroscopy study of the tetragonal-to-monoclinic transition in zirconium oxide scales and determination of overall oxygen diffusion by nuclear microanalysis of 18O”, in: Zirconium in the Nuclear Industry: 9th International Symposium, ASTM STP 1132 (1991) 416-436.
[44] P. Bouvier and G. Lucazeau, Journal of Physics and Chemistry of Solids 61 (2000) 569-578.
[45] S. N. Basu and J. W. Halloran, Oxidation of Metals 36 (1987) 317-337
38 Tables
Table 1. Chemical composition of Zircaloy-4 sheet (wt%)
Alloying elements
Fe Cr Sn O H, ppm Zr
Zircaloy-4 0.22 0.11 1.46 0.13 21 Bal.
Table 2 : Irradiation parameters, average damage in the oxide and average energy loss ratio between electronic (Se) and nuclear (Sn) interactions in the oxide.
Ion type Energy (MeV) Fluence (ions/cm²) Flux (ions/cm²/s) Average damage in the oxide (dpa) Average
energy loss ratio between by electronic interactions and nuclear interactions
Se/Sn
H+ 0.6 1.35x10¹⁸ 2 x 10¹³ 0.2-0.25 3000
39
Table 4 : values of the oxygen diffusion flux ratios for various exposure times.
Re-oxidation time (hours)
Oxygen diffusion flux ratio J(18O)/Jref(18O)
6 1.62
24 1.67
48 1.58
40 Figure Captions
Figure 1: Oxidation Kinetics of Zircaloy-4 specimen (Zy4-370, Zy4-371, Zy4-372, Zy4-373) compared to previous
study (red circles) and usual cubic law (dotted line) from references [Verlet_2015-Tupin_2017].
Figure 2 : implantation location of 0.6 MeV protons in the material given by the TRIM code (the line indicates the
metal/oxide interface).
Figure 3 : oxygen vacancy concentration profile and nuclear damage distribution through the oxide layer according
to the TRIM code for a fluence of 1.35x10¹⁸ H+/cm2.
Figure 4: Raman spectra of a 3.5 µm unirradiated oxide layer – red continuous line with red full circle markers – and
an oxide layer irradiated with 0.6 MeV H+ ion at a fluence of 1.35x1018 cm-² -black continuous line with black full square markers. Long dotted line correspond to vibration bands of the tetragonal phase.
Figure 5: Raman spectra performed at different oxide depth from the surface of a 3.5 µm unirradiated oxide layer –
0.2 µm : black square – 1.5 µm : red circles – 2.7 µm : orange diamonds – 3.4 µm : blue triangle.
Figure 6 : Raman spectra performed at different oxide depth from the surface of a sample irradiated with protons
and re-oxidized 6 hours in primary water– 0.2 µm : light blue square – 1.1 µm : red circles – 1.9 µm : orange diamonds – 2.6 µm : blue triangle -3.4 µm : half full dark square. Ramam spectrum of unirradiated sample - green empty circles.
Figure 7 : relative intensity of the Raman band at 710 cm-1 (compared with the global intensity of the Raman spectrum and the maximum of magnitude of the 710 cm-1 Raman band) and nuclear damage versus oxide depth (from the surface to the M/Ox interface).
Figure 8 : 18O atomic fraction versus oxide depth for unirradiated material (Zy4370_empty markers) and irradiated Zy4 (Zy4371_full markers) exposed to various exposure times (6 hours (diamonds), 24 hours (squares) and 48 hours (circles)).
Figure 9 : 18O SIMS intensity versus depth for unirradiated material (Zy4370_ empty markers) and irradiated Zy4 (Zy4371_ full markers)) exposed to various exposure times (circles for 48 hours and diamonds for 14 days).
Figure 10 : Raman spectra acquired from the surface of the 3.5 µm unirradiated oxide layer –line with red full circle
markers -, the irradiated oxide layer - line with black full square markers - , the irradiated oxide layer formed on Zy4 specimen, re-oxidized 6 hours in primary water –line with light green full diamond markers -, the irradiated oxide layer formed on Zy4 specimen, re-oxidized 24 hours in primary water–line with blue half full blue square markers (cut in diagonal) - the irradiated oxide layer formed on Zy4 specimen re-oxidized 48 hours in primary water – dark green continuous line with half full dark green square markers -, the irradiated oxide layer formed on Zy4 specimen re-oxidized 14 days in primary water –line with full blue triangle markers - . Long dotted line: tetragonal phase.
41
Figure 11 : oxide thickness versus exposure time in light primary water for the unirradiated material (Zy4372_
empty markers) and the irradiated Zy4 (Zy4373_ full markers).
Figure 12 : Raman spectra acquired from the surface in the range between 680 and 780 cm-1 of a 3.5 µm unirradiated oxide layer – empty circle markers -, the irradiated oxide layer - black full circle markers - , an irradiated oxide layer formed on the specimen re-oxidized 5 days in light primary water – light blue full square markers -, the irradiated oxide layer formed on the specimen re-oxidized 14 days in light primary water – red full diamonds markers (cut in diagonal) - , an irradiated oxide layer formed on the specimen re-oxidized 28 days in light primary water –orange full triangle markers.
Figure 13 : relative intensity versus oxide depth for the irradiated Zy4 re-oxidized 6 hours (Zy4371_ full square
markers) and 28 days in primary water (Zy4373_ full circle markers).
Figure 14 : annealing law of irradiation defects (black continuous line) and relative intensity of the 710 cm-1 Raman
band (compared with the maximum intensity obtained just after irradiation) versus exposure time after irradiation for the SIMS study (full circles) and weight gain study (empty circles).
Figure 15: Oxidation Kinetics of irradiated Zircaloy-4 specimen (Zy4-372_ full square) compared to the kinetics law
![Figure 1: oxidation kinetics of Zircaloy-4 specimen (Zy4-370, Zy4-371, Zy4-372, Zy4-373) compared to previous study (red circles) and usual cubic law (dotted line) from references [20, 7]](https://thumb-eu.123doks.com/thumbv2/123doknet/13592043.423106/7.918.263.666.707.1000/figure-oxidation-kinetics-zircaloy-specimen-compared-previous-references.webp)