HAL Id: halshs-00998308
https://halshs.archives-ouvertes.fr/halshs-00998308
Submitted on 11 Dec 2015HAL is a multi-disciplinary open access archive for the deposit and dissemination of sci-entific research documents, whether they are pub-lished or not. The documents may come from teaching and research institutions in France or abroad, or from public or private research centers.
L’archive ouverte pluridisciplinaire HAL, est destinée au dépôt et à la diffusion de documents scientifiques de niveau recherche, publiés ou non, émanant des établissements d’enseignement et de recherche français ou étrangers, des laboratoires publics ou privés.
Education: E-learning and Public Subside
Adel Ben Youssef, Thomas Le Texier, Ludovic Ragni
To cite this version:
Adel Ben Youssef, Thomas Le Texier, Ludovic Ragni. Bridging the Learning Gap in the Market for Higher Education: E-learning and Public Subside. Economic Analysis (Belgrade), 2011, 3-4 (45), pp.1-11. �halshs-00998308�
Bridging the Learning Gap in the Market for Higher Education:
E‐learning and Public Subsidies
Ben Youssef Adel*, Letexier Thomas, Ragni Ludovic, University of Nice SophiaAntipolis, France UDC: 37.014 JEL:I20; I28; L13; L35Premošćavanje jaza učenja na tržištu visokog obrazovanja:
E‐learning i državna subvencija
ABSTRACT – This article aims at analyzing the adoption patterns which apply on the market forhigher education when two types of learning organizations – namely, traditional learning and e‐ learning organizations – provide educational programs. We focus on the impact of public subsidies to e‐learning providers in order to evaluate the conditions under which the learning gap is bridged. A welfare analysis is introduced to estimate the relevance of such ‘pro e‐learning’ public policies. Our first results show that public subsidies enable the e‐learning organization to provide quality‐based and pricing strategies that tend to be similar to those of the brick’n mortar organization. Besides, we find that such short‐term policies positively impact on the global level of quality which is provided by both providers. Nevertheless, our welfare analysis underlines contrasted results about the relevance of such short‐term public policies. KEY WORDS: adoption patterns, costs, e‐learning, public subsidies, quality, welfare Introduction
Information and communication technologies have deeply changed the scope and the nature of the market for higher education (Bates, 2005). Indeed, virtual campuses and e‐ learning programs have emerged as relevant alternatives to traditional ‘brick’n mortar’ learning organizations, thus providing somehow distant learning features. Following the developing of such new types of learning providers, it has been suggested that it is possible to consider a market for higher education learning services in which academic institutions and virtual campuses are key actors (Allen and Shen, 1999; Belfield and Levin, 2002; Brasington, 2003; Sosin et al., 2004). The advent of virtual campuses and e‐learning programs leads to two major changes in the market for higher education. A first significant change affects the scope, the boundaries and the nature of competition in such a market. A second major change is related to the provision of quality for programs in this market inasmuch as e‐learning programs tend to stimulate the developing of new – ICT‐related – uses.
The quality of the learning services each channel is likely to provide represents one key issue following the appearing of new competition dynamics on the market for higher
education. ICTs have been shown to enable teachers and learning staff to develop pedagogical innovations (Becker and Watts, 2001; Rivkin et al., 2005; Cukusic et al., 2010). Friedman (1962), Hoxby (1994; 2000), West (1997), Dee (1998) and Jaag (2006) find that educational mobility leads learning organizations to provide higher‐leveled quality for their programs whereas lesser optimistic results are obtained by Epple and Romano (1998), Hoyt and Lee (1998), Jepsen (2002) and McMillan (2004). Although the impact of the competition effect on learning quality remains unclear, such contributions have opened alternative paths to study the delivering of educational services. The European Union has taken various initiatives so as to promote e‐learning programs and to overcome the so‐called ‘learning gaps’. Some countries of its Members States (i.e., France and Spain) have hugely subsidized these programs. Although the impact of government subsidy on performance and social outcomes in the traditional market for higher education has largely been explored by scholars (Schneider, 2010; Yamauchi, 2011), the whole impact of such policies remains unclear in the case of e‐learning and deeper analyses have to be carried out.
The aim of this article is to analyze the impact of public subsidies to e‐learning providers in order to evaluate the conditions under which the learning gap is bridged. A welfare analysis is introduced to estimate the relevance of such ‘pro e‐learning’ public policies in a framework in which traditional learning and e‐learning organizations compete by providing educational programs. Our first results show that public subsidies enable the e‐learning organization to provide quality‐based and pricing strategies that tend to be similar to those of the brick’n mortar organization. Besides, we find that such short‐term policies positively impact on the global level of quality which is provided by both providers. Nevertheless, our welfare analysis underlines contrasted results about the relevance of such short‐term public policies.
The paper is organized as follows. Section two presents the settings of the model (2). Section three identifies optimal quality‐based and pricing strategies when the market for higher education partially and shared (3). Section four analyzes the impact of public subsidies on both competition outcomes and welfare (4). Section five concludes (5).
The model
We present a market in which two commercial organizations act as duopolists when providing learning services. We introduce two types of learning providers, namely brick’n mortar campuses and virtual campuses. These traditional organizations are more likely to provide mass‐oriented services whereas virtual ones rather provide customized services to better match the needs of the students. They also differ in the nature of the constraints students have to face when adopting one of the two services. We develop a model in a ‘à la’ Hotelling framework in which providers sell differentiated services, the traditional campus (resp. the virtual campus) being located at 0 (resp. 1). Adopters are uniformly distributed on the Hotelling line and their total mass N is equal to 1. They adopt at most one learning service that is provided by either the traditional campus or the virtual campus. Be x the location of each product on the line (x∈
[ ]
0;1 ). Utility functions are defined as follows:
(
)
1 1
2 2
if adopts from the traditional campus 1 if adopts from the virtual campus 0 if does not adopt
x r q tx p U r q t x p + − − ⎧ ⎪ =⎨ + − − − ⎪ ⎩
( )
1r (r>0) is the gross utility adopters derive from learning services. tx (resp. t
(
1−x)
) is the transportation disutility adopters get from adopting the learning program provided by the traditional campus (resp. the virtual campus). Transportation cost t captures the nature of the constraints which lead students to adopt at most one of the two educational services. Such constraints are related to both technical features (e.g., equipments) and abilities (e.g., competences) to use one of the two types of service. x (resp.(
1 x−)
) represents the distance between any adopter’s ideal product and that provided by the traditional campus (resp. the virtual campus). p1(p1>0) is the price the brick’n mortar provider charges to studentswhen adopting learning programs and p2(p2 >0) represents the price students have to pay
to adopt e‐learning programs. q1 (q1>0) (resp. q2, q2 >0) is the level of quality that is
provided by the traditional provider (resp. the virtual provider). We here interpret learning qualities as the efforts carried out by the organizations to hire high‐leveled learning staff and to contribute to the provision of high‐leveled diploma. We suppose that the content of learning programs provided by the two types of learning organizations is the same. Product differentiation can only be measured by the way educational services are released.
Both learning providers are driven by pure for‐profit motives to develop learning programs. We define their objective functions as follows:
(
)
(
)
2 1 1 1 1 1 2 2 2 2 2 2 2 2 2 n p F q n p n f qπ
π
⎧ = − − ⎪ ⎨ = − − ⎪⎩( )
2 1π
(resp.π
2) is the profit function of the traditional learning provider (resp. the virtuallearning provider) when supplying her programs. We define n1 (n1∈
] [
0;1 ) as the mass ofthe students who adopt the programs provided by the brick’n mortar campus whereas n2
(n2∈
] [
0;1 ) represents the mass of the students who adopt e‐learning services. Bothorganizations face costs whose cost structures are not the same. The traditional learning provider has to support fixed costs F1 to carry out the provision of learning services
inasmuch as the setting out of brick’n mortar activities requires buildings to be allocated and both teaching and administrative staffs to be paid. Nevertheless, the mass of the students who adopt traditional learning services is not likely to strongly affect the levels of costs of the learning supplier since her activity is based on a mass‐consumption scheme. For simplification purposes, we set the level of marginal costs to zero. The provider of e‐learning programs has to face marginal costs when carrying out her activity inasmuch as it is based on a customization‐based approach. Indeed, since each student is likely to be individually provided a specific learning program and teachers are likely to be more involved in participating to personal trainings, marginal costs f2 have to be taking into account when
providing learning services. We however suggest that fixed costs are much lower‐leveled in the case of commercial e‐learning activities. Again, for simplification purposes, we set the
level of fixed costs to zero. As generally assumed, we eventually suppose that both producers face innovation production costs whose shapes are quadratic. Such costs lead both learning providers to design suitable pricing and quality strategies to maximize their profits.
We define the adoption decision process as a four‐step game:
• at step t=0, both the traditional organization and the virtual organization decide whether to provide or not to provide learning programs;
• at step t=1, both organizations simultaneously set qualities q1 and q2;
• at step t=2, both organizations set prices p1 and p2;
• at step t=3, students decide to adopt or not to adopt the product released by either the brick’n mortar organization or the virtual campus.
Providers and potential adopters have full and common knowledge of the production outcomes, whether they concern prices and qualities. We suppose that their expectations about the way prices and qualities are defined do apply.
We consider the specific case in which the market is partially served and shared. Indeed, the gross utility adopters derive from getting access to learning services (i.e., r) is low so that access to learning services is limited. Therefore, we here focus on the case in which both the cultural and political landscapes of the countries are likely to generate learning gaps. Optimal strategies and competition outcomes Potential adopters have a low intrinsic valuation for learning services and/or constraints to access educational services that are high so that no‐adoption patterns are introduced. The two learning providers consequently act as ‘local’ monopolists. Figure 1. Adoption patterns when the market is partially served Our analysis holds for specific values for t and f2. Assumption 1a. Transportation costs
t
are large so that t>1. Mobility is limited so that there exist adoption constraints which do not allow potential adopters to easily switch from one learning provider to the other one. Assumption 1b. Marginal costs f2 are lower‐bounded so that f2<t.Assumption 1b is introduced to restrict our analysis to a framework in which marginal costs are low‐leveled enough so that the e‐learning provider may generate a positive profit from her commercial activity.
In addition, we restrict our analysis to ‘reasonable’ values of r, namely r.1 Assumption 2. The intrinsic valuation for learning services
r
is defined so that(
)
2 2 0< f < <r 2 1t− + f 2. Assumption 2 presents the conditions for values of r we have to consider for the market for higher education to be partially‐served. Let us stress that assumption 2 can be extended and expressed so that 0< f2 < <r(
2 1t− + f2)
2 2 1 2 1< t− < t− + f2. Solving backward, we identify optimal levels for quality, prices and adoption patterns: * 1 * 2 2 2 1 2 1 r q t r f q t ⎧ = ⎪⎪ − ⎨ − ⎪ = ⎪ − ⎩ * 1 * 2 2 2 1 ( 1) 2 1 tr p t tr f t p t ⎧ = ⎪⎪ − ⎨ + − ⎪ = ⎪ − ⎩ * 1 * 2 2 2 1 2 1 r n t r f n t ⎧ = ⎪⎪ − ⎨ − ⎪ = ⎪ − ⎩( )
3a ,( )
3b and( )
3c Marginal costs f2 only affect the optimal level for quality, price and adoption of the e‐learning provider. This results from the partially‐served nature of the market. One can easily see from assumptions 1a, 1b and 2 that levels for p1*, * 2 p , q1*, * 2 q , n1* and * 2 n are all positive. Proposition 1. Both learning providers reach out positive profits and partially serve the market when potential adopters have a ‘low’ intrinsic valuation for learning services.
Proof of proposition 1. One can easily observe from assumption 1a that the traditional
learning provider generates a positive profit from her activity provided that fixed costs F1
are sufficiently small. It is straightforward to show that the profit of the e‐learning provider is positive at the optimal state for any value of f2 (0< f2<t).
Traditional learning and e‐learning activities are thus both found to be sustainable inasmuch as their respective optimal levels of profit are always shown to be positive. Proposition 2. When the market for higher education is partially served, the traditional learning organization sets out higher (resp. lower) quality (resp. price) levels for their learning programs than the ones which are provided by the e‐learning organization. Proof of proposition 2. From assumptions 1a and 1b, one can easily find that
(
) (
)
* * 1 2 2 1 2 2 0 p − p = f ⎡⎣ −t t− ⎤⎦< and q1*−q2*= f2(
2 1t− >)
0.The traditional learning provider appears more likely to attract a higher scope of potential adopters. Nevertheless, let us remind that no‐adoption patterns apply due to the structure of the market for higher education.
Learning divides’ and public policies
No‐adoption patterns are represented by the optimal mass of non‐adopters, which is n∅* = −1 (n1*+n2*)=
[
2(t r− +) f2−1] (
2 1t−)
( )
4
1 If r is shown to be ‘too’ low, global no‐adoption patterns are likely to apply on the market for
We obviously find that n∅* is positive for any value of t, f2 and r under assumptions 1a,
1b and 2. Moreover, n∅* =n∅*
(
f r2,)
is unsurprisingly found to be an increasing function for 2 f and a decreasing function for r. Consequently, one may see appropriate to set up public policies which tend to make levels for marginal costs f2 lower and levels for valuation for educational programs r higher. Although such policies are both shown to reduce the gap for learning access, they differ in the amount of time which is needed for positive outcomes to be reached out. The setting up of information campaigns which are led to develop the intrinsic valuation for educational programs are somehow likely to be efficient in the long run. We therefore restrict our public analysis to the example of public subsidies to the e‐learning provider (e.g., public support to purchase IT terminals or computers). The total amount allocated by the public authorities thus depends on the number of adopters of e‐learning services. Marginal public subsidy is noted s (s>0) and is defined so that(
f2 s)
s 0∂ − ∂ <
( )
5s refers to the amount which is allocated by public players to the virtual campus to enhance the providing of e‐learning programs and to reduce the so‐called ‘learning divides’. The impact of such a type of public policies can be measured by analyzing the effect that marginal costs f2 have on optimal price and quality levels, as well as on profits. The level of
marginal subsidy s is of course assumed to be lower to that of marginal cost f2 (i.e., s≤ f2).
We first analyze the effect of public subsidies on the optimal levels we previously pointed out (4.1.). A welfare study is then carried out to see to what extent public subsidies may be socially‐improving (4.2). Public subsidies and competition outcomes We define Q*=q1*+q*2 as the quality effort which is jointly provided by the two learning organizations. As we have supposed that educational programs are homogeneous products, one can interpret Q* as a – yet preliminary – measure of social outcome. We show that
(
) (
)
* 2 2 2 1 Q = r− f t−( )
6The effect of public subsidies on the optimal quality and pricing strategies of both learning providers, as well as that on their profits, are expressed as follows: * 1 2 * 2 2 0 1 0 2 1 q f q f t ⎧∂ = ⎪ ∂ ⎪ ⎨ ∂ ⎪ = − < ⎪ ∂ − ⎩ * 1 2 * 2 2 0 1 0 2 1 p f p t f t ⎧∂ = ⎪ ∂ ⎪ ⎨ ∂ − ⎪ = > ⎪ ∂ − ⎩ * 1 2 * 2 2 2 0 0 2 1 f r f f t
π
π
⎧∂ = ⎪ ∂ ⎪ ⎨ ∂ − ⎪ = − < ⎪ ∂ − ⎩( )
7a ,( )
7b and( )
7cLemma 1. When potential adopters have a low intrinsic valuation for learning services, public
subsidies have a positive (resp. negative) impact on the quality (resp. pricing) strategy of the e‐ learning provider whereas they have no effect on that of the brick’n mortar learning provider. Public subsidies enable the e‐learning provider to increase her profits whereas such subsidies do not affect that of the traditional organization.
The effect of public subsidies on the global quality effort is given by * 2 1 0 2 1 Q f t ∂ = − < ∂ −
( )
8 Lemma 2. Public subsidies improve the level of global quality effort.Lemma 2 provides first social insights about the providing of public subsidies. It somehow stresses that the providing of marginal subsidies does negatively impact on the joint level of quality delivered by both types of learning organizations. As such, exclusive public support to the e‐learning provider is likely to lead both providers to offer higher‐ leveled services.
Public subsidies and welfare
We discuss welfare outcomes to identify the impact of public subsidies on welfare. Aggregate adopters surplus is equal to AS*=AS1*+AS*2. The surpluses of both learning
organizations are equal to the sum of the profit of the brick’n mortar provider
π
1* and that ofthe e‐learning provider
π
2*. Welfare is defined by the sum of both adopters and providers’surpluses, as well as of the level of total public subsidy (i.e., public deficit) S=S n
( )
*2 = ×s n*2.Indeed, we here consider that public authorities take rational decisions when designing public policies inasmuch as subsidies are allocated if and only if two conditions are met. These conditions state that (i) the impact of public subsidies on both the producers’ and consumers’ surpluses is shown to be positive, and (ii) public deficit S is overcome by the increase of the level of total surplus which results from the setting up of such a public policy. When public subsidies are provided to the e‐learning organization, its marginal cost decreases to a level that is equal to f2−s. We define the optimal level of welfare * W as
(
)
(
(
)
)
( )
* 1 * 2 1 * * * * * * * * 1 1 2 2 1 2 2 0 d 1 d 1 x x x x W r q tx p x r q t x p xπ
π
s x = = =∫
+ − − +∫
+ − − − + + − − We find that(
)
(
(
)
)
( )
(
)
2 2 2 2 * 1 2 1 1 3 1 2 2 1 2 1 r f s W F t r r f s s t t − − ⎡ ⎤ ⎛ ⎞ ⎡ ⎤ = − + ⎜ ⎟ − ⎣ + − − ⎦− ⎢ ⎥ − − ⎝ ⎠ ⎣ ⎦( )
9One can find that levels for welfare are positive, provided that fixed costs F1 are
sufficiently small (see proof in appendix A). The impact of public subsidies on welfare is expressed as follows:
(
)( ) ( )(
)
2 * 2 1 1 2 1 W r f t s t s t ∂ =⎛ ⎞ ⎡ − + − ⎤ ⎜ ⎟ ⎣ ⎦ ∂ ⎝ − ⎠( )
10 Proposition 3. When the market is partially‐served, public subsidies are beneficial to welfare for ‘low’ values for marginal public subsidy s, and detrimental otherwise.
Proof of proposition 3. We find that ∂W* ∂ >s 0for values for s that are set out by public authorities so that s<
(
t t−1)(
r− f2)
and that* 0
W s
∂ ∂ < for values for s that are defined so that s>
(
t t−1)(
r− f2)
.We find that public subsidies may be relevant to reach out welfare‐improving states provided that the level of marginal subsidy does not exceed a maximal value. Upper‐ bounded public support is likely to be welfare‐improving for areas in which access to learning programs is limited.
The optimal decision‐making of public authorities can be seen as the result of a welfare‐ maximizing program of which s*=
(
t t−1)(
r− f2)
is the result.2 Let us note that such anoptimal level for s is higher (resp. lower) than marginal cost f2 if f2>
(
t t2 1−)
r (resp.(
)
2 2 1
f < t t− r). When public authorities define levels for public subsidies so that 0≤ ≤s f2, *
s is set out at a level which is equal to
(
t t−1)(
r− f2)
if values for f2 and r are so that(
)
(
)
2 2 1
f ≥ t t− r, and s*= f2 if values for f2 and r are so that f2 ≤
(
t(
2 1t−)
)
r.It is needed to see if the setting out of public subsidies whose marginal amount is
(
)(
)
* 2 1 s = t t− r− f or s*= f2 eventually leads to the disappearing of ‘learning divides’ or if they only attenuate them. Proposition 4. Although public subsidies eventually foster the adoption of educational services, they may not lead to the disappearing of the ‘learning gap’. Proof of proposition 4. See appendix B.Proposition 4 suggests that short‐term oriented public policies may not be sufficient for ‘learning divides’ to disappear. Indeed, one can see that a – yet narrower – ‘learning gap’ may apply, depending on the values of both r and f2. Short‐termed public support to e‐
learning organizations cannot thus be seen as a great ‘equalizer’ which would lead to the developing of universal access to educational services.
Conclusion
The aim of this article has been to analyze to what extent the setting out of public subsiding may affect the bridging of ‘learning divides’ while stimulating the providing of high levels of quality for educational programs. Following the increasing popularity of e‐ learning services, we have built a model in which a traditional learning organization competes with a virtual one while having to deal with differing cost structures so as to measure the relevancy of ‘pro’ e‐learning support policies from a social point of view. One of our major research directions has been to identify how public policies should be designed to eventually facilitating access to learning services while not levelling down overall educational quality.
2 As ∂2W* ∂ =s2
(
1 2t−1) (
2 1−t)
<0, the value s for s which is defined so that * ∂W* ∂ =s 0 depicts a
The impact of public subsidies has been analyzed, notably to measure to what extent they are likely to reduce the ‘learning divides’ one may observe in areas in which intrinsic valuation for educational services is low. Our welfare analysis has evidenced that the providing of public subsidies that level is too high is detrimental from a social viewpoint. It has also revealed that – under some specific circumstances – public subsidies may not be efficient enough to fully‐cover the ‘learning gap’. This last result can lead to several interpretations. A somehow pessimistic interpretation is that it may not be possible to provide universal access to educational services through the designing of short‐termed public policies. Although the setting out of public policies is found to ‘equalize’ the competitive game between the two types of learning organizations from both a pricing and quality‐based point of view, detrimental effects to welfare levels may appear. We suggest that the mixing of short‐term (e.g., public subsidies) and long‐term (e.g., educational campaigns) public policies may be appropriate to lead to the disappearing of ‘learning divides’. Yet, such a practice is likely to generate coordination failures and seems to provide efficient results only when political contexts are found to be stable. Nevertheless, we would like to address another – rather optimistic – interpretation. Indeed, our findings pinpoint that it may be possible for public authorities to widen access to educational services while preserving their ‘cultural’ learning‐provision model. Put it differently, they may allow a larger scope of people to get access to educational services while avoiding the emerging of a mass‐consumption model for such higher services.
The analysis of adoption patterns for educational services raises major concerns from both market‐based and public viewpoints. We strongly believe that both empirical and model‐based further contributions will lead to the better understanding of adoption dynamics within the market for higher education and to the shaping of suitable public policies. Appendixes Appendix A. Positive welfare levels The level of welfare that applies when the market for higher education is partially served is given by
(
)
(
)
2 2 * 2 1 2 2 2 2 1 1 2 1 2 ( )( ) ( ( ) ) 2 2 1 W F t r r f f s f s t r r f s t ⎡ ⎤ ⎡ ⎡ ⎤⎤ = − + ⎢ ⎥ ⎣ − ⎣⎡ − + − + ⎤⎦+⎣ + − + ⎦⎦ − ⎣ ⎦ From assumptions 1a and 2, it is straightforward to find that W*>0 for sufficiently small values of F1. Appendix B. Proof of Proposition 2 As we previously pointed out, two cases have to be taken into account: (i)(
)
(
*)
2; 2 2 1 s = f f ≤ tr t− and (ii)(
s*=(
t t−1)(
r− f2)
;f2≥(
tr t2 1−)
)
.Let us first focus on the
(
s
*=
f f
2;
2≤
(
tr t
2 1
−
)
)
case. We show that** 0
n∅ > if the
( )(
)
(
)
( )
2 2 2 2 1 2 2 1 2 1 0 1 2 (2 1 ) 2 1 2 1 r t f tr t f r t f t t f < − ⎧ ⎪ ≤ − ⎨ ⎪ < < < − + < − < − + ⎩ Such conditions can be summarized as follows:(
)
(
)
( )(
) ( )
2 2 2 2 0< f < 2 1t− f t r< < 1 2 2 1t− < 1 2 (2 1t− + f ) 2 1 2 1< − < − +t t f In a similar fashion, we show that n∅**<0 if the following conditions are simultaneously met:( )(
)
(
)
( )
2 2 2 2 1 2 2 1 2 1 0 1 2 (2 1 ) 2 1 2 1 r t f tr t f r t f t t f > − ⎧ ⎪ ≤ − ⎨ ⎪ < < < − + < − < − + ⎩ Such conditions can be summarized as follows:( )(
)
{
2}
( )
2 2 0 max 1 2 2 1 ;< t− f < <r 1 2 (2 1t− + f ) 2 1 2 1< − < − +t t fWe thus identify possible conditions under which public subsidies are found to fully bridge the ‘learning gap’ and other conditions under which such policies are not found to be efficient enough to fully cover this gap.
Similar results are found when the
(
s*=(
t t−1)(
r− f2)
;f2≥(
tr t2 1−)
)
case is dealt.References
Allen, R.F., & Shen, J. (1999). Some new evidence of the character of competition among higher education institutions. Economics of Education Review, 18 (4), 465‐470.
Bates, T (2005), Technology, E‐learning and Distance Education. New York, Routledge.
Becker, W.E. & Watts, M. (2001). Teaching methods in U.S. undergraduate economics courses. Journal
of Economic Education, 32 (3), 269‐279.
Belfield, C., & Levin, H.M. (2002). The effects of competition on educational outcomes. Review of
Educational Research, 72 (2), 279‐341. Brasington, D.M. (2003). The supply of public school quality. Economics of Education Review, 22 (4), 367‐ 377. Cukusic, M., Alfirevic, N., Granic, A. & Garaca, Z. (2010). E‐learning process management and the e‐ learning performance: Results of a European empirical study. Computers & Education, 55 (2), 554‐ 565. Dee, T.S. (1998). Competition and the quality of public schools. Economics of Education Review, 17 (4), 419‐427. Epple, D. & Romano, R.E. (1998). Competition between private and public schools, vouchers, and peer group effects. American Economic Review, 88 (1), 33‐62. Friedman, M. (1962). Capitalism and Freedom. Chicago, University of Chicago Press.
Hoxby, C.M. (1994). Do private schools provide competition from public schools? NBER working paper no. 4978, Cambridge, MA.
Hoxby, C.M. (2000). Does competition among public schools benefit students and taxpayers? American
Economic Review, 90 (5), 1209‐1238.
Hoyt, W.H. & Lee, K. (1998). Educational vouchers, welfare effects, and voting. Journal of Public
Economics, 69 (2), 211‐228.
Jaag, C., (2006). School competition. MPRA working paper no. 339, Munich, Germany.
Jepsen, C. (2002). The role of aggregation in estimating the effects of private school competition on student achievement. Journal of Urban Economics, 52 (3), 477‐500.
McMillan, R. (2004). Competition, incentives, and public school productivity. Journal of Public
Economics, 88 (9‐10), 1871‐1892.
Rivkin, S.G., Hanushek, E.A. & Kain, J.F. (2005). Teachers, schools and academic achievement.
Econometrica, 73 (2), 417‐458.
Schneider, A. (2010). Redistributive taxation vs. education subsidies: Fotsreing equality and social mobility in an intergenerational model. Economics of Education Review, 29 (4), 597‐605.
Sosin, K., Blecha, B.J., Agawal, R., Bartlett, R.L. & Daniel, J.I. (2004). Efficiency in the use of technology in economic education: Some preliminary results. American Economic Review, 94 (2), 253‐258. West, E.G. (1997). Education vouchers in principle and practice: A survey. World Bank Research
Observer, 12 (1), 83‐103.
Yamauchi, F. (2011). School quality, clustering and government subsidy in post‐apartheid South Africa. Economics of Education Review, 30 (1), 146‐156.
APSTRAKT – Ovaj članak ima za cilj da analizira usvajanje modela koji se primenjuju na tržištu
visokog obrazovanja posmatrajući dva tipa edukativnih organizacija ‐ one koje pružaju klasične edukativne programe i one koji pružaju e‐learning obrazovne programe. Posebno je posmatran uticaj državnih subvencija na e‐learning organizacije u cilju procene uslova pod kojima premošćuje jaz učenja. Predstavljena je analiza blagostanja u cilju procene relevantnosti ovakvih državnih politika koje favorizuju e‐learning. Naši prvi rezultati pokazuju da državne subvencije omogućavaju e‐ learning organizacijama da primenjuju cenovne, i strategije bazirane na kvalitetu koje teže da budu slične onima kod brick’n mortar organizacija. Pored toga, utvrdili smo da kratkoročne politike pozitivno utiču na nivo ukupnog kvaliteta koji pružaju oba tipa organizacija. Ipak, naša analiza blagostanja ističe različitost rezultata u vezi sa relevantnošću ovakvih kratkoročnih državnih politika. Article history: Received: 5 November 2011 Accepted: 14 December 2011
APSTRAKT ‐ U centru pažnje Plana oporavka EU za period 2010.‐2014. su, takozvane,
ʺpametne investicijeʺ, koje treba dugoročno da obezbede veći rast i održivi razvoj. ʺPametna investicijaʺ znači ulaganja u istraživanje i razvoj (R&D), kao i ulaganja u obrazovanje iz javnih i privatnih izvora finansiranja. U cilju podsticanja investicija u aktivnosti istraživanja i razvoja od strane privatnog sektora, preporučuje se korišćenje javno‐privatnog inovativnog partnerstva (direktan način), kao i šire upotrebe poreskih podsticaja za istraživanje i razvoj (indirektan način). Kako poreski pristup istraživanju i razvoju ima jak uticaj na donošenje odluka, ovaj rad će se baviti različitim R&D poreskim (računovodstvenim) modelima i njihovom uticaju na finansijske performanse preduzeća.
Kako je Bosna i Hercegovina prihvatila Međunarodne Računovodstvene Standarde (MRS) i Međunarodne Standarde Finansijskog Izveštavanja (MSFI) kao svoj računovodstveni okvir, ovaj rad će ispitati adekvatne MRS i MSFI u cilju identifikovanja ʺpozitivnihʺ ili ʺnegativnihʺ efekata svakog R&D poreskog modela, radi pravilnog finansijskog tretmana ovih aktivnosti u preduzećima.
Opšti cilj ovog rada je da odgovori na pitanje: koja model poreskih subvencija za istraživanje i razvoju bi bio najprikladniji za BiH, poštujući sadašnji pravni i računovodstveni okvir, kao i troškove i koristi svakog preporučenog modela?
KLJUČNE REČI – računovodstveni tretman aktivnosti R&D, računovodstvena analiza, R&D
poresko planiranje i stimulansi, obim i porast R&D baziran na subvencijama, korporacijski porez kao stimulans R&D aktivnosti. Article history: Received: 15 July 2011 Accepted: 21 September 2011
General Characteristics, Role and Importance of International
Marketing Information System
Stanetić Vedran*, Institute of Economics ad Banja Luka Bosnia and Herzegovina UDC: 339.138 JEL: M31; L22; F23Osnovne karakteristike, uloga i značaj međunarodnog
marketinga informacionih sistema
ABSTRACT – Information flow from the company to the market, and contrary also, enables
effective communication of the subject with the environment. Formalizing and directing that kind of flows emanates information systems. The task of such systems is constantly refreshing the content of the information flow. This ensures that company`s decisions, which would be undertaken, are adequate and in the right time. Information systems find their application in almost all areas of business. Maybe the most interesting of them are marketing information systems. However, such systems are often considered a substitute for marketing (market) research, or if there are undertook marketing (market) research, then there is no need for marketing information system. This paper seeks to prove the opposite, that these two concepts are not identical, and therefore not mutually exclusive but rather complementary and compatible. Since the operations of business entities are increasingly becoming regional or global, that makes sense to talk primarily about international marketing information systems. Local business levels should be regarded only as a fragment of the total portfolio of markets. The last statement is valid especially if the domicile market is not sufficiently large for profitable production or if it is under‐developed
KEY WORDS: information systems, market, marketing, information, marketing research,
international environment
Characteristics of international marketing information system Definition of international marketing information system
It is not an easy task to give a comprehensive and complete definition of international marketing information system (IMIS), which would be easily understood at the same time. Defining difficulties arise from the complexity of the aforementioned system, interwoven elements that make up the IMIS, their entanglement and complementarity with other activities in the enterprise, as well as understanding the role and importance of the IMIS. In order to understand properly the meaning of the IMIS it is recommended to start with the etymological analysis of the IMIS concept. The compound ʺinternational marketing information systemʺ will be briefly analyzed word by word ʺsystemʺ, ʺinformational,ʺ
* Address: Krfska 94, 78000 Banja Luka, Republika Srpska, BiH; e‐mail: [email protected],
ʺmarketing,ʺ while the adjective ʺinternationalʺ is in brief content analyzed through the entire text.
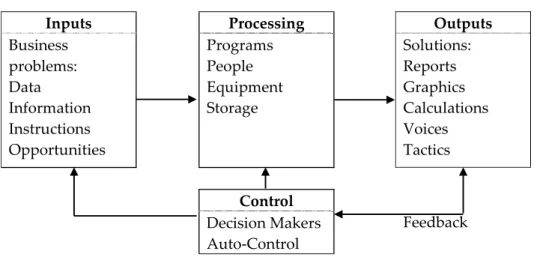
It is important to understand correctly the meaning of the word ʺsystemʺ because it is the basis for not only a IMIS, but also any other form of organization. According to Efraim Turban, Ephraim McLean, and James Wetherbe (1999, pg. 40, 41) a system is a collection of elements, such as: people, resources, concepts and procedures, intended to perform an identifiable function or serve a goal. A system is separate from its environment by a boundary. The system is inside the boundary, whereas the environment lies outside. In short, the system is determined by elements, its tasks and purpose, as well as the limits that can be very abstract. Especially interesting are the systems that collect and process various kind of information. Information system (IS) of enterprise is defined as a set of human and technical means that, with a certain organization and methodology, perform the collection, storage, processing and disseminating to the use of data and information (Lazo Roljić, 1997, pg. 23). IS can be represented graphically by the diagram as follows:
Figure 1. Schematic view of the Information System
Inputs Processing Outputs
Business problems: Data Information Instructions Opportunities Programs People Equipment Storage Solutions: Reports Graphics Calculations Voices Tactics Control Feedback Decision Makers Auto‐Control Source: Turban, McLean, and Wetherbe (1999, pg. 18)
In the previous figure is shown that the tasks of the IS are to collect and process information, which goal is to create information reports for different purposes. The information system is a system that is oriented to decision making information.
Classification of IS in companies can be done in various ways. IS can be classified taking into account four main aspects: the organizational level, functional area, provided support, system architecture, etc. However, regardless of classification, the structure of IS is the same and consists of the previously mentioned elements. For this paper, the most interesting classification of IS is based on the division of functional areas in the companies. Besides to marketing IS, there are also: accounting IS, financial IS, manufacturing IS, human recourses IS and the like. Also, for purpose of this paper it is important only formal IS, as opposed to informal whose study is more in the field of operating management, or sociology.
In order to understand properly the marketing information system, it is needed to start with the concept of the marketing system. The essence of the marketing system is the
information flow between producers and consumers. The flow of these data is twofold. Data from consumers go to the manufacturer. The content of this data include: needs, desires, preferences and problems, and it is defined as the purchasing power demand. On the other hand, information circulate from the manufacturer to the consumers and the content of this data is about its mission, goals and tasks, in other words information about marketing plan and program ‐ defined as an offer. The process of communication between company and customers is needed to ensure that market exchange would be performed without complications and to mutual satisfaction. This means that the consumers will satisfy their needs, meet their desires, solve their problems and remove the tension; and, at the same time, the company will make a profit with lasting affection by consumers. As could be seen, the marketing system is very complex, and when it is added to the information system leads to more complex systems.
To generate a continuous flow of appropriate information is an essential task of IMIS. The environment of the company is subject of constant change. These changes are particularly evident in the international environment. IMIS goal is to create an optimal database as a basis for effective marketing management. There are two basic tips to keep in mind when observing the IMIS that are continuous flow of data collection and international environment as inevitable element in a globalized business world.
The main task of IMIS is an ”intelligenceʺ. Intelligence refers to the gathering of information from decision‐making system`s environment and exploring that information in an effort to recognize the existence of problems (Gilbert A. Churchill, 1991, pg. 28). Therefore, the tasks of the IMIS are to continually survey the widest surrounding, to collect general data that is even few suspected that might be of importance for the system, further processing of these data, then thoroughly explore, and try to determine whether these data represent or suggest changes in the environment that could be a threat or an opportunity for the reference system. When it is concluded on the basis of such ʺgeneral informationʺ and using ʺinsightʺ that there are threats or chances in environment, such information is further transferred to a higher level of decision making.
When it comes to comparison between marketing information system (MIS ‐ referring to the information system oriented toward the domestic market only) and IMIS, the conclusion is the same as the comparison between domestic and international marketing research. Looking evolution through time first have came MIS. However, the issue of performance is not a matter of chronology rather than rationality. The broad framework of observation, or more statistical populations, theoretically creates a greater chance of optimal choice. The practical significance of IMIS, in a liberalized and the changing business world, is increasing. The need for a systematic approach to information collection and dissemination in the field of international marketing is conditioned by the weaknesses that are typical for most companies. According to Boris Tihi (2003, pg. 320) those weaknesses can be summarized as follows:
• There are many information, concerning various aspects of market problems, but the lack of a system that would select and direct that information force decision‐ makers to take unsystematic “information hunt” in making any specific marketing decisions;
• Above mentioned “hunting” takes place in the business environment and within an entity, and a result of unsystematic work is the fact that many valuable information are losing within the organizational structure of a subject;
• What makes situation more difficult is that a lot of information are often not formally recorded, information are kept in minds of individuals who sometimes jealously keep information for themselves believing that it could ‘’increase their authority’’ in some situations;
• Late arrived information at the decision making place are practically worthless; • Due to unsystematic data collection and use of different sources of information, it
is difficult to assess the degree of reliability, which is an essential precondition for the quality of decisions.
The only applicable way to solve the mentioned to solve the mentioned problems is a systematic approach. One of the possible systematic approaches to the problem mentioned is by IMIS. The emphasis in these systems must be on determining the precise information needs of each marketing decision makers. This ensures that they have exactly the information they need, when they need them, to make the decisions that they have to. It is not easy, but it is possible knowing what characterize quality and developed IMIS. For indicators of the quality and development of information activities Miodrag Jovićević (2001, pg. 161) takes the following:
• The time between the moment of emerging and the moment of noticing a problem;
• Sources of data and information – to be known in advance and to provide data and information of current, future and historical character;
• Quality of data and information – reliability, accuracy and authenticity;
• Procedures and programs of data and information processing – to be known and provided in advance, that we know what the relationships and the degree of abstraction of the past and the future projection;
• Knowledge – a fundamental prerequisite for solving problems and conducting informational activities.
Content of an international marketing information system
Within a IMIS comes to generating information necessary for strategic and tactical decision‐making in an international environment. For a better insight into complex structure, and for the completeness and clarity, content of IMIS will be shown as a picture. This ensures a complete overview of the elements and relationships between elements of a IMIS.
On the next figure is shown the content and structure of elements, and a connection between them in IMIS. The system consists of three essential parts: the information component, processing of collected data and the application of the IMIS. Information components are included in the IMIS in the form of internal, external and other data. Based on the data collected, it is necessary to apply the methods of sorting, processing, analysis and synthesis. The resulting information are input in the subsystemʹs tasks of IMIS. What is important to emphasize and what is not shown in the previous figure, is a feedback. Data and information regarding the purpose and quality of the IMIS application, or decisions
made on the basis of information obtained through IMIS, have to become one of the components of information or re‐entry to MISS. Figure 2. International Marketing Information System Information Components Issues in the Data Aggregation Process Applying the International Information System EXTERNAL DATA Macroenvironmental Information Data Scaning the Global Environment Comparability Infrastructure Data Allocating Resources Synthesizing and Market Size and Structure
Data Input Interpreting Data Monitoring Company
Performance INTERNAL DATA Updating and Maintaining Company Sales and Market Performance System Transfer of Ideas and Experience Source: Samule C. Craig, and Susan P. Douglas (2005, pg.423) The functioning of the international marketing information system
For successful operation of a IMIS is necessary to exist three sub‐systems shown in the second figure. In the following text will be briefly analyzed each of the subsystems and connections between them.
Information components – source of the required data is the basis of the work of any of
information system. All data sources, from the point of origin can be divided into external, internal and other sources.
External data are: macroeconomic indicators, data on infrastructure, as well as data on market size. Data about macro‐economic situation in individual countries, regions or globally, could be only the secondary. The most complete such information can be found in the database of: UN, World Bank, OECD Economic Indicators, Eurostat and the like, as well as on the websites of other institutions that monitor such indicators. Data on market infrastructure can also be geographically structured, for example: globally, regionally, nationally, and locally in the cities, depending on which the target market is. These are data about the media infrastructure, for example: electronic media, print media, outdoor advertising media (billboards, posters, etc.), and retail infrastructure, e.g.: type of organization and structure of retail organizations and wholesale legislation, the nature of competition and the like. Data about company`s products, about market size and it`s structure, as well as alternative and complementary products can be found in databases. It is
important that the product`s market would not be too narrowly defined. Therefore there is the need to collect and analyze data on complementary and substitute products.
Internal data are contained within the company itself. These data are relating to: financial indicators (for example ROA, ROE, etc.); market indicators (for example market share, sales costs, increased sales by individual product lines and the like); data about employees (example fluctuations, the emergence of new professions of interest to the company, etc.); data obtained through the marketing research studies (for example research centralized or organized for particular target markets and the like).
Other data sources can be divided into two groups: people as a source of data and observation of physical stimuli as another data source. People could create and transfer ideas, experiences and knowledge within the organization, or between world or region markets. They create and transmit information to each other. Such communication occurs in the oral and written form, staff meetings, teleconferencing and so on. Also, this communication can be separated to the internal, within the same enterprise, and external, communication with sales representatives, managers from other countries, promotion agencies, distributors and so on. A complete picture about same market could be obtained only by visiting that market, observing it and talking with customers and business partners, looking at shopping habits and the type of retail outlets, monitoring advertisements on electronic and print media, looking at weather conditions, geographical terrain, quality of transport infrastructure and the like.
Issues in the Data Aggregation Process – IMIS could not function ideally just on the
basis of data collected. There are also some technical problems, for example: quality of data collected, data entry, constantly update the content of the data collected and the like. The quality of data collected depends on the possibility to make comparisons with data collected in other countries. This problem is usually related to the existence of different data collection procedures, as well as different accounting practices between countries and regions of the world. Data are presented in units of measure that can be quantitative, qualitative and monetary indicators (e.g. goodwill). Quantitative measures generally are not a problem. However, monetary measures are subject to strong and rapid changes due to: changes in exchange rates, price fluctuation on stock exchanges or other markets, changes in fiscal policy of the observed countries, or due to changes in the ways of their calculation. Entering data procedures define the degree of similarity and type of data to be collected to be useful for the system. There have to be defined by whom and how to enter data within the enterprise, in order to make collection procedures more successful. Also, it have to be defined how to change data presentation to make them comparable. This is particularly important for data coming from external sources. Data issued by the UN or World Bank generally do not have mentioned problems because those data usually cover the entire world, and their parameters are either global or highly standardized for certain regions or countries. The problem is with a regional or national data. These problems are reflected in different ways of: collecting, sampling, systematization, generalization of data and the like, to the language of presentation. It is necessary to ensure that the system continuously collects new data and to processes them. The processed data are synthesized, in other words those processed data are the basis for drawing conclusions. New information should be
compared with previous ones and, in the case of difference, investigate the difference and inform management. The system should be constantly maintained and serviced.
Application (tasks) of IMIS – by Roche (as cited in Craig and Douglas, 2005, pg. 434),
IMIS is used in performing the following four tasks: scanning the global environment to monitor trends and pinpoint those with specific implications for the geographical areas and product markets in which the company is involved, assessing how to reallocate resources and efforts across different countries, products markets and target segments so as to achieve desired rates of growth and profitability, monitoring performance in different countries and product markets through the world, and transferring ideas and experience from different countries and areas of the world throughout the organization.
Feedback – even if it is not shown in the previous figure, the importance of feedback
should be particularly emphasized. Through the previous analysis of IMIS it is mentioned the importance of re‐entry of data into the system. The information flow in IMIS is continuous. This is a fundamental feature of the marketing information system that ensures the quality of marketing decisions (Momčilo Milisavljević, 1999, pg. 62). Based on the information collected and create through the IMIS, the company affects its environment. The environment reaction creates a new situation. New data from changed environment represents a new entrance into the system. In that way a company gets a feeling about the success of implemented decisions, and the effectiveness of an IMIS, which in turn should be constantly creating new, more favorable business conditions for the company.
The process of international marketing research in the absence of an international marketing information system
The relationship between international marketing research and IMIS has to be understood as a relationship of complementarity rather than equality or competition. Although they have the same goals and similar tasks, ways of achieving these goals and tasks are based on different grounds. This reflects theirs complementarity. International marketing research project usually occurs when a company finds the problem that often needs to be urgently solved. That leads to an emphasis on data collection and analysis rather than on the development of the formal and regular collection of information. Therefore, the main difference between the research project and the system is in time and speed of execution. The research project appears in times of crisis, so from time to time and as rarely as possible. On the other hand, the data collection process is ongoing, or the keyword in the definition of marketing information system is ʺregularʺ, since the emphasis in marketing information system is the establishment of systems that produces information needed for decision making on a recurring basis (Churchill, 1991, pg. 24). However, the project must be completed as soon as possible due to the fact that the duration of the crisis only exacerbates the situation of the entity which drives the research project. The system of data collection, since it is a continuous process, has enough time to conduct quality research and make the necessary analysis.
Another important difference relates to the scope of research. Considering that the study (project) of research is conducted in a relatively short period of time, it is very often that so called preliminary (investigative or orientation) research is neglected. According to the Tihi