HAL Id: cea-02631110
https://hal-cea.archives-ouvertes.fr/cea-02631110
Submitted on 28 May 2020
HAL is a multi-disciplinary open access
archive for the deposit and dissemination of sci-entific research documents, whether they are pub-lished or not. The documents may come from teaching and research institutions in France or abroad, or from public or private research centers.
L’archive ouverte pluridisciplinaire HAL, est destinée au dépôt et à la diffusion de documents scientifiques de niveau recherche, publiés ou non, émanant des établissements d’enseignement et de recherche français ou étrangers, des laboratoires publics ou privés.
Tracing Sediment Sources in a Subtropical Agricultural
Catchment of Southern Brazil Cultivated With
Conventional and Conservation Farming Practices
Marion Le Gall, Olivier Evrard, Arnaud Dapoigny, Tales Tiecher, Mohsin
Zafar, Jean Paolo Gomes Minella, J. Patrick Laceby, Sophie Ayrault
To cite this version:
Marion Le Gall, Olivier Evrard, Arnaud Dapoigny, Tales Tiecher, Mohsin Zafar, et al.. Tracing Sediment Sources in a Subtropical Agricultural Catchment of Southern Brazil Cultivated With Con-ventional and Conservation Farming Practices. Land Degradation and Development, Wiley, 2016, 28 (4), pp.1426-1436. �10.1002/ldr.2662�. �cea-02631110�
Tracing sediment sources in a subtropical agricultural catchment of Southern Brazil
cultivated with conventional and conservation farming practices
Marion Le Galla, Olivier Evrarda, Arnaud Dapoignya, Tales Tiecherb, Mohsin Zafarc,Jean Paolo Gomes Minellac, J. Patrick Lacebya, Sophie Ayraulta
a Laboratoire des Sciences et de l’Environnement, UMR 8212 (CEA/CNRS/UVSQ), Université Paris-Saclay,
Domaine du CNRS, Avenue de la Terrasse, 91198 Gif-sur-Yvette Cedex, France
b Universidade Federal do Rio Grande do Sul, Faculty of Agronomy, Department of Soil Science, 7712 Bento
Gonçalves Avenue, 91540-000 Porto Alegre, RS, Brazil
c Universidade Federal de Santa Maria, Department of Soils, 1000 Roraima Avenue, 97105-900 Santa Maria, RS,
Brazil
Running Title:Tracing sediment sources in an agricultural area of Southern Brazil
ABSTRACT
In Brazil, agricultural expansion has increased soil erosion and sediment supply to waterways. As elevated sediment loads often degrade freshwater environments, sediment fingerprinting techniques are increasingly used to identify the sources supplying sediment to riverine and lacustrine environments. In this study, the contribution of various soil types to sediment was investigated in the Guaporé catchment (2,032 km²) in southern Brazil. Soil samples (n=75) were collected to characterize five soil types: Ferralsols (n=26), Nitisols (n=13), Acrisols (n=8), Leptosols (n=6), and Luvisols (n=22). Sediment samples (n=7) were collected in a trap installed at the catchment outlet. Sediment source contributions were modelled according to soil types with elemental geochemistry and 87Sr/86Sr ratios. 87Sr/86Sr ratios, K, Ti, Co, As, Ba and Pb were selected as the optimal suite of properties discriminating between soil types. Sediment samples were modelled to mainly originate from downstream Acrisols (mean 41%, SD 2%), Leptosols (mean 34%, SD 4%) and Luvisols (mean 17%, SD 4%). In contrast, contributions of upstream Ferralsols (mean 4%, SD 2%) and Nitisols (mean 4%, SD 6%) were low. These results suggest that soils found in lower parts of the catchment, cultivated with conventional agriculture on steep slopes, were the main source of sediment to the river network. In contrast, soils found in upper parts of the catchment, cultivated with soybean under direct sowing, were less eroded or deposited before reaching the sediment sampling location at the outlet. These findings demonstrate that the management of local and degraded soil sources is important for reducing sediment loads.
INTRODUCTION
Soil erosion is a major process of land degradation worldwide. The detachment and subsequent transport of soil particles is accelerated by land use change and increasing anthropogenic pressure in agricultural landscapes (Sharma, et al., 2011; Zhao, et al., 2016). The negative consequences of soil erosion include declining soil fertility and crop yields (Bakker, et al., 2008). Soil loss and the transfer of fine sediment (<63 µm) to the river network may also result in the degradation of water quality by sediment-bound contaminants, and to dam and river channel siltation (Owens, et al., 2005; Yuan, et al., 2015). Therefore, information on the spatial and temporal sources of sediment and their variability is essential to implement effective management strategies that reduce sediment loads and improve our understanding of sediment and contaminant source dynamics (Masselink, et al., 2016; Vaezi, et al., 2016).
In Brazil, the rapid intensification of agriculture led to an increase in soil erosion rates and sediment yields (Manzatto, et al., 2002), resulting in soil losses that often exceeded 50 Mg ha-1 yr-1, making Brazil a worldwide hotspot of soil erosion (Casão Junior, et al., 2012). As conventional tillage dominated in the 1950s and 1960s, multiple initiatives were implemented across Brazil in the 1970s to reduce soil loss with the promotion of conservation agricultural practices such as no-till systems. However, most soils were still inadequately managed and the lack of additional runoff control measures (e.g., crop rotation, contour farming, retention ponds, and dense soil cover with crop residues) resulted in ongoing erosion issues. The Rio Grande do Sul State was particularly impacted with estimated average erosion rates of 40 Mg ha-1 yr-1 (Schmidt, 1989). Since the 1990s, concerns regarding soil loss in agricultural catchments increased in this state where direct sowing (without the implementation of additional runoff control measures) and soybean monoculture dominate (Merten, et al., 2010). However, there remains a lack of information regarding sediment sources and processes in this region in particular, and medium to large scale Brazilian agricultural catchments in general.
Sediment source fingerprinting techniques provide a direct approach to identify and quantify sources supplying sediment to river systems. This method involves the measurement of physical and/or chemical parameters in both potential sources and sediment (Ben Slimane, et al., 2016; Martínez-Carreras, et al., 2010; Walling, et al., 2002; Zhang, et al., 2016). Often, sediment fingerprinting studies rely on the discrimination of potential sediment sources according to land use (e.g., cropland, channel bank, road, pasture, damaged roads) (Collins, et al., 2012; Sherriff, et al., 2015) or catchment geology (Evrard, et al., 2011; Hughes, et al., 2009; Laceby, et al., 2015). Recently, a geochemical fingerprinting approach was used to apportion sediment sources based on catchment soil types (Lepage, et al., 2016). Weathering and erosion result in the formation of soils with geochemical properties related to their bedrock source. As sediment predominantly originates from soils, lithological/soil fingerprinting approaches could logically provide further sediment source information, particularly when related to agricultural practices in different regions.
Strontium isotopic ratios (87Sr/86Sr) vary depending on bedrock composition and age (Albarède, 1995) and they are not fractionated by natural processes (Bullen & Kendall, 1998). 87Sr/86Sr ratios measured in suspended sediment are representative of 87Sr/86Sr ratios of their eroded parent material and have been used to identify suspended sediment sources in riverine, estuarine and marine environments (Asahara, et al., 2006; Douglas, et al., 1995; Wasson, et al., 2002). Accordingly, 87Sr/86Sr ratios have a strong potential for continental fingerprinting studies and could provide complementary sediment source information to elemental concentrations and improve sediment source identification based on soil type.
Sediment source fingerprinting research in Brazilian catchments has mainly focused on hydrological and erosion processes and on the estimation of erosion rates (Merten, et al., 2015; Merten & Minella, 2013; Minella, et al., 2014). Most of these fingerprinting studies were implemented in the Rio Grande do Sul State, identifying sediment sources according to land use with geochemical measurements. Results estimated contributions ranging between 57 and 64% for croplands, 23 and 36% for unpaved roads and 20 to 36% for channel banks (Minella, et al., 2004; Tiecher, et al., 2015a; Tiecher, et al., 2015b).
In this current study, sediment sources are investigated in the agricultural Guaporé catchment (Rio Grande do Sul, Brazil) where croplands were modelled to dominate the sediment supply (88 ± 19%) (Tiecher, 2015). Contrasting farming practices (e.g., conventional tillage and no-till systems) were implemented in this catchment since the 1960s and it is important to understand the contribution from soils under these different practices to sediment degrading local river networks. Accordingly, the optimum set of fingerprinting parameters that best discriminate between the soil types was incorporated into a distribution modelling approach to quantify the relative contributions of the soil sources to sediment sampled at the outlet of the Guaporé catchment. Variations in sediment source contributions are discussed in relation to agricultural practices to highlight management implications.
MATERIAL AND METHODS
Study siteThe Guaporé catchment (2,032 km²) is located in the northeastern region of the Rio Grande do Sul State, in southern Brazil (Figure 1a). The catchment has a subtropical climate with annual rainfall ranging between 1,400 and 2,000 mm (Didoné, et al., 2014). The geology is characterized by lava flows from the
Serra Geral formation with basalts locally overlaid by rhyodacites (Riccomini, et al., 2016). This parent
material is impermeable across the entire catchment. Upper parts of the catchment are characterized by gentle slopes and deep soils (4 m depth), corresponding to the edge of the Meridional Plateau of the Serra
Geral, whereas the lower parts of the catchment are characterized by steep slopes (> 60%) and shallow
soils (<1 m) that are well connected to the river network. Five soil types are identified in this catchment: Ferralsols (31%) and Nitisols (21%) located in upper part of the catchment and Luvisols (24%), Acrisols (17%) and Leptosols (7%) in the lower part of the catchment.
Ferralsols and Nitisols are deeply weathered, well drained (Gardi, et al., 2015; Quesada, et al., 2011) and characterized by the dominance of vertical hydrological flows. Their physical properties (i.e., high clay and iron/aluminum oxide contents, aggregation, and stable microstructure) further decrease their sensitivity to soil erosion compared to most of the weathered subtropical soils. In contrast, Acrisols and Leptosols are shallow soils mostly found in forested and steep areas, with a lower potential for agriculture (Bockheim, 2015; Fernández-Getino & Duarte, 2015; Towett, et al., 2015). Acrisols, characterised by a low fertility and high concentrations in aluminum, show an increase in clay content in the subsurface horizon compared to the upper sandy horizon. This subsurface clay layer reduces water infiltration resulting in the formation of lateral subsurface flows. When cultivated, these soils have to be protected by a dense vegetation cover to prevent soil erosion (Gardi, et al., 2015; World Reference Base for Soil Resources, 2006). Highly degraded by soil erosion, Leptosols are shallow and stony, and mainly dedicated to forestry and pasture (Fink & Pedro, 2015). These soils may be rapidly saturated with water, generating runoff. Luvisols are the only fertile soils suitable for a wide range of agricultural uses in lower parts of the Guaporé catchment (Quesada, et al., 2011).
Land use in the Guaporé catchment is a heterogeneous mixture of forests (58%), croplands (31%) and pastures (10%) (Figure 1b). Native forests are mainly composed of Araucaria angustifolia although a total of 81 tree and shrub species are found in the region. Soybean (Glycine max), maize (Zea mays) and wheat (Triticum) under direct sowing are predominantly cultivated in the upper area of the catchment. In lower parts of the catchment, tobacco (Nicotina tabacum) and maize (Zea mays) are cultivated with conventional plowing, although forests and pastures dominate this area. Native grasslands are composed of perennial grass species (Cynodon spp) and annual pastures are mainly composed of black oats (Avena strigosa Schreb.) and Italian ryegrass (Lolium multiflorum Lam.).
Sampling
Source samples were collected in 2012. Before sampling, sediment mobilization and transport were observed during storm events and soil sampling was restricted to areas sensitive to erosion and potentially connected to the river network. In total, the source samples covered the range of different soil types identified in the catchment: Ferralsols (n=26), Luvisols (n=22), Nitosols (n=13), Acrisols (n=8) and Leptosols (n=6). Samples (n=75) were collected by scraping the top 2-3 cm layer of soil and by scraping a 2-3 cm layer of the sidewall from eroding channel banks. Each sample was composed of ten sub-samples collected randomly. A plastic spatula was used to collect samples to avoid potential metal contamination. Sediment samples (n=7) were collected between March 2012 and February 2014 using in situ time-integrated suspended sediment samplers (Phillips, et al., 2000). Two sediment samplers consisting of polyvinyl chloride (PVC) pipes (1m long and 0.1m in diameter) were installed at the outlet of the Guaporé catchment (Figure 1c). The inlet and outlet of the tubes were composed of semi-rigid nylon pneumatic tubing with 4 mm diameter and 150 mm length. Each sampler collected between 20 and 100 g of sediment depending on the campaign. Seven periods were monitored with immersion durations ranging between 59 and 181 days (Table 1). Each period corresponds to the cumulative amount of rainfall required to generate runoff and erosion. Overall, periods ranging between two and three months were sufficient to collect significant amounts of sediment.
Hydrological characteristics
Daily rainfall, water discharge and suspended sediment concentrations were recorded at the outlet of the Guaporé catchment. For more details on the data acquisition, see Didoné et al. (2014). Sediment yields were calculated by multiplying the daily suspended sediment concentrations by the daily river discharge and summing it over the period investigated to estimate the quantity of sediment transiting the river network and reaching the catchment outlet. For each period of sediment collection, the mean daily flux (Mg d-1) was estimated (Evrard, et al., 2010b). These sediment yields and mean daily fluxes were used to weight the different soil source contributions. To better characterize temporal variations in sediment sources, soil type contributions to each outlet sediment sample was weighted with the mean daily sediment loads exported during each monitoring period.
Sample processing and laboratory analysis
Sediment sources were oven-dried at 50°C and dry-sieved to <2 mm and then to <63 µm to facilitate direct comparison with sediment. Samples were digested with hydrofluoric (5 mL), perchloric (3 mL)
acids and aqua regia (5 mL). Major and trace element concentrations were measured using an Inductively Coupled Plasma - Quadrupolar Mass Spectrometer (ICP-QMS). Samples were analyzed for major and minor elements (Na, Mg, Al, K, Ca, Ti, V, Cr, Mn, Fe, Co, Ni, Cu, Zn, As, Rb, Sr, Mo, Ag, Cd, Sb, Ba, Tl, Pb). Chemical separation and purification of strontium from digested solutions was carried out using a strontium specific resin following a standard chromatographic procedure and 87Sr/86Sr ratios were measured using a Thermo Finnigan Neptune-Plus Multi-Collector Inductively Coupled Plasma Mass Spectrometry (MC-ICP-MS) instrument. For more details, see Le Gall et al. (in review).
Source discrimination and modelling
Elements that provide discrimination between the different soil types were selected following a three-step process. First, the conservative behavior of each element was examined. Elements were considered to be conservative when the sediment concentrations plotted within the source range (Wilkinson, et al., 2013). Second, the ability of the conservative elements to discriminate between sources was examined using the Kruskal-Wallis H-test. Elements with p-values > 0.05 were excluded from further analysis. Finally, a stepwise discriminant function analysis (DFA) selected elements that provide optimal source discrimination based on the minimization of Wilk’s lambda (Collins, et al., 2010). Elements that passed this three-step process were then incorporated in mixing models.
A distribution modelling approach was used to quantify the relative contribution of each source to sediment through the minimization of the mixing model difference (MMD) (Laceby & Olley, 2014; Le Gall, et al., 2016): 𝑀𝑀𝐷 = 𝐴𝐵𝑆 ((𝐶𝑖− (∑ 𝑆𝑠𝑖𝑥𝑠 𝑚 𝑠=1 )) 𝐶⁄ ) + 𝐴𝐵𝑆 ((𝐶𝑖 𝑟− ((∑ 𝑆𝑠𝑟𝑊𝑠𝑥𝑠 𝑚 𝑠=1 ) (∑ 𝑊𝑠𝑥𝑠 𝑚 𝑠=1 ) ⁄ )) 𝐶⁄ 𝑟) (Eq. 1)
where Ci is the concentration of element i in the suspended sediment, m is the number of sources in the
catchment, Ssi is the concentration of element i in source (s), Cr is the strontium isotopic ratio (r) in the
suspended sediment, Ssr is the strontium isotopic ratio (r) in source (s), Ws is the strontium concentration
in source (s) which is used to weight the strontium isotopic ratios, MMD is the mixing model difference and xs is the proportional contribution of source (s) which is modelled as a truncated normal distribution (0≤xs≤1) with a mixture mean (µm) and a standard deviation (σm). Absolute values (ABS) are summed in Eq. (1).
Normal distributions were modelled for sediment and source samples. Sediment samples were modelled as a group of samples (i.e., grouping the entire monitoring period) and also individually (i.e., individual monitoring periods). When the monitoring groups were sampled individually, their analytical errors were used as an alternative to the standard deviation to model normal distributions (Evrard, et al., 2016). The Optquest algorithm in Oracle’s Crystal Ball software solved Eq. (1) by minimizing the median of the MMD. Distributions were modelled within a Monte Carlo approach (for more information see Foucher et al., 2015, Haddadchi et al., 2014, Laceby & Olley, 2014). Non-negative constrains were modelled for all source and sediment distributions. The optimal source contribution (xs) was determined by solving Eq (1) 2500 times. For each simulation, 2500 Latin Hypercube samples were drawn from the source and sediment distributions by varying µm and σm. Correlations were maintained throughout the modelling process (Laceby & Olley, 2014) (Tables S1).
This model simulation and solving process was repeated 2500 times with the median proportional source contribution from these 2500 simulations reported as the contribution of each source. Model uncertainties were determined through the sum of the modelled standard deviation, the median absolution deviation (MAD) of the modelled source contribution and the MAD of the modelled standard deviation for the 2500 simulations (Laceby, et al., 2015). Results are presented using the notation ± to express the standard error associated with one sample whereas the mean and standard deviation (SD) are used for groups of samples. When soil type contributions were summed, the combined standard errors were defined as the mean of the errors estimated for each soil type contribution.
RESULTS
Geochemical discrimination of sediment sources
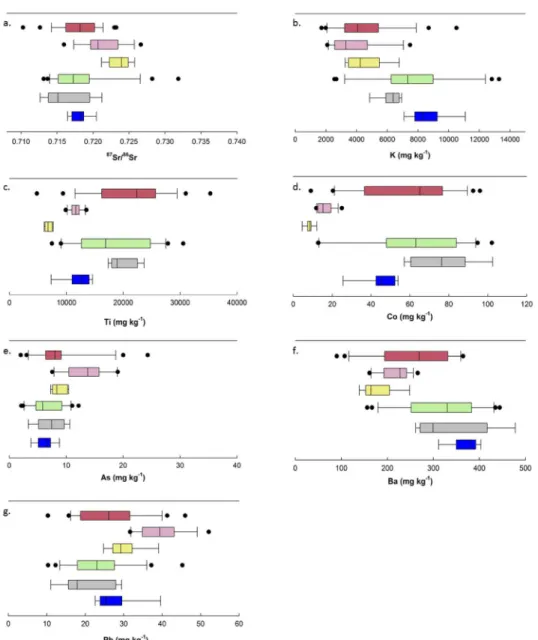
Na was the only non-conservative parameter, with concentrations in sediment being higher than in the potential sources. Consequently, Na was removed from further analysis. Using the Kruskal-Wallis H-test, three elements did not provide significant discrimination (Al, Rb and Cd) and from the twenty remaining parameters (Supporting information, Table S2), seven were selected for modelling with the forward stepwise DFA (p < 0.05) (K, Ti, Co, As, Ba, Pb and 87Sr/86Sr) (Supporting information, Table S3, Figure S1). Variations in elemental and strontium isotopic ratios were observed for the different soil type samples (Figure 2). Ferralsols had the largest variations, with highly dispersed values that overlapped with those observed in the remaining soil type samples. Variations observed for Nitisols systematically plotted within those of Ferralsols. Elemental concentrations and strontium isotopic ratios in Luvisols also displayed large variations, and those observed in Acrisols and Luvisols remained in the same range of values. Nitisols and Acrisols exhibited the lowest Co, K, and Ti concentrations (Figure 2b,c,e), intermediate As and Ba concentrations (Figure 2d,f) and high Pb concentrations (Figure 2g) compared to the Ferralsols, Luvisols and Leptosols. Variations in Leptosol concentrations were lower than those observed in Luvisols although they exhibited the same trends with high Co, Ti and Ba (Figure 2b,e,f) concentrations, low As and Pb concentrations (Figure 2d,g) and intermediate K concentrations (Figure 2c) compared to Ferralsols, Nitisols and Acrisols. Sediment concentrations and strontium isotopic ratios were well constrained with low variations within the source range.
Modelling results Source contributions
Modelling results indicated that Acrisols (mean 41%, SD 4%) and Leptosols (mean 34%, SD 4%) supplied most of the sediment, with contributions ranging between 34 ± 2% and 65 ± 2% for Acrisols and between 16 ± 1% and 50 ± 2% for Lepsotols. Luvisol (mean 17%; SD 4%) contributions were lower, with values ranging between 7 ± 1% and 24 ± 5%. Ferralsol (mean 4%, SD 2%) and Nitisol (mean 4%, SD 6%) contributions were the lowest, ranging between 2 ± 7% and 5 ± 2%, and 3 ± 1% and 7± 4%, respectively (Table 1).
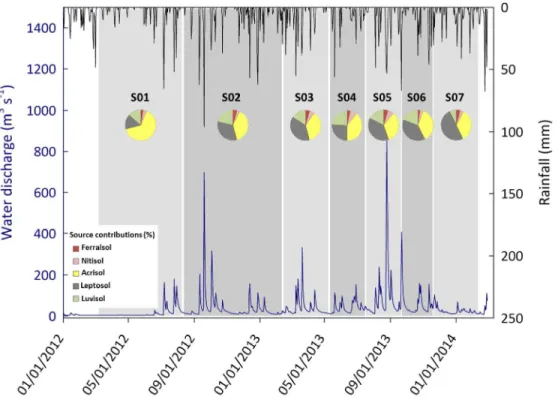
Acrisol contributions tended to decrease at the beginning of the study period (S01 to S02) and reached stable contributions (S03 to S06) over the remaining period (Figure 3). The maximum contribution (65 ± 2%) was estimated for the March to August 2012 period (S01) while stable contributions, ranging between 34 ± 2% and 40 ± 9% were observed between August 2012 and December 2014 (S02, S03, S04, S05, S06). Leptosol contributions were the lowest (S01) during the March to August 2012 period (16 ± 1%), were stable between August 2012 and November 2013 with contributions ranging between 26 ± 8% and
38 ± 6% (S02 to S06), and strongly increased to reach a maximum contribution of 50 ± 2% for the November 2013 to February 2014 period (S07). Luvisol contributions were stable between March 2012 and November 2013 (S01 to S06) and reached their lowest contribution (7 ± 8%) between November 2013 and February 2014 (S07). Soils found in lower parts of the catchment (Acrisol, Luvisol and Leptosol) contributed the majority of the sediment supply with a mean contribution of 92 ± 4%. Conversely, contributions from soils in the upper catchment area (i.e., Ferralsol and Nitisol) did not exceed 11 ± 8%. Weighted source contributions
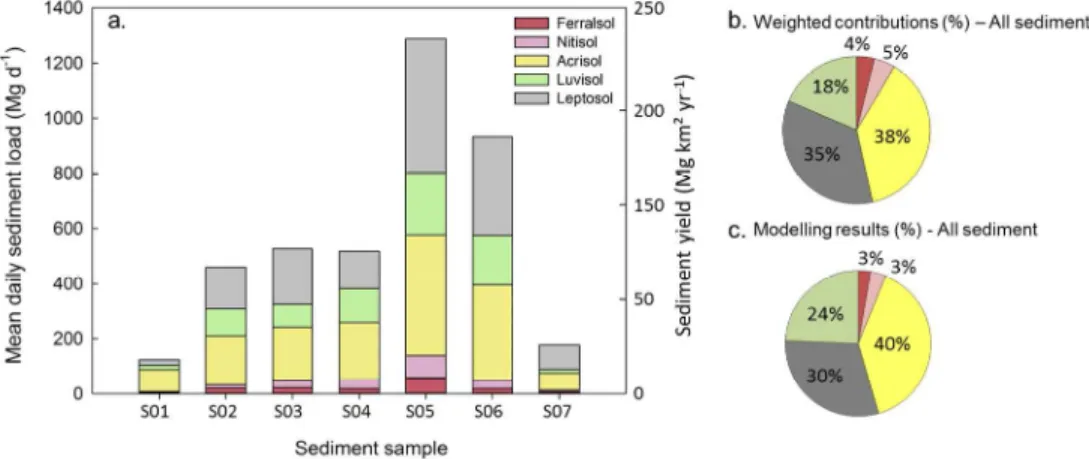
Mean daily sediment loads and sediment yields were estimated for each monitoring period (Figure 4a, Supporting information Table S4). Mean daily sediment loads were estimated to 124 Mg d-1 (S01) between March and August 2012 before increasing to reach steady values of 459 Mg d-1 (S02), 527 Mg d-1 (S03) and 518 Mg d-1 (S04) between August 2012 and April 2013. From July to September 2013, the mean sediment load strongly increased to reach a maximal value of 1289 Mg d-1 (S05). From September 2013 to February 2014 (S06), the mean sediment load decreased (933 Mg d-1) to reach the lowest value (177 Mg d-1) between November 2013 and February 2014 (S07) (Figure 4a, Supporting information Table S4). For each study period, mean sediment yields ranged between 22 (S01) and 231 Mg km-² yr-1 (S05) and followed the same variations as sediment loads (Figure 4a, Table 1). The mean sediment yield over the entire monitored period was estimated to 103 Mg km-² yr-1.
Weighted contributions (Figure 4b) were compared to modelling results obtained incorporating all sediment samples (Figure 4c). Similar trends were observed with Acrisols predominantly contributing the sediment supply (38% for the weighted contributions and 40% when modelling all sediment samples), followed by Leptosols (35% and 30% respectively) and Luvisols (18% and 24% respectively) while Ferralsols and Nitisols remained the lowest contributors with inputs ranging between 3 and 5%.
DISCUSSION
In the Guaporé catchment, overbank sediment deposition may be observed in the vicinity of the river system in the upper catchment area. Previous findings indicated that cropland (88 ± 19%) was the main source of outlet sediment, compared to very low channel bank contributions (10 ± 18%) (Tiecher, 2015). As the sediment supply from channel banks is negligible in this catchment, the discussion will focus on the variations of cropland contributions to sediment transport in this catchment.
Spatial and temporal variations of sediment sources and sediment yields
Upstream soil contributions (Ferralsols, mean 4%, SD 2%; Nitisols, mean 4%, SD 6%) remained low during the entire monitoring period, suggesting their low sensitivity to soil erosion whatever the hydrological conditions. In contrast, soils from the lower catchment area (Acrisols, mean 41%, SD 4%; Leptosols, mean 34%, SD 4%; Luvisols, mean 17%, SD 4%) systematically dominated the outlet sediment supply throughout time. For the S01 sediment sample (March to August 2012), precipitation, water discharge and sediment loads were low and were associated with the maximal Acrisol contribution (65 ± 2%). The highest precipitation and water discharge were observed between August and September 2013, and recorded by two sediment samples, S02 (from August 2012 to February 2013) and S05 (from July to September 2013) with Acrisols (mean 36%, SD 3%) and Leptosols (mean 35%, SD 5%) dominating the
sediment supply. For the S07 sediment sample (November 2013 to February 2014), water discharge was low and associated to a maximal Leptosol contribution (50 ± 2%) and followed by a significant Acrisol contribution (35 ± 3%).
Erosive rainfall events mainly occur from September to November when soils are plowed for planting tobacco and maize in the downstream part of the catchment, increasing soil detachment and transport to the river network (Didoné, et al., 2014). This is consistent with the highest mean sediment loads estimated for the August to November 2013 period at the outlet of the catchment (1,289 and 933 Mg d-1 of sediment for the S05 and S06 samples, respectively) (Figure 4a). Acrisol (mean 35%, SD 3%), Leptosol (mean 38%, SD 6%) and Luvisol (mean 18%, SD 2%) contributions remained quite homogeneous during this period. The lowest Luvisol contributions were observed for the S01 (13 ± 1%) and S07 (7 ± 8%) sediment samples, when precipitation and water discharge were the lowest and when Acrisols (S01) and Leptosols (S07) dominated the sediment supply. No significant variations were evident during the remainder of the monitoring period, suggesting that these two soil types are exposed to erosion processes during the entire year. No significant variations were observed between the weighted and modelled contributions incorporating all sediment samples (Figure 4b,c). These modelling results highlight the very low upstream soil contribution to outlet sediment with sediment mainly derived from downstream soil types, whatever the hydrological conditions.
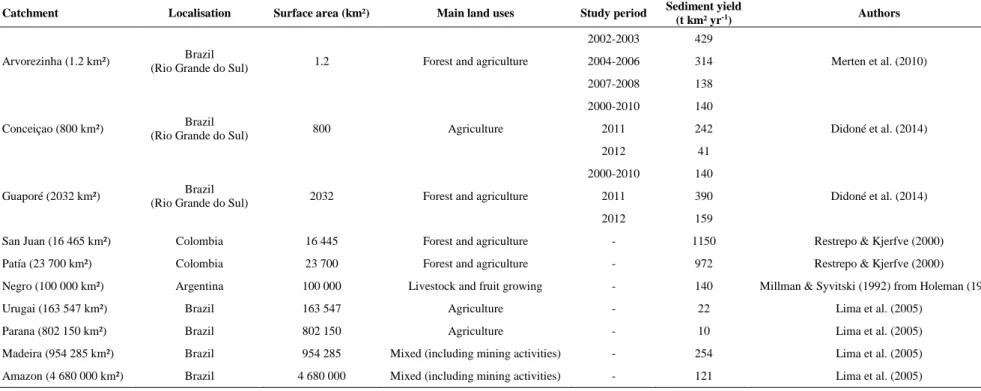
Mean sediment yields were also estimated to facilitate the comparison between the current research results and those obtained in studies carried out in South America (Table 2). Sediment yields, varying between 22 and 231 Mg km² yr-1, with a mean estimated to 103 Mg km² yr-1 over the monitored period, remained in the same order of magnitude as those measured in the Conceição and Avorezinha catchments, both located in southern Brazil (Rio Grande do Sul). In contrast, when compared to those obtained in larger catchments (i.e., Negro, Urugai, Parana and Amazon catchments), sediment yields calculated in the Guaporé catchment are higher and demonstrate the severity of erosion occurring in this cultivated region.
Management implications
This study indicates that most of the fine sediment (<63 µm) collected at the outlet of the catchment originated from local sources (i.e., Acrisols, Leptosols and Luvisols). Accordingly, differences in agricultural practices and soil type properties may also explain the high contributions of soils found in lower catchment areas.
In the Guaporé catchment, Ferralsols and Nitisols are intensively cultivated on gentle slopes with soybean under direct sowing. Overall, these soils are better managed than Acrisols, Luvisols and Leptosols. Adequate management practices are applied to reduce or eliminate soil disturbance using no-till, to maintain a permanent soil cover (with both plant residues and/or living plants) as long as possible, to diversify crops (through the rotation or succession of crops) and to implement mechanical runoff control measures such as terraces to improve soil conservation. Fertilizers and lime are extensively supplied to the soil surface to increase crop yields. As these soils are sensitive to compaction, the potential of nutrients to be transferred to the river network by runoff is intensified. In this study, potassium was used as a tracer and incorporated in mixing models. Although potassic fertilizers are used in the Guaporé catchment, the quantities supplied to the soils are too low to significantly affect the potassium signature of the soils. Furthermore, total potassium concentrations were used in this current research and this parameter is much less impacted by fertilizers than the exchangeable potassium fraction, which represents only a small fraction of the total potassium content (Martins et al., 2004; Melo et al., 2004).
The dense cover of Ferralsols and Nitisols with previous crop residues protects them against erosion, which is consistent with their low modelled contributions. Their good physical properties further decrease their sensitivity to soil erosion although all the recommended guidelines to implement effective no-till systems are not widely adopted in this area. Furthermore, the installation of ponds in upper reaches of the catchment likely reduce the connectivity between hillslopes and the river network and may also explain the low contribution of Ferralsols and Nitisols. In this region, downstream Acrisols, Leptosols and Luvisols are mainly cultivated with tobacco and subsistence agriculture under conventional tillage. Developed on highly degraded steep slopes, shallow Acrisols and Leptosols contribute the majority of outlet sediment. On these soils, subsistence agriculture prevails and the lack of financial and technical support available to the farmers for the promotion and the implementation of conservation measures may explain the elevated erosion and concomitant sediment supply from these landscapes.
Although agricultural practices may directly impact soil erodibility, various other factors, directly related to the landscape conditions, may also accelerate soil erosion and sediment transport. In the Guaporé catchment, a strong link is observed between cultivation practices and the relief (e.g., slope steepness, length and curvature). In the lower and middle parts of the catchment, the high drainage density has generated the formation of short, steep and concave slopes, where lateral flows dominate (runoff and subsurface flow), resulting in the formation of shallow and stony soils. Hillslopes are naturally well connected to the river network, because of the deep river incision. In addition to the impact of the slope gradient on soil erosion, soil compaction may also generate larger runoff volumes and a reduction of the soil surface roughness that may increase runoff velocity. In this context, farmers adapted their agricultural practices depending on the local context, the availability of technical solutions and their investment capacity. As a result, soil and landscape characteristics primarily guided the implementation of soil management strategies depending on the land use. Accordingly, no-till requiring heavy machinery that was initially designed for cereal cultivation is mainly implemented in upper catchment parts, characterized by gentle slopes. In contrast, conventional tillage is widely applied in lower catchment parts, where slopes are steeper which might cause the fall over of heavy machinery.
Modelling results related to agricultural practices suggest that to reduce the supply of sediment, management actions should focus on sediment originating from downstream sources (i.e., Acrisols and Leptosols). The implementation of conservation agriculture should be promoted to limit negative impacts of soil erosion in these areas. To this end, adapted no-till machinery should be developed for cultivating steeper slopes. Minella et al. (2009) investigated variations in sediment sources in a subcatchment (1.19 km²) of the Guaporé basin before and after the introduction of improved soil management practices including the sowing of cover crops in winter and the implementation of minimum tillage. A decrease of cropland contribution to sediment was observed, confirming the positive impact of an integrated set of soil conservation measures to reduce sediment supply from cultivated areas. Coordinating the implementation of these measures at the catchment scale was also shown to be very efficient in reducing off-site impacts of soil erosion, for example, in regions of Northwestern Europe where pilot strategies were tested to mitigate muddy floods originating from intensively cultivated cropland (Evrard, et al., 2010a).
CONCLUSIONS
This study highlighted the dominance of Acrisol, Leptosol and Luvisol contributions to the sediment sampled at the outlet of the Guaporé catchment. These three soil types are found in the lower area of the
catchment, on steep slopes and they are cultivated using conventional tillage, likely explaining their higher supply of sediment to the Guaporé River compared to that of Ferralsols and Nitisols cultivated on gentler slopes with direct sowing and other conservation practices. Accordingly, attention should focus on improving downstream land management practices (e.g., the implementation of comprehensive no-till systems) to reduce the sediment supply. In the future, the analysis of sediment cores collected in alluvial plains or reservoirs could be used to reconstruct the impact of land use and farming practice changes on sediment source dynamics. Modelling the sediment connectivity between hillslopes and the river system would also provide additional information on sediment pathways within the catchment, which could significantly contribute the implementation of effective soil conservation measures.
ACKNOWLEDGEMENTS
This work received financial support from the ‘Coordenação de Aperfeicoamento de Pessoal de Nível Superior – Comité Français de la Coopération Universitaire et Scientifique avec le Brésil’ (CAPES-COFECUB project No.Te 870-15). Marion Le Gall received a PhD fellowship from CEA (Commissariat à l'Energie Atomique et aux Energies Alternatives, France) and DGA (Direction Générale de l’Armement, Ministry of Defense, France).
REFERENCES
Albarède, F. 1995. Introduction to Geochemical Modeling. Cambridge University Press.
Asahara, Y, Ishiguro, H, Tanaka, T, Yamamoto, K, Mimura, K, Minami, M, Yoshida, H. 2006. Application of Sr isotopes to geochemical mapping and provenance analysis: The case of Aichi Prefecture, central Japan. Applied Geochemistry 21: 419-436. DOI:10.1016/j.apgeochem.2005.12.003. Bakker, MM, Govers, G, van Doorn, A, Quetier, F, Chouvardas, D, Rounsevell, M. 2008. The response of soil erosion and sediment export to land-use change in four areas of Europe: The importance of landscape pattern. Geomorphology 98: 213-226. DOI:10.1016/j.geomorph.2006.12.027.
Ben Slimane, A, Raclot, D, Evrard, O, Sanaa, M, Lefevre, I, Le Bissonnais, Y. 2016. Relative Contribution of Rill/Interrill and Gully/Channel Erosion to Small Reservoir Siltation in Mediterranean Environments. Land Degradation & Development 27: 785-797. DOI:10.1002/ldr.2387.
Bockheim, JG. 2015. Classification and development of shallow soils (<50cm) in the USA. Geoderma
Regional 6: 31-39. DOI:10.1016/j.geodrs.2015.11.001.
Bullen, TD, Kendall, C. 1998. Tracing weathering reactions and water flowpaths: a multi-isotope approach. In Isotope Tracers in Catchment Hydrology, C. Kendall and J.J. McDonnell (Eds.) Elsevier Science B.V., Amsterdam, pp. 611-646.
Casão Junior, R, Araujo, AG, Llanillo, RF. 2012. No-till agriculture in southern Brazil: Factors that facilitated the evolution of the system and the development of the mechanization of conservation farming. The Food and Agriculture Organization of the United Nations and Instituto Agronômico do Paraná, pp. 83.
Collins, AL, Zhang, Y, McChesney, D, Walling, DE, Haley, SM, Smith, P. 2012. Sediment source tracing in a lowland agricultural catchment in southern England using a modified procedure combining statistical analysis and numerical modelling. Science of the Total Environment 414: 301-17. DOI:10.1016/j.scitotenv.2011.10.062.
Collins, AL, Zhang, Y, Walling, DE, Grenfell, SE, Smith, P. 2010. Tracing sediment loss from eroding farm tracks using a geochemical fingerprinting procedure combining local and genetic algorithm optimisation. Science of the Total Environment 408: 5461-71. DOI:10.1016/j.scitotenv.2010.07.066. Didoné, EJ, Minella, JPG, Reichert, JM, Merten, GH, Dalbianco, L, de Barros, CAP, Ramon, R. 2014. Impact of no-tillage agricultural systems on sediment yield in two large catchments in Southern Brazil.
Journal of Soils and Sediments 14: 1287-1297. DOI:10.1007/s11368-013-0844-6.
Douglas, G, Gray, CM, Hart, B, Beckett, R. 1995. A strontium isotopic investigation of the origin of suspended particulate matter (SPM) in the Murray-Darling River system, Australia. Geochimica et
Cosmochimica Acta 59: 3799-3815. DOI:10.1016/0016-7037(95)00266-3.
Evrard, O, Heitz, C, Liégeois, M, Boardman, J, Vandaele, K, Auzet, AV, van Wesemael, B. 2010a. A comparison of management approaches to control muddy floods in central Belgium, northern France and southern England. Land Degradation & Development 21: 322-335. DOI:10.1002/ldr.1006.
Evrard, O, Laceby, JP, Huon, S, Lefèvre, I, Sengtaheuanghoung, O, Ribolzi, O. 2016. Combining multiple fallout radionuclides (137Cs, 7Be, 210Pbxs) to investigate temporal sediment source dynamics in tropical, ephemeral riverine systems. Journal of Soils and Sediments 16: 1130-1144. DOI:10.1007/s11368-015-1316-y.
Evrard, O, Navratil, O, Ayrault, S, Ahmadi, M, Némery, J, Legout, C, Lefèvre, I, Poirel, A, Bonté, P, Esteves, M. 2011. Combining suspended sediment monitoring and fingerprinting to determine the spatial origin of fine sediment in a mountainous river catchment. Earth Surface Processes and Landforms 36: 1072-1089. DOI:10.1002/esp.2133.
Evrard, O, Némery, J, Gratiot, N, Duvert, C, Ayrault, S, Lefèvre, I, Poulenard, J, Prat, C, Bonté, P, Esteves, M. 2010b. Sediment dynamics during the rainy season in tropical highland catchments of central Mexico using fallout radionuclides. Geomorphology 124: 42-54. DOI:10.1016/j.geomorph.2010.08.007. Fernández-Getino, AP, Duarte, AC. 2015. Soil management guidelines in Spain and Portugal related to EU Soil Protection Strategy based on analysis of soil databases. Catena 126: 146-154. DOI:10.1016/j.catena.2014.11.003.
Fink, JR, Pedro, FdA. 2015. Aptidão agrícola dos principais solos das áreas de agricultura familiar do Sul do Brasil. Manejo e conservação do solo e de água em pequenas propriedades rurais no Sul do Brazil: Contextualizando as atividades agropecuárias e os problemas erosivos. Tiecher, T. (Ed) URI – Frederico Westph, Frederico Westphalen, RS, pp. 34–52.
Foucher, A, Laceby, PJ, Salvador-Blanes, S, Evrard, O, Le Gall, M, Lefèvre, I, Cerdan, O, Rajkumar, V, Desmet, M. 2015. Quantifying the dominant sources of sediment in a drained lowland agricultural catchment: The application of a thorium-based particle size correction in sediment fingerprinting.
Geomorphology 250: 271-281. DOI:10.1016/j.geomorph.2015.09.007.
Gardi, C, Angelini, M, Barceló, S, Comerma, J, Cruz Gaistardo, C, Encina Rojas, A, Jones, A, Krasilnikov, P, Mendonça Santos Brefin, ML, Montanarella, L, Muñiz Ugarte, O, Schad, P, Vara Rodríguez, MI, Vargas, R, Ravina da Silva, M. 2015. Soil Atlas of Latin America and the Caribbean, European Commission - Publications Office of the European Union, L-2995 Luxembourg.
Haddadchi, A, Olley, J, Laceby, JP. 2014. Accuracy of mixing models in predicting sediment source
contributions. The Science of the Total Environment 497-498: 139-152.
DOI:10.1016/j.scitotenv.2014.07.105.
Hughes, AO, Olley, JM, Croke, JC, McKergow, LA. 2009. Sediment source changes over the last 250 years in a dry-tropical catchment, central Queensland, Australia. Geomorphology 104: 262-275. DOI:10.1016/j.geomorph.2008.09.003.
Laceby, JP, McMahon, J, Evrard, O, Olley, J. 2015. A comparison of geological and statistical approaches to element selection for sediment fingerprinting. Journal of Soils and Sediments 15: 2117-2131. DOI:10.1007/s11368-015-1111-9.
Laceby, JP, Olley, J. 2014. An examination of geochemical modelling approaches to tracing sediment sources incorporating distribution mixing and elemental correlations. Hydrological Processes 29: 1669-1685. DOI:10.1002/hyp.10287.
Le Gall, M, Evrard, O, Foucher, A, Laceby, JP, Salvador-Blanes, S, Thil, F, Dapoigny, A, Lefevre, I, Cerdan, O, Ayrault, S. 2016. Quantifying sediment sources in a lowland agricultural catchment pond using 137Cs activities and radiogenic 87Sr/86Sr ratios. Science of the Total Environment 566-567: 968-980. DOI:10.1016/j.scitotenv.2016.05.093.
Lepage, H, Laceby, JP, Bonté, P, Joron, J-L, Onda, Y, Lefèvre, I, Ayrault, S, Evrard, O. 2016. Investigating the source of radiocesium contaminated sediment in two Fukushima coastal catchments with sediment tracing techniques. Anthropocene 13: 57-68. DOI:10.1016/j.ancene.2016.01.004.
Lima, JEFW, Lopes, WTa, Carvalho, NO, Vieira, MR, Silva, EM. 2005. Suspended sediment fluxes in the large river basins of Brazil. Sediment budgets 1. IAHS publication 291: 355-363.
Manzatto, CV, Junior, EDF, Perez, JRR. 2002. Uso Agrícola dos Solos Brasileiros. Embrapa Solos, 2002, pp. 174.
Martínez-Carreras, N, Krein, A, Gallart, F, Iffly, JF, Pfister, L, Hoffmann, L, Owens, PN. 2010. Assessment of different colour parameters for discriminating potential suspended sediment sources and provenance: A multi-scale study in Luxembourg. Geomorphology 118: 118-129. DOI:10.1016/j.geomorph.2009.12.013.
Masselink, RJH, Keesstra, SD, Temme, AJAM, Seeger, M, Giménez, R, Casalí, J. 2016. Modelling discharge and sediment yield at catchment scale using connectivity components. Land Degradation &
Development 27: 933-945. DOI:10.1002/ldr.2512.
Merten, GH, Araújo, AG, Biscaia, RCM, Barbosa, GMC, Conte, O. 2015. No-till surface runoff and soil losses in southern Brazil. Soil and Tillage Research 152: 85-93. DOI:10.1016/j.still.2015.03.014.
Merten, GH, Minella, JPG. 2013. The expansion of Brazilian agriculture: Soil erosion scenarios.
International Soil and Water Conservation Research 1: 37-48. DOI:10.1016/s2095-6339(15)30029-0.
Merten, GH, Minella, JPG, Moro, M, Maier, C, Cassol, EA, Walling, DE, Clarke, RT, Reichert, JM. 2010. The effects of soil conservation on sediment yield and sediment source dynamics in a catchment in southern Brazil. Sediment dynamics for a Changing Future (Proceedings of the ICCE symposium). IAHS
publication 337: 59-67.
Milliman, JD, Syvitski, JPM. 1992. Geomorphic/Tectonic Control of Sediment Discharge to the Ocean: The Importance o f Small Mountainous Rivers1. The Journal of Geology 100: 525-544.
Minella, JP, Merten, GH, Clarke, RT. 2004. Identification of sediment sources in a small rural drainage basin. Sediment transfer through the fluvial system (Proceedings of a symposium held in Moscow). IAHS
publication 288: 44-51.
Minella, JPG, Merten, GH, Walling, DE, Reichert, JM. 2009. Changing sediment yield as an indicator of improved soil management practices in southern Brazil. Catena 79: 228-236. DOI:10.1016/j.catena.2009.02.020.
Minella, JPG, Walling, DE, Merten, GH. 2014. Establishing a sediment budget for a small agricultural catchment in southern Brazil, to support the development of effective sediment management strategies.
Owens, PN, Batalla, RJ, Collins, AJ, Gomez, B, Hicks, DM, Horowitz, AJ, Kondolf, GM, Marden, M, Page, MJ, Peacock, DH, Petticrew, EL, Salomons, W, Trustrum, NA. 2005. Fine-grained sediment in river systems: environmental significance and management issues. River Research and Applications 21: 693-717. DOI:10.1002/rra.878.
Phillips, JM, Russell, MA, Walling, DE. 2000. Time-integrated sampling of fluvial suspended sediment: a simple methodology for small catchments. Hydrological Processes 14: 2589-2602. DOI:10.1002/1099-1085(20001015)14:14<2589::AID-HYP94>3.0.CO;2-D.
Quesada, CA, Lloyd, J, Anderson, LO, Fyllas, NM, Schwarz, M, Czimczik, CI. 2011. Soils of Amazonia with particular reference to the RAINFOR sites. Biogeosciences 8: 1415-1440. DOI:10.5194/bg-8-1415-2011.
Restrepo, JD, Kjerfve, B. 2000. Water Discharge and Sediment Load from the Western Slopes of the Colombian Andes with Focus on Rio San Juan. The Journal of Geology 108: 17-33.
Riccomini, C, Sant'Anna, LG, Fambrini, GL. 2016. The Early Cretaceous Jacuí Group, a newly discovered volcaniclastic–epiclastic accumulation at the top of the Paraná Basin, southern Brazil.
Cretaceous Research 59: 111-128. DOI:10.1016/j.cretres.2015.10.020.
Schmidt, AV. 1989. Terraceamento na região Sul. Simpósio sobre terraceamento agrícola. Proceedings,
Fundação Cargill: 23-25.
Sharma, A, Tiwari, KN, Bhadoria, PB. 2011. Effect of land use land cover change on soil erosion potential in an agricultural watershed. Environmental Monitoring and Assessment 173: 789-801. DOI:10.1007/s10661-010-1423-6.
Sherriff, SC, Franks, SW, Rowan, JS, Fenton, O, Ó’hUallacháin, D. 2015. Uncertainty-based assessment of tracer selection, tracer non-conservativeness and multiple solutions in sediment fingerprinting using synthetic and field data. Journal of Soils and Sediments 15: 2101-2116. DOI:10.1007/s11368-015-1123-5. Tiecher, T. 2015. Fingerprinting sediment sources in agricultural catchments in southern Brazil. Universidade Federal de Santa Maria, Graduate programm in soil science, Thesis, pp. 275.
Tiecher, T, Caner, L, Minella, JP, Santos, DR. 2015a. Combining visible-based-color parameters and geochemical tracers to improve sediment source discrimination and apportionment. Science of the Total
Environment 527-528: 135-49. DOI:10.1016/j.scitotenv.2015.04.103.
Tiecher, T, Caner, L, Minella, JPG, Bender, MA, dos Santos, DR. 2015b. Tracing sediment sources in a subtropical rural catchment of southern Brazil by using geochemical tracers and near-infrared spectroscopy. Soil and Tillage Research: DOI:10.1016/j.still.2015.03.001.
Towett, EK, Shepherd, KD, Tondoh, JE, Winowiecki, LA, Lulseged, T, Nyambura, M, Sila, A, Vågen, T-G, Cadisch, G. 2015. Total elemental composition of soils in Sub-Saharan Africa and relationship with soil forming factors. Geoderma Regional 5: 157-168. DOI:10.1016/j.geodrs.2015.06.002.
Vaezi, AR, Abbasi, M, Bussi, G, Keesstra, SD. 2016. Modeling sediment yield in semi-arid pasture micro-catchments, NW Iran. Land Degradation & Development: DOI:10.1002/ldr.2526.
Walling, DE, Russell, R, Hodgkinson, RA, Zhang, C. 2002. Establishing sediment budgets for two small lowland agricultural catchments in the UK. Catena 47: 323-353. DOI:10.1016/S0341-8162(01)00187-4. Wasson, RJ, Caitcheon, G, Murray, AS, McCulloch, M, Quade, JAY. 2002. Sourcing Sediment Using Multiple Tracers in the Catchment of Lake Argyle, Northwestern Australia. Environmental Management
29: 634-646. DOI:10.1007/s00267-001-0049-4.
Wilkinson, SN, Hancock, G, Bartley, R, Hawdon, A, Keen, RJ. 2013. Using sediment tracing to assess processes and spatial patterns of erosion in grazed rangelands, Burdekin River basin, Australia.
World Reference Base for Soil Resources. 2006. A framework for international classification, correlation and communication. Food and Agriculture Organization of the United Nations - FAO. IUSS Working Group WRB. World Soil Resources Reports No. 103, Rome, Italy.
Yuan, Y, Jiang, Y, Taguas, EV, Mbonimpa, EG, Hu, W. 2015. Sediment loss and its cause in Puerto Rico watersheds. Soil 1: 595-602. DOI:10.5194/soil-1-595-2015.
Zhang, Q, Lei, T, Huang, X. 2016. Quantifying the sediment transport capacity in eroding rills using a REE tracing method. Land Degradation & Development. DOI:10.1002/ldr.2535.
Zhao, G, Mu, X, Jiao, J, An, Z, Klik, A, Wang, F, Jiao, F, Yue, X, Gao, P, Sun, W. 2016. Evidence and causes of spatiotemporal changes in runoff and sediment yield on the Chinese Loess Plateau. Land
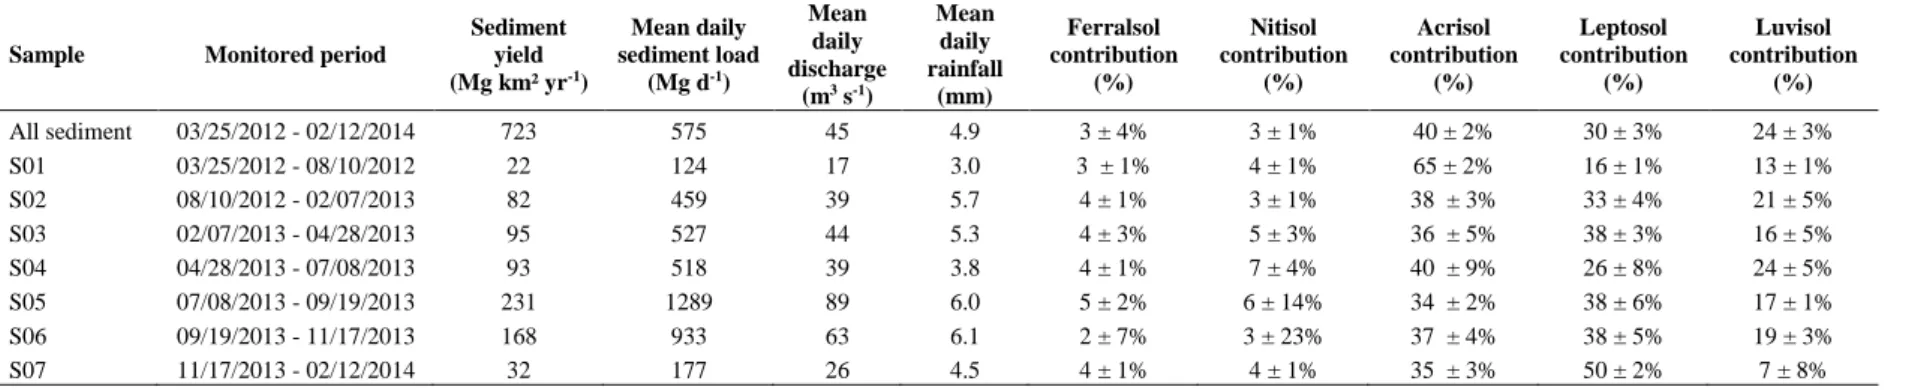
Table 1. Outlet sediment sample characteristics for each monitored period (sediment yield, mean daily sediment load, water discharge and rainfall) and distribution modelling results for each monitored period and soil type.
Sample Monitored period
Sediment yield (Mg km² yr-1) Mean daily sediment load (Mg d-1) Mean daily discharge (m3 s-1) Mean daily rainfall (mm) Ferralsol contribution (%) Nitisol contribution (%) Acrisol contribution (%) Leptosol contribution (%) Luvisol contribution (%) All sediment 03/25/2012 - 02/12/2014 723 575 45 4.9 3 ± 4% 3 ± 1% 40 ± 2% 30 ± 3% 24 ± 3% S01 03/25/2012 - 08/10/2012 22 124 17 3.0 3 ± 1% 4 ± 1% 65 ± 2% 16 ± 1% 13 ± 1% S02 08/10/2012 - 02/07/2013 82 459 39 5.7 4 ± 1% 3 ± 1% 38 ± 3% 33 ± 4% 21 ± 5% S03 02/07/2013 - 04/28/2013 95 527 44 5.3 4 ± 3% 5 ± 3% 36 ± 5% 38 ± 3% 16 ± 5% S04 04/28/2013 - 07/08/2013 93 518 39 3.8 4 ± 1% 7 ± 4% 40 ± 9% 26 ± 8% 24 ± 5% S05 07/08/2013 - 09/19/2013 231 1289 89 6.0 5 ± 2% 6 ± 14% 34 ± 2% 38 ± 6% 17 ± 1% S06 09/19/2013 - 11/17/2013 168 933 63 6.1 2 ± 7% 3 ± 23% 37 ± 4% 38 ± 5% 19 ± 3% S07 11/17/2013 - 02/12/2014 32 177 26 4.5 4 ± 1% 4 ± 1% 35 ± 3% 50 ± 2% 7 ± 8%
Table 2. Sediment yields estimated in various catchments of South America.
Catchment Localisation Surface area (km²) Main land uses Study period Sediment yield
(t km² yr-1) Authors
Arvorezinha (1.2 km²) Brazil
(Rio Grande do Sul) 1.2 Forest and agriculture
2002-2003 429
Merten et al. (2010)
2004-2006 314
2007-2008 138
Conceiçao (800 km²) Brazil
(Rio Grande do Sul) 800 Agriculture
2000-2010 140
Didoné et al. (2014)
2011 242
2012 41
Guaporé (2032 km²) Brazil
(Rio Grande do Sul) 2032 Forest and agriculture
2000-2010 140
Didoné et al. (2014)
2011 390
2012 159
San Juan (16 465 km²) Colombia 16 445 Forest and agriculture - 1150 Restrepo & Kjerfve (2000)
Patía (23 700 km²) Colombia 23 700 Forest and agriculture - 972 Restrepo & Kjerfve (2000)
Negro (100 000 km²) Argentina 100 000 Livestock and fruit growing - 140 Millman & Syvitski (1992) from Holeman (1968)
Urugai (163 547 km²) Brazil 163 547 Agriculture - 22 Lima et al. (2005)
Parana (802 150 km²) Brazil 802 150 Agriculture - 10 Lima et al. (2005)
Madeira (954 285 km²) Brazil 954 285 Mixed (including mining activities) - 254 Lima et al. (2005)
For Peer Review
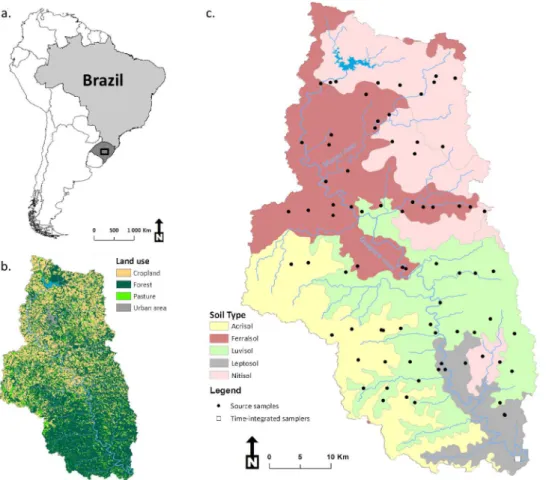
Figure 1. Maps of the Guaporé catchment in the Rio Grande do Sul State (dark grey) in Brazil (light grey) (a), land use (b), and soil type along with the location of the time-integrated river samplers and source
samples (c).
222x191mm (300 x 300 DPI)
Page 18 of 21 Land Degradation & Development
1 2 3 4 5 6 7 8 9 10 11 12 13 14 15 16 17 18 19 20 21 22 23 24 25 26 27 28 29 30 31 32 33 34 35 36 37 38 39 40 41 42 43 44 45 46 47 48 49 50 51 52 53 54 55 56 57 58 59 60
For Peer Review
Figure 2. Box plots of the concentrations of the discriminant elements in the different soil types and in outlet sediment samples (bold horizontal line = median, box extent = 25th percentiles, error bars = non-outlier
range, black dots = outliers). 191x235mm (300 x 300 DPI)
Page 19 of 21 Land Degradation & Development
1 2 3 4 5 6 7 8 9 10 11 12 13 14 15 16 17 18 19 20 21 22 23 24 25 26 27 28 29 30 31 32 33 34 35 36 37 38 39 40 41 42 43 44 45 46 47 48 49 50 51 52 53 54 55 56 57 58 59 60
For Peer Review
Figure 3. Soil type contributions to outlet sediment between 2012 and 2014 with river discharge (blue) and rainfall (black) lines.
250x178mm (300 x 300 DPI)
Page 20 of 21 Land Degradation & Development
1 2 3 4 5 6 7 8 9 10 11 12 13 14 15 16 17 18 19 20 21 22 23 24 25 26 27 28 29 30 31 32 33 34 35 36 37 38 39 40 41 42 43 44 45 46 47 48 49 50 51 52 53 54 55 56 57 58 59 60
For Peer Review
Figure 4. Evolution of the mean daily sediment load (a) deduced from the analysis of each outlet sediment sample. The weighted contributions (b) and modelling results run for all sediment samples (c) obtained for
the entire set of sediment samples are also presented in pie charts. 262x118mm (300 x 300 DPI)
Page 21 of 21 Land Degradation & Development
1 2 3 4 5 6 7 8 9 10 11 12 13 14 15 16 17 18 19 20 21 22 23 24 25 26 27 28 29 30 31 32 33 34 35 36 37 38 39 40 41 42 43 44 45 46 47 48 49 50 51 52 53 54 55 56 57 58 59 60