DOE/ET-51013-271
Confinement of multiply charged ions in an ECRH mirror plasma
Clinton Craig Petty
June 1989
Plasma Fusion Center
Massachusetts Institute of Technology Cambridge, Massachusetts 02139
PFC/RR-89-9
CONFINEMENT OF MULTIPLY CHARGED
IONS IN AN ECRH MIRROR PLASMA
by
Clinton Craig Petty
B.S., University of Missouri (1983)
S.M., Massachusetts Institute of Technology (1986)
Submitted to the Department of Nuclear Engineering
in partial fulfillment of the requirements for the degree of
Doctor of Philosophy
at the
MASSACHUSETTS INSTITUTE OF TECHNOLOGY
August 1989
©
Massachusetts Institute of Technology 1989
Signature of A uthor ...
Department of Nuclear Engineering
June 19, 1989
Certified by...
Donald K. Smith
Research Scientist, Plasma Fusion Center
Thesis Supervisor
C ertified by ...
Ian H. Hutchinson
Professor of Nuclear Engineering
Thesis Reader
A ccepted by ...
Allan F. Henry
Chairman, Departmental Committee on Graduate Students
CONFINEMENT OF MULTIPLY CHARGED
IONS IN AN ECRH MIRROR PLASMA
by
Clinton Craig Petty
Submitted to the Department of Nuclear Engineering on June 19, 1989, in partial fulfillment of the
requirements for the degree of Doctor of Philosophy
Abstract
This thesis is an experimental study of multiply charged ions in the Constance B mir-ror experiment. By measuring the ion densities, end loss fluxes and ion temperatures, the parallel confinement times for the first five charge states of oxygen and neon plas-mas are determined. The parallel ion confinement times increase with charge state and peak on axis, both indications of an ion-confining potential dip created by the hot electrons. The radial profile of ion end loss is usually hollow due to large ion radial transport (71i -: r1 ), with the peak fluxes occurring at the edge of the electron cyclotron resonance zone.
Several attempts are made to increase the end loss of selected ion species. Using minority ICRH, the end loss flux of resonant ions increases by 20% in cases when radial transport induced by ICRH is not too severe. A large antenna voltage can also extinguish the plasma. By adding helium to an oxygen plasma, the end loss of 0s+
increases by 80% due to decreased ion radial transport.
An ion model is developed to predict the ion densities, end loss fluxes and con-finement times in the plasma center using the ion particle balance equations, the quasineutrality condition and theoretical confinement time formulas. The model gen-erally agrees with the experimental data for oxygen and neon plasmas to within experimental error. Under certain conditions spatial diffusion appears to determine the parallel ion confinement time of the highest charge states. For oxygen plasmas during ICRH, the measured parallel confinement time of the resonant ions is much shorter than their theoretical value, probably due to rf diffusion of the ions into the loss cone.
Thesis Supervisor: Donald K. Smith
Acknowledgements
I would like to thank my thesis advisor, Dr. Donald Smith, for overseeing the work performed in this thesis. I have greatly benefited from his excellent teaching of the trade of scientific research. I also thank Dr. Donna Smatlak, the leader of the Constance group and an experienced experimentalist, for her advice and guidance. Dr. Smatlak is responsible for the excellent operation of Constance B as a plasma physics experiment. Dr. Barton Lane provided excellent suggestions in the area of plasma confinement. I also wish to thank Professor Ian Hutchinson for serving as my thesis reader.
My colleague and friend Daniel Goodman deserves special thanks. As the two graduate students studying ion physics on Constance B, we collaborated on certain experimental projects. I am also grateful to the other "mirror" graduate students: Xing Chen, Thomas Farish, Richard Garner, Gerald Gibson, Samuel Hokin, John Machuzak, Thomas Moran and John Zielinski for making the working environment both stimulating and enjoyable. I also wish to thank Nai-Chang Yeh for her unyielding support during this time.
Since this dissertation marks the end of my formal education, I would especially like to thank my parents, Clinton and Edye Petty, for showing me through example
how to be a scholar and a gentleman.
During the years 1983-1987 1 was financially supported by the Magnetic Fusion Energy Technology Fellowship administered by Oak Ridge Associated Universities. Additional support came from the U.S. Department of Energy under contract
DE-AC02-78ET51013.
Sojourned han thise merchantz in that toun
A certein tyme, as
fil
to hire plesance.
And so bifel that th'excellent renoun
Of the Emperoures doghter, dame Custance,
Reported was, with every circumstance, Unto thise Surryen marchantz in swich wyse, Pro day to day, as I shal yow devyse.
This was the commune voys of every man: "Oure Emperour of Rome-God hym
see!-A doghter hath that, syn the world bigan,
To rekene as wel hir goodnesse as beautee, Nas nevere swich another as is shee. Iprey to God in honour hire susteene, And wolde she were of al Europe the queene.
"In hire is heigh beautee, withoute pride, Yowthe, withoute grenehede or folye; To alle hire werkes vertu is hir gyde; Humblesse hath slayn in hire al tirannye. She is mirour of alle curteisye;
Hir herte is verray chambre of hoolynesse, Hir hand, ministre of fredam for almesse."
Contents
1 Introduction
1.1 Statement of problem. . . . . 1.2 Description of an ECR ion source . . . . 1.3 Ion confinement in a hot electron plasma . . . . 1.4 Previous work . . . . 1.5 Organization . . . .
17
17 18 19 20 242 The Constance B Experiment 25
2.1 Basic systems . . . . 25
2.1.1 magnetic field . . . . 25
2.1.2 vacuum system . . . . 26
2.1.3 ECR heating system . . . . 29
2.1.4 ICR heating system . . . . 29
2.1.5 experimental control . . . . 31
2.1.6 data acquisition . . . .. . . 31
2.2 Diagnostics and experimental method . . . . 33
2.2.1 end loss analyzer . . . . 33
2.2.2 ion time-of-flight analyzer . . . . 35
2.2.3 visible light spectrometers . . . . 42
2.2.4 VUV spectrometer . . . . 43
2.2.5 microwave interferometer . . . . 44
2.2.6 CCD camera . . . . 45
2.2.8
2.2.9
diamagnetic loop . . . . line ratios . . . .
3 Plasma Modeling
3.1 Ion particle balance . . . . 3.2 Ion confinement . . . . 3.2.1 parallel ion confinement . . . 3.2.2 perpendicular ion confinement 3.3 Ion power balance . . . . 3.4 Solving the ion model . . . . 3.5 Electron confinement . . . . 3.6 Electron particle and power balance .
4 Experimental Results 4.1 Oxygen . . . . 4.2 Neon . . . . 4.3 Other gases . . . . . 4.4 Minority ion heating
4.4.1 oxygen . . . . 4.4.2 neon . . . . . 4.4.3 candle effect . 4.5 Gas mixing . . . . . 4.6 Electrons . . . . 5 Conclusions 5.1 Summary of results . . . . 5.2 Implications for ECR ion sources . . . . 5.3 Suggestions for future work . . . .
49 49 51 51 53 55 59 63 64 65 68 72 72 87 99 106 106 120 132 138 146 155 155 157 162 . . . . . . . .
List of Figures
1-1 Elevation view of the ECR ion source at Lawrence Berkeley Laboratory. 19 1-2 Regions of confinement in velocity space for (a) ions and (b) electrons.
Dashed curves show purely magnetic confinement while solid curves indicate the loss boundary modification by the ambipolar potential. . . 21 1-3 Axial potential and magnetic distribution for an ECRH mirror plasma. 22
2-1 The Constance B magnet is wound in the shape of the seam of a baseball. The shape of the confined plasma is also.shown. . . . 26 2-2 The Constance B magnetic field lines (solid lines) and mod-B contours
(dotted lines) are shown. The mirror ratio for each mod-B contour is given . . . . 27 2-3 The Constance B vacuum chamber consists of a central chamber and
two fan tanks. The fan tanks are rotated 90 degrees with respect to each other. . . . 28 2-4 Antenna matching network for ICRH experiments . . . . 30 2-5 A typical shot for the Constance B mirror experiment. . . . . 32 2-6 Diagram of accelerating/focusing lens, collimators and deflection plates.
All dimensions are in mm. . . . 37 2-7 Fast switching circuit for deflection plates. . . . . 38 2-8 Time-of-flight spectrum for an argon plasma, the sum of 1000 spectra
over one second. . . . 40 2-9 Count pulse height from the electron multiplier vs. ion mass for H+,
2-10 Count pulse height from the electron multiplier vs. ion charge state for argon. . . . 41 2-11 The technique used to divide the electrons into their hot and cold
components from the microwave interferometer decay is shown. . . . . 45 2-12 The geometrical correction f n ds/ f n dz is shown for the best fit plasma
m odel. . . . 47
3-1 Regions of particle confinement in (e, 1p) space for the potential trap model (not to scale). . . . 56 3-2 Axial profile of hot electron density (hollow points) and plasma
pres-sure (solid line) . . . 57 3-3 Flow chart for determining the ion densities, confinement times and
potential dip from the ion model equations (in parenthesis). . . . 66
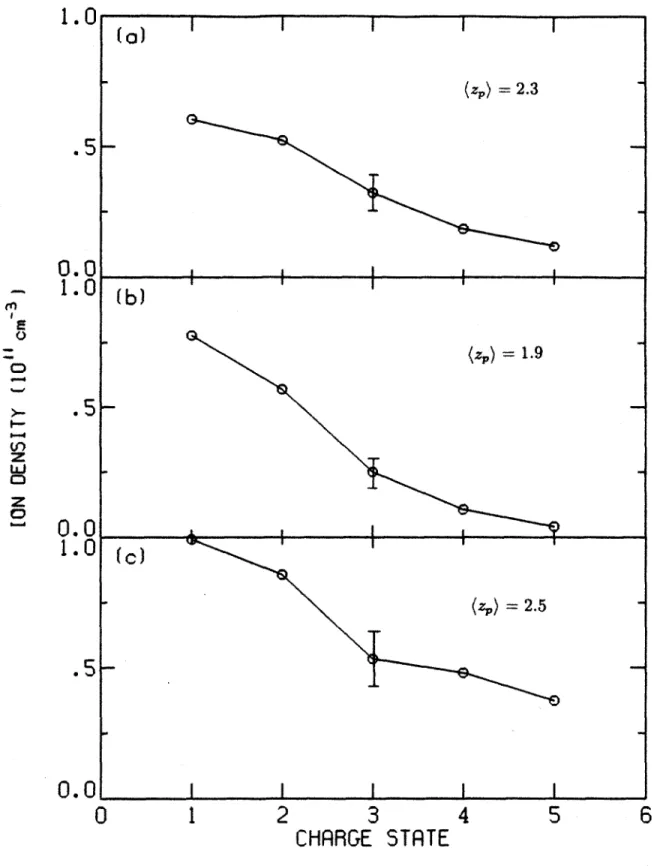
4-1 Radial profile of hot and cold electron density for the 1 kW, 5 x 10⁻⁷Torr oxygen plasm a. . . . 74 4-2 Radial profile of plasma beta for the 1 kW, 5 x 10~Torr oxygen plasma. 74 4-3 Ion densities in the plasma center for the (a) 1 kW, 5 x 10⁻⁷Torr, (b)
1 kW, 1 x 10-Torr and (c) 3.4 kW, 1 x 10-sTorr oxygen plasmas. . . 75 4-4 Ion fluxes mapped to the magnetic midplane for the 1 kW, 5 x 10- 7Torr
oxygen plasm a. . . . 76 4-5 Ion fluxes mapped to the magnetic midplane for the 1 kW, 1 x 1l-OTorr
oxygen plasm a. . . . 76 4-6 Ion fluxes mapped to the magnetic midplane for the 3.4 kW, 1 x
10-l Torr oxygen plasma. . . . 77 4-7 Parallel ion confinement times for the 1 kW, 5 x 10- 7Torr oxygen plasma. 77 4-8 Parallel ion confinement times for the 1 kW, 1 x 10⁻⁶Torr oxygen plasma. 78 4-9 Parallel ion confinement times for the 3.4 kW, 1 x 10-Torr oxygen
4-10 Ion temperatures parallel and perpendicular to the magnetic field, mea-sured by Doppler broadening, for the (a) I kW, 5 x 10⁻⁷Torr, (b) 1 kW,
1 x 10- Torr and (c) 3.4 kW, 1 x 10 Torr oxygen plasmas. . . . . 80 4-11 Ion temperatures from the time-of-flight analyzer for the 1 kW, 5 x
10-7 Torr oxygen plasma. . . . 81 4-12 Ion current density mapped to the magnetic midplane for two oxygen
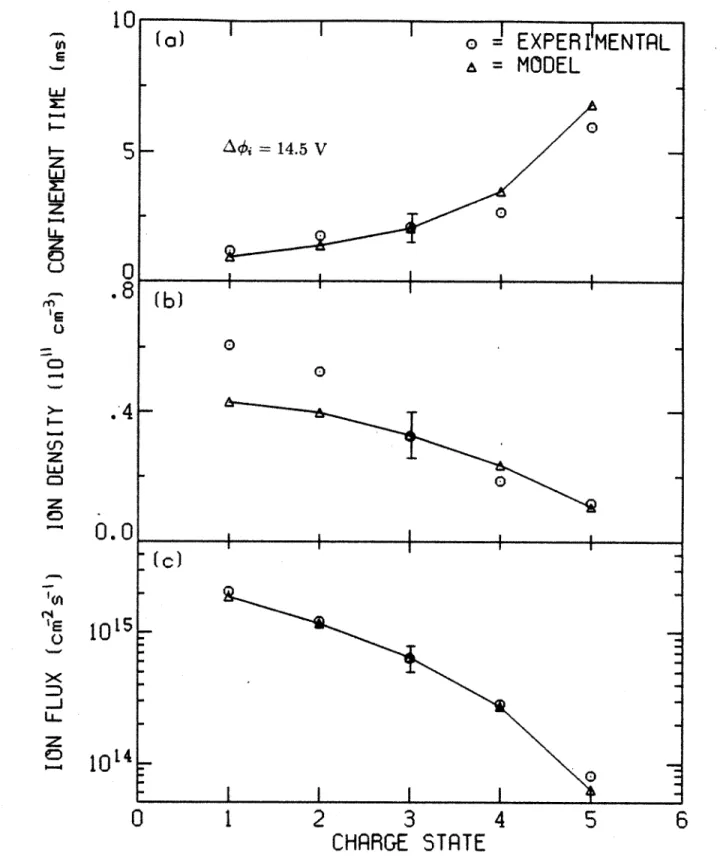
plasmas. The neutral pressure in both cases is n0 = 1 x 10~Torr. . . . 82 4-13 Comparison of experimental and model results: (a) parallel ion
con-finement times, (b) ion densities and (c) ion fluxes for the 1 kW, 5 x 10~7 Torr oxygen plasma. . . . 83 4-14 Comparison of experimental and model results: (a) parallel ion
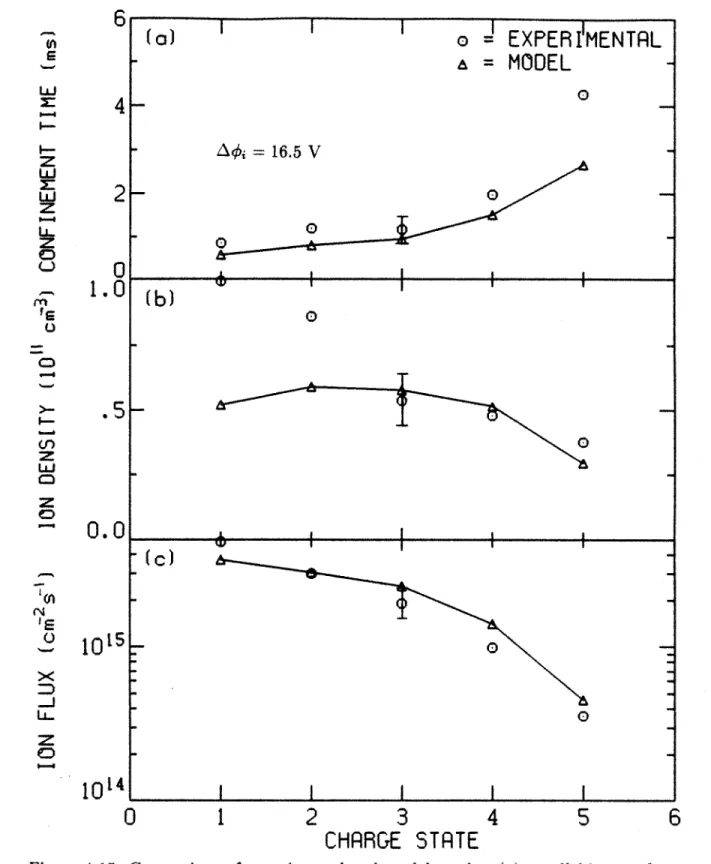
con-finement times, (b) ion densities and (c) ion fluxes for the 1 kW, 1 x 10~Torr oxygen plasma. . . . 84 4-15 Comparison of experimental and model results: (a) parallel ion
con-finement times, (b) ion densities and (c) ion fluxes for the 3.4 kW, 1 x 10- Torr oxygen plasma. . . . . 85 4-16 Deduced potential dip from the Pastukhov-flow model for the 1 kW,
5 x 10⁻⁷ Torr oxygen plasma. . . . . 88 4-17 Ion densities in the plasma center for (a) 1 kW, 5 x 10⁻⁷ Torr, (b) 4 kW,
5 x 10- 7Torr and (c) 4 kW, 1 x 10- Torr neon plasmas. . . . . 89 4-18 Ion fluxes mapped to the magnetic midplane for the 1 kW, 5 x 10⁻⁷Torr
neon plasm a. . . . . 90 4-19 Ion fluxes mapped to the magnetic midplane for the 4 kW, 5 x 10⁻⁷Torr
neon plasm a. . . . 91 4-20 Ion fluxes mapped to the magnetic midplane for the 4 kW, 1 x 10-Torr
neon plasm a. . . . .. . . . . 91 4-21 Parallel ion confinement times for the 1 kW, 5 x 10- 7Torr neon plasma. 92 4-22 Parallel ion confinement times for the 4 kW, 5 x 10~7Torr neon plasma. 92 4-23 Parallel ion confinement times for the 4 kW, 1 x 10~6Torr neon plasma. 93
4-24 Time-of-flight analyzer ion temperature for Ne+ as a function of the plasma potential for a neon plasma. . . . 94 4-25 Comparison of experimental and model results: (a) parallel ion
con-finement times, (b) ion densities and (c) ion fluxes for the 1 kW, 5 x 10~7Torr neon plasma. . . . 96 4-26 Comparison of experimental and model results: (a) parallel ion
con-finement times, (b) ion densities and (c) ion fluxes for the 4 kW, 5 x 10 7Torr neon plasma. . . . 97 4-27 Comparison of experimental and model results: (a) parallel ion
con-finement times, (b) ion densities and (c) ion fluxes for the 4 kW, 1 x 10~Torr neon plasma. . . . 98 4-28 Comparison of experimental and model parallel confinement times
us-ing K11 = 0.4 for the 1 kW, 5 x 10⁻⁷Torr neon plasma. . . . 100 4-29 Ion temperature of lowest charge state (measured by Doppler
broad-ening) for helium, oxygen, argon, krypton and xenon plasmas. . . . 100 4-30 Radial scan of He+ temperature at the magnetic midplane, determined
from Doppler broadening. . . . 101 4-31 Ion fluxes for (a) argon, (b) krypton and (c) xenon plasmas under
identical conditions. . . . 102 4-32 Comparison of experimental and model ion fluxes for helium. . . . . . 103 4-33 Comparison of experimental and model ion fluxes for argon. . . . . . 103 4-34 Comparison of experimental and model ion fluxes for argon using E_ =
-0.20 V /cm . . . . .. 104 4-35 Comparison of experimental and model ion fluxes for krypton. . . . . 105 4-36 Comparison of experimental and model ion fluxes for xenon. . . . . . 105 4-37 Ion temperatures parallel and perpendicular to the magnetic field
dur-ing ICRH for (a) 1 kW, 5 x 10⁻⁷Torr, (b) 1 kW, 1 x 10 Torr and (c) 3.4 kW, 1 x 10⁻⁶Torr oxygen plasmas. . . . 107 4-38 Ion densities with and without ICRH for the (a) 1 kW, 5 x 10- 7Torr,
4-39 Ion fluxes mapped to the magnetic midplane during ICRH for the 1 kW, 5 x 10⁻⁷Torr oxygen plasma. . . . .110 4-40 Ion fluxes mapped to the magnetic midplane during ICRH for the
1 kW, 1 x 10--Torr oxygen plasma. . . . 110 4-41 Ion fluxes mapped to the magnetic midplane during ICRH for the
3.4 kW, 1 x 10-Torr oxygen plasma. . . . 111 4-42 Flux of 04+ mapped to the magnetic midplane with and without ICRH
for the 3.4 kW, 1 x 10-Torr oxygen plasma .. . . . .111 4-43 Parallel ion confinement times during ICRH for the 1 kW, 5 x 10⁻⁷Torr
oxygen plasm a. . . . 112 4-44 Parallel ion confinement times during ICRH for the 1 kW, 1 x 10~Torr
oxygen plasm a. . . . 113 4-45 Parallel ion confinement times during ICRH for the 3.4 kW, 1 x 10-Torr
oxygen plasm a. . . . 113 4-46 Comparison of experimental and model results during ICRH: (a)
par-allel ion confinement times, (b) ion densities and (c) ion fluxes for the 1 kW, 5 x 10⁻⁷Torr oxygen plasma. . . . 116 4-47 Comparison of experimental and model results during ICRH: (a)
par-allel ion confinement times, (b) ion densities and (c) ion fluxes for the 1 kW, 1 x 10~6 Torr oxygen plasma. . . . 117 4-48 Comparison of experimental and model results during ICRH: (a)
par-allel ion confinement times, (b) ion densities and (c) ion fluxes for the 3.4 kW, 1 x 10-Torr oxygen plasma. . . . 118 4-49 Typical rf diffusion paths for the case when the resonance occurs off
the magnetic midplane. . . . 119 4-50 Deduced potential dip during ICRH for the 1 kW, 5 x 10⁻⁷Torr oxygen
plasm a. . . . 121 4-51 Ion temperatures parallel and perpendicular to the magnetic field
dur-ing ICRH for (a) 1 kW, 5 x 10⁻⁷Torr, (b) 4 kW, 5 x 10⁻⁷ Torr and (c) 4 kW, 1 x 10-Torr neon plasmas. . . . 122
4-52 Ion densities with and without ICRH for (a) 1 kW, 5 x 10~7Torr, (b) 4 kW, 5 x 10~7Torr and (c) 4 kW, 1 x 10~6 Torr neon plasmas. . . . . .124 4-53 Ion fluxes mapped to the magnetic midplane during ICRH for the
1 kW, 5 x 10⁻⁷Torr neon plasma. . . . .125 4-54 Ion fluxes mapped to the magnetic midplane during ICRH for the
4 kW, 5 x 10⁻⁷Torr neon plasma. . . . 125 4-55 Ion fluxes mapped to the magnetic midplane during ICRH for the
4 kW, 1 x 10-Torr neon plasma. . . . 126 4-56 Parallel ion confinement times during ICRH for the I kW, 5 x 10⁻⁷Torr
neon plasm a. . . . 126 4-57 Parallel ion confinement times during ICRH for the 4 kW, 5 x 10⁻⁷Torr
neon plasma. . . . .. . . . 127 4-58 Parallel ion confinement times during ICRH for the 4 kW, 1 x 10--Torr
neon plasm a. . . . 127 4-59 Comparison of experimental and model results during ICRH: (a)
par-allel ion confinement times, (b) ion densities and (c) ion fluxes for the 1 kW, 5 x 10⁻⁷Torr neon plasma. . . . 129 4-60 Comparison of experimental and model results during ICRH: (a)
par-allel ion confinement times, (b) ion densities and (c) ion fluxes for the 4 kW, 5 x 10-Torr neon plasma. . . . 130 4-61 Comparison of experimental and model results during ICRH: (a)
par-allel ion confinement times, (b) ion densities and (c) ion fluxes for the 4 kW, 1 x 10Torr neon plasma. . . . 131 4-62 A candle effect shot for a helium plasma. The plasma equilibrium is
lost during the high power ICRH pulse . . . 133 4-63 Maximum plasma potential during ICRH for the I kW, 5 x 10 7Torr
oxygen plasm a. . . . 134 4-64 Measured perpendicular flux fraction as a function of ICRH antenna
4-65 Measured perpendicular flux fraction as a function of ICRH antenna voltage for a helium plasma. . . . 136 4-66 Candle effect boundary for a helium plasma with 2 kW ECRH and
3.5 kG midplane magnetic field. . . . 137 4-67 Ion densities in plasma center for pure oxygen and oxygen-helium
plas-m as. . . . 139 4-68 Ion fluxes mapped to the magnetic midplane for the oxygen-helium
plasm a. . . . 140 4-69 Parallel confinement times for oxygen ions in the oxygen-helium plasma. 141 4-70 Ion temperatures perpendicular to the magnetic field measured by
Doppler broadening for the pure oxygen and oxygen-helium plasmas. .142 4-71 Fraction of O+ in the end loss (in %) as a function of the ratio of
hot-to-cold electrons. . . . 143 4-72 Fraction of 06+ in the end loss (in %) as a function of cold electron
tem perature. . . . 144 4-73 Fraction of 06+ in the end loss (in %) as a function of ion temperature. 145 4-74 Fraction of 06+ in the end loss (in %) as a function of perpendicular
flux fraction. . . . 146 4-75 Cold electron flux mapped to the magnetic midplane for the 1 kW,
5 x 10⁻⁷ Torr oxygen plasma. . . . 147 4-76 Parallel confinement time of the cold electrons for the 1 kW, 5 x
10-7Torr oxygen plasma. . . . 148 4-77 Cold electron temperature as a function of ECRH power for a helium
plasm a. . . . 149 4-78 Parallel confinement time of cold electrons a function of ECRH power
for a helium plasma. . . . 149 4-79 Cold electron density as a function of ECRH power for neon. . . . . . 150 4-80 Hot electron flux mapped to the magnetic midplane for the 1 kW,
4-81 Parallel confinement time of the hot electrons for the 1 kW, 5 x1l- 7Torr oxygen plasm a. . . . 152 4-82 Hot electron density as a function of ECRH power for neon. . . . . . 152 4-83 Heating rate (Teh/reh) of the hot electrons as a function of ECRH power
List of Tables
2.1 Relative ionization gauge sensitivity (compared to nitrogen). . . . . . 28
4.1 Parameters for the three oxygen plasmas studied in this section. . . . 73 4.2 Comparison of ion model results to experiment for oxygen plasmas. . 81 4.3 Sensitivity of model (z,) to model inputs . . . . 87 4.4 Parameters for the three neon plasmas studied in this section. . . . . 88 4.5 Comparison of ion model results to experiment for neon plasmas. . . 94 4.6 Electron parameters for the noble gas plasmas studied in this section. 99 4.7 Cold electron parameters during ICRH for oxygen plasmas. . . . 108 4.8 Ion fluxes (cm- 2s')
in the plasma center before and during ICRH for oxygen plasmas. . . . . . . .. . . . . . . 112 4.9 Comparison of ion model results to experiment during ICRH for oxygen
plasm as. . . . .. . . . . . . 115 4.10 Comparison of measured parallel confinement time for 04± during
ICRH with various theoretical values for oxygen plasmas. . . . 119 4.11 Cold electron parameters during ICRH for neon plasmas. . . . 121 4.12 Ion fluxes (cm-2s') in the plasma center before and during ICRH for
neon plasm as. . . . .. . . . .. . . . 123 4.13 Comparison of ion model results to experiment during ICRH for neon
plasm as. . . . . . . . 128 4.14 Comparison of electron parameters between the pure oxygen and
4.15 Ion fluxes in the plasma center for the pure oxygen and oxygen-helium plasm as. . . . 140 4.16 Comparison of ion confinement times for the pure oxygen and
Chapter 1
Introduction
1.1
Statement of problem
The motivation for this thesis is understanding the ion physics of electron cyclotron resonance (ECR) ion sources. These sources are minimum-B mirror plasmas which are created and maintained by electron cyclotron resonance heating (ECRH). They are usually fueled by a heavy gas or vaporized atoms from an oven. ECR ion sources produce high charge state ions which can be extracted from the open magnetic geom-etry for accelerators and atomic physics experiments. The ions in these sources are highly stripped due to the high electron temperature and long ion confinement time. The coupling of ECR ion sources to cyclotrons has resulted in significant perfor-mance gains in energy, intensity, reliability and variety of ion species [Lyneis, 1986]. An ECR ion source installed on the injector of the CERN SPS synchrotron supplied fully stripped oxygen and sulphur which was accelerated up to relativistic energies to produce quark-gluon plasmas [Jacob, 1989]. A project is underway at Argonne National Laboratory to couple an ECR ion source to a superconducting heavy-ion linac [Pardo, et al., 1989].
Although ECR ion sources have been used for the last decade with great success, the physics behind their operation is not well understood. Progress in source perfor-mance has mainly come experimentally by systematically changing the gas supply, ECR tuning, wall conditions, etc., on a trial and error basis. Understanding the
physics of ECR sources will help improve present sources without expensive system-atic adjustments and will aid in the design of future sources. The goal of this thesis therefore is to determine the relevant physics of a multiple ion-species plasma in an ECRH minimum-B mirror.
This thesis concentrates on the ion physics of plasmas in the Constance B mirror experiment (electron physics was the subject of previous work on Constance B [Gar-ner, et al., 1987; Chen, et al., 1989; Hokin, et al., 1989]). Of particular importance are the parallel ion confinement times, which are determined by measuring the ion densities and end loss fluxes. The experimental results are compared to a theoretical ion model to determine the relevant ion physics. In addition, several methods of in-creasing the end loss of selected ions are tested. First, medium charge state ions in the plasma are heated by ion cyclotron resonance heating (ICRH). This should increase their end loss by "boiling" them out of the ion-confining potential dip. Second, gas mixing is investigated by adding helium to an oxygen plasma to increase the end loss of high charge states of oxygen.
1.2
Description of an ECR ion source
An elevation view of the ECR ion source operated at Lawrence Berkeley Laboratory is shown in Fig. 1-1 [Lyneis, 1987]. It is fairly typical of other ECR ion sources and will serve to point out their important features. The source is divided into two plasma stages and an extraction region. Gas and microwaves at 10.3 GHz are fed into the first stage to form a high pressure ECR discharge which produces a dense cold plasma. High field launch of the microwaves is needed to insure that they propagate to the ECR region. The plasma is guided by the solenoidal magnetic field into the second stage where it is trapped in a magnetic mirror and the electrons are heated by 6.4 GHz microwaves. A SmCo5 sextupole in the second stage creates a minimum-B magnetic field configuration to stabilize the hot plasma against MHD modes. A large amount of differential pumping between the two stages keeps the neutral pressure low in the second stage. The low neutral pressure and energetic electrons of the
FIRST STAGE
10.3 GHZ
64 GHZ MU
SECOND STAGE
COILS SEXTUPOLE
ECR ZONE PULLER
PUMP
PUMP
0 25 50 CM
Figure 1-1: Elevation view of the ECR ion source at Lawrence Berkeley Laboratory.
second stage produce a high charge state plasma. The ion end loss from this plasma is then extracted into the beam line through the puller. Typical extraction voltages are 10-20 kV.
1.3
Ion confinement in a hot electron plasma
Charged particles are confined in a magnetic mirror due to conservation of their magnetic moment:
1 MV2
/ mv2
S=2B
(1.1)Ignoring the effect of electrostatic fields for now, a charged particle moving into a region of increasing magnetic field parallel to the field line direction will be reflected provided that AB, > e, where Bm is the magnetic field maxima and E is the total particle energy. Thus, there is a loss region in the particle's velocity space, with the loss cone angle given by
9=sin (1.2)
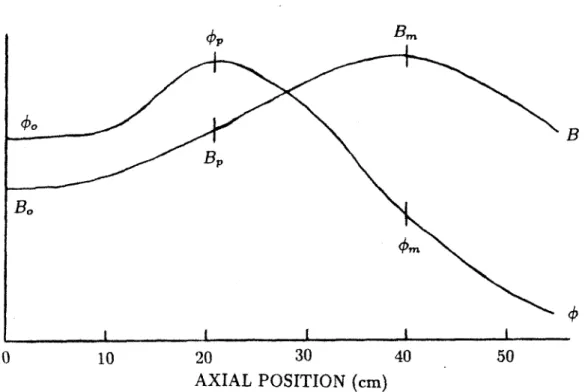
For a classical mirror cell, the time it takes to knock a particle into the loss cone is on the order of its collision time. If the electrons and ions have approximately the same temperature, then the electrons will scatter out of the mirror much faster than the ions by virtue of their lighter mass. Thus, the plasma develops a positive potential which traps the electrons and expels the ions. The magnitude of the potential is determined by the need to balance the loss of positive and negative charge and therefore is called the ambipolar potential. The regions of confinement in velocity space for ions and electrons are shown in Fig. 1-2.
A positive ambipolar potential normally develops because electrons scatter into the loss cone faster than ions. If ions scatter into the loss cone faster because
Ti
<
T me/mi, then a negative ambipolar potential will develop to trap ions. A combination of these two situations occurs in ECRH mirror plasmas since the electron distribution splits into two components: a magnetically confined "hot" pop-ulation and an electrostatically confined "cold" poppop-ulation. The hot electrons will be mainly trapped in the bottom of the magnetic well due to their temperature anisotropy (Bj > Ell) caused by the ECRH. The plasma potential is overall positive but dips in the region of the hot electrons creating the axial potential distribution shown in Fig. 1-3 [Baldwin, 1980]. The potential dip forms because the hot electrons require ions for charge neutralization, but the hot electrons do not contribute signif-icantly to the ionization source. Thus, near the plasma center the hot electrons are magnetically confined and the ions are electrostatically confined by the potential dip Ai = Op-,-.. Near the mirror throat the ions are magnetically confined and the cold electrons are electrostatically confined by the ambipolar potential AO= - 0".1.4
Previous work
Most of the experimental data to date for ECR ion sources consists of extracted ion currents. However, limited electron density and temperature data is available. Geller (1976) measured the electron density and temperature on SUPERMAFIOS using an interferometer and diamagnetic loop, and found I x 10"cm3 < n, < 3 x 10"cm3
a) IONS
I
V
C
Ambipolar
(V
1
) crit
hol
/
.1/
I
Loss
Cone
-v1,
(b)
ELECTRONS
lVi
Magnetically Confined
statical
\onf
ine...
V1I
1/2
Figure 1-2: Regions of confinement in velocity space for (a) ions and (b) electrons. Dashed curves show purely magnetic confinement while solid curves indicate the loss boundary modification by the ambipolar potential.
., BB
B
AB,
I I I I 0 10 20 30 40 50 AXIAL POSITION (cm)Figure 1-3: Axial potential and magnetic distribution for an ECRH mirror plasma.
and 7 keV < T, < 25 keV, depending upon ECRH power. Bernhardi and Wiesemann (1982) found a power law dependence for the electron distribution function measured on their simple ECRH mirror, with average electron energies of several hundred keV. Measurements on OCTOPUS using a Hall probe were consistent with a density of 3 x 10"cm-3 at an energy of 4 keV [Lyneis, 1986]. The measured hot electron density in INTEREM was also 3 x 10"cm-3 [Tamagawa, et al., 1976]. The ion temperature has also been measured by several groups. Meyer (1986) found that ion temperatures in the ORNL ECR were T/qj <; 5 eV. K6hler, et al., (1987) measured the ion temperature using a double hemispherical energy analyzer and found that T varied between 1 and 3 eV and showed a slight increase for the higher charged ions.
Tandem mirrors have measured parallel confinement times for hydrogen ions which agree with theoretical electrostatic and magnetic confinement times [Cho, et al., 1988]. Since tandem mirrors confine central cell ions parallel to the magnetic field lines using positive potential barriers developed in their plugs, their ion confinement physics is similar to that of ECR ion sources. Because tandem mirror data is for hydrogen plasmas, the scaling of parallel confinement time with ion charge state has not been
tested.
Several authors have developed models to determine the charge state distribu-tion (CSD) of ions in an ECR ion source. Bliman and Chan-Tung (1981) proposed an ionization equilibrium model for multiply-charged argon plasmas with a single population of hot electrons. The ion densities were calculated from the ion particle balance equations by balancing single step ionization by electrons, charge exchange with neutrals and loss of confinement. This feature is common to all subsequent ion models; the differences are in how the ion confinement time is treated. Bliman and Chan-Tung treated the plasma as if it was unmagnetized and considered diffusional losses using an ambipolar diffusion coefficient. This resulted in ion confinement times that were two orders of magnitude too short, therefore the magnitude was arbitrar-ily adjusted to improve the fitting while the scaling with charge state was retained. Also Bliman and Chan-Tung compared their modeled CSD of the ion density to the experimental CSD of the extracted ion current. These two CSD's are not the same, however, unless all charge states have the same confinement time.
Jongen (1980) improved upon the model of Bliman and Chan-Tung by recogniz-ing that t-heir ambipolar diffusion equation neglected magnetic confinement of the hot electrons. Jongen calculated the confinement time of ions from the diffusion equa-tion, neglecting mirror trapping of ions and ion radial transport. The ion trapping potential was found from the charge neutrality condition of electron and ion losses using the mirror confinement time of the hot electrons. This eliminated the need for a free parameter to improve the fitting. Jongen also calculated the CSD of the ion cur-rents from the ion densities and confinement times, allowing an accurate comparison between the model and experimental results.
The model by West (1982) improved upon the physics of Jongen in several ways. First, to better approximate the electron distribution function West included popu-lations of both cold and hot electrons. This changes the axial potential distribution considerably because the ambipolar potential, determined from the charge neutrality condition for electron and ion losses, was now positive. The ion trapping potential was determined by the need to balance creation and loss of ions (the global particle
balance equation). Instead of using the diffusional model of Jongen to calculate the ion confinement time, West used the Pastukhov and flow confinement times which take into account electrostatic and magnetic trapping. Ion radial transport was again neglected. With the addition of cold electrons, radiative recombination was included in the ion particle balance equations.
The limitations of these models fall into two categories: atomic physics and plasma physics. The atomic physics can be improved by including multiple step ionization and charge exchange, and dielectronic recombination. Better values for the single-step ionization cross-sections are also needed, especially for high charge state ions. This thesis does not attempt to improve the atomic physics of the model, but it does attempt to improve the plasma physics. Although West calculated the ion confinement time self consistently, he did not derive an explicit relation showing how the ion confinement time relates to the other plasma parameters. Previous models also neglected ion radial transport, which is included in this thesis since it is significant for Constance B. For parallel ion confinement, this thesis connects the Pastukhov-flow confinement of West (valid for low charge states) with the spatial diffusion confinement of Jongen (valid for high charge states).
1.5
Organization
This thesis is divided into five chapters. Chapter 1 gives an introduction to ECR ion sources and motivates this thesis work. The Constance B experiment and diagnostics are described in Chapter 2 along with an explanation of the experimental method. Chapter 3 develops a theoretical model for the ion densities, end loss fluxes and confinement times. In addition, electron confinement and particle and power balance is covered. The experimental results for both ions and electrons are presented in Chapter 4. Also the measured ion densities, end loss fluxes and confinement times are compared to the ion model for cases with and without minority ICRH. Finally, Chapter 5 summarizes the experimental and theoretical results of this thesis and applies them to ECR ion source issues.
Chapter 2
The Constance B Experiment
This chapter describes the Constance B mirror experiment, including magnetic ge-ometry, plasma heating system, data acquisition, principle diagnostics and plasma parameter control. Constance B is a single cell quadrupole mirror in which hot elec-tron plasmas are created and maintained with elecelec-tron cycloelec-tron resonance heating. The Constance B experiment started operation in October 1983 and is a continuation of the Constance I and Constance II magnetic mirror programs at MIT. The primary objective of the Constance program has been to examine the basic physics issues of ECRH plasmas in a minimum-B magnetic geometry in support of the tandem mirror fusion program. Previous subjects of doctoral research on Constance B were electron microinstabilities [Garner, 1986], electron velocity-space diffusion [Hokin, 1987], hot electron equilibrium and stability [Chen, 1988] and ion radial transport [Goodman, 1989]. An extensive description of the Constance B experiment and results is given by Smatlak, et al., (1986).
2.1
Basic systems
2.1.1
magnetic field
The Constance B magnetic field is produced by a single copper magnet shaped like the seam of a baseball (see Fig. 2-1). It is located outside the vacuum chamber and
Figure 2-1: The Constance B magnet is wound in the shape of the seam of a baseball. The shape of the confined plasma is also shown.
is electrically isolated from the rest of the machine. During operation it consumes about 2 MW of electric power. The maximum flow rate of cooling water through the conductor limits the magnet pulse length to under 10 seconds and the pulse rate to
12 per hour. The maximum midplane magnetic-field strength is 3.8 kG.
The magnetic field lines and mod-B contours for the baseball magnet in the y = 0 plane are shown in Fig. 2-2. The magnetic field is minimum-B, has quadrupole symmetry and elliptical flux surfaces (the flux surfaces at the midplane are nearly circular, however). The mirror ratio on axis is 1.87 and the distance between mirror peaks is 80 cm. Both the mirror ratio and the distance between mirror peaks decrease off axis. The electron cyclotron resonance lies along a closed mod-B surface shaped like an egg.
2.1.2
vacuum system
The vacuum system consists of the vacuum chamber, pumping system and the gas control and monitoring system. The 5000 liter aluminum vacuum chamber consists
1.2
1.4
1.6 1.8
t0cm
Figure 2-2: The Constance B magnetic field lines (solid lines) and mod-B contours (dotted lines) are shown. The mirror ratio for each mod-B contour is given.
of three sections and is specifically designed for the magnetic field geometry of the baseball magnet (see Fig. 2-3). The central chamber is made of two welded pieces which fit within the baseball magnet and contains the entire magnetic well. The plasma is accessible for diagnostic purposes from all sides. Plasma that escapes the magnetic well flows along magnetic field lines into one of two fan tanks located on either side of the central chamber. The fan tanks are rotated 90 degrees with respect to each other and are designed to accommodate the fanning of the quadrupole magnetic field. These large tanks minimize the electron cooling that results when secondary electrons from the walls stream back along field lines. This is in contrast to early INTEREM results where line tying to the nearby vacuum chamber end wall was important [Haste, et al., 1968].
The vacuum is maintained by three separate pumping systems. A 250 1/s turbo-molecular pump (Airco 514) is located in the south fan tank and operates at pressures below 60 mTorr. A 1500 1/s cryogenic LHe pump (Leybold-Heraeus RPK-1500S2) is located in the north fan tank and is used at pressures below 2 x 10~5Torr. Two
MIN B CELL FAN TANK BASEBALL MAGNET
o
06
o
0 5ftFigure 2-3: The Constance B vacuum chamber consists of a central chamber and two fan tanks. The fan tanks are rotated 90 degrees with respect to each other.
resistive titanium getters are located in each fan tank where the large surface area of the wall pumps reactive gasses such as hydrogen, nitrogen and oxygen. The machine base pressure is normally 1-2 x 10-Torr.
The machine pressure is monitored by a fast Ratiomatic ionization gauge (Varian) located on top of the central chamber. The ionization gauge is magnetically shielded. Since the gauge is calibrated for nitrogen, the relative ionization gauge sensitivity
(S/SN)
for various gasses is given in Table 2.1. To produce a plasma shot, theTable 2.1: Relative ionization gauge sensitivity (compared to nitrogen).
Ga
S/SN Hydrogen 0.42 Helium 0.14 Oxygen 1.00 Neon 0.23 Argon 1.20 Krypton 1.70 Xenon 3.00 FAN TANKworking gas is puffed into the machine through a piezo-electric gas valve located at the bottom of the central chamber after the magnetic field has been applied but before the ECRH pulse.
2.1.3
ECR heating system
The Constance B plasma is created and maintained with electron cyclotron resonance heating. Microwaves are produced by a Gunn diode and amplified by a klystron (Varian VA-911), which generates up to 5 kW of 10.5 GHz radiation with a bandwidth of 1 MHz. The forward and reflected powers are measured with thermistors connected to the output of the klystron by 40 dB directional couplers. XL band waveguide is used to direct the microwaves from the klystron to the central vacuum chamber. A
17 dB horn launches the microwaves perpendicular to the magnetic axis approximately 40 cm above the axis and 10 cm south of the midplane. The waves are primarily in X-mode polarization, which is accessible to the plasma center since it is launched from high magnetic field.
The density limit to X-mode accessibility occurs when the left hand cutoff fre-quency equals the cyclotron frefre-quency, or w, = V/2wc. Thus, X-mode launch has twice the density limit of 0-mode launch. Previous experiments on Constance B have found that 0-mode absorption by cold electrons is less than one-tenth that of X-mode absorption [Hokin, 1987], in agreement with slab model calculations. Since the vacuum chamber acts like a high Q microwave cavity
(Q
- 10, 000), strong cavityheating effects (about one-third of the total amount) have been observed.
2.1.4
ICR heating system
Ion cyclotron resonance heating (ICRH) of minority ions in the plasma is used to alter the charge state distribution of the plasma end loss. A double half-turn antenna centered on the midplane launches the low frequency rf waves. Ground straps parallel to the magnetic axis add a parallel electric field to improve ion heating. The antenna diameter is 35.6 cm, with a typical plasma diameter being 20 cm. Since the plasma
Cl
- antennia
Figure 2-4: Antenna matching network for ICRH experiments.
volume is small (several liters), ion heating does not occur through wave propagation and absorption. Instead, the near fields of the antenna directly interact with the ions at the ICR layer. The situation is similar to that of ICRH in the Phaedrus tandem mirror plugs [Smith, 1980].
The ICRH transmitter consists of a synthesizer/function generator (HP 3325A) which feeds into a rf power pre-amp (ENI 2100L) and then into a high power rf amplifier using an Eimac 4CW100,000E tube. The amplifier produces square output pulses 150 ms long at 1.40 MHz, with power levels up to 10 kW. A directional coupler measures the forward and reflected power to the antenna matchbox. The ratio of forward to reflected power is typically 4:1. The antenna matching network is shown in Fig. 2-4. There are two variable capacitors: the first (C1) matches the antenna
network to the 50 Q transmission line and the second (C2) forms a LC resonant loop
2.1.5
experimental control
There are three 'knobs' available to the experimenter to vary the plasma conditions for a given working gas: the ECRH power, gas pressure and magnetic field strength. For minority ion heating experiments, the ICRH power can also be varied. The ECRH power strongly affects the plasma density, while the gas pressure strongly affects the plasma confinement time. An industrial process controller (Gould 484) is used to control the timing sequences of the experiment and the magnetic field strength. Various safety interlocks are also connected to the process controller.
For a typical shot (see Fig. 2-5), the magnetic field is first ramped up to a pre-set value. The gas puff valve is also opened at this time to fill the machine to the desired background pressure. When the magnetic field is stabilized, a trigger is sent to the CAMAC data aquisition system. This time is labeled as t = 0 for all the experimental data. The ECR heating system is turned on at t = 0.1 s to break down the gas and form a plasma. The plasma reaches steady state in a few hundred milliseconds. The ICRH pulse is controlled by a CAMAC timer module (Jorway 221/222). The gas puff and ECRH are turned off at t = 1.8 s and the plasma is allowed to decay. The shot ends at t = 2.0 s when the magnet is ramped down.
2.1.6
data acquisition
A CAMAC-based data acquisition system (LeCroy) is used in the Constance B exper-iment in conjunction with a VAX 11/750 computer (Digital Equipment Corporation). It uses the VAX/VMS data aquisition software package MDS [Fredian and Stiller-man, 1986] to set up and control the data system and to process the signals. Data processing occurs between shots while the magnet is cooling down.
A variety of waveform digitizers are used. Most of the data, such as the ionization gauge pressure and diamagnetic loop voltage, is sampled at 2 kHz over two seconds by a LeCroy 8212 digitizer. For the microwave interferometer, a phase digitizer (Jorway 1808) is used, and there are PHA modules (Lecroy 3512/3587/3588) for obtaining time resolved X-ray pulse-height spectra. The ion time-of-flight analyzer,
charge--
-
-0.0
.
.8
.2
16h2.
0.0
.4
.8
1.2
1.6
2.0
Time (s)
Figure 2-5: A typical shot for the Constance B mirror experiment.
4-cc
LUJ0
4
=
2-a:
(j0
c 0-44
C0
0
8
U"
4
C0
2
1
(-:3 4) 0- f IJ
|
coupled-device camera and spectrometers all require special CAMAC modules for data acquisition.
2.2
Diagnostics and experimental method
2.2.1
end loss analyzer
A gridded end-loss analyzer' (ELA) is located in the south fan tank. It can be used like an ELA to measure the maximum plasma potential and average ion temperature of the plasma, or like a Faraday cup to measure the ion and electron end-loss currents. The ELA has a one-eighth inch diameter entrance aperture followed by three grids and a collector. The outermost grid is grounded. The middle grid (ion repeller) is biased to repel ions with energies below its potential. The innermost grid (electron repeller) is biased to repel electrons with energies below its potential. The electron repeller grid also serves to suppress secondary electron emission from the collector since it is usually biased to -2000 V. In cases where the electron repeller grid is grounded, secondary electron emission from the collector is suppressed by biasing the collector to
+180
V using a battery.The ELA is located near the magnetic axis, 180.5 cm from the midplane. The magnetic field lines are parallel to the axis of the ELA and the magnetic flux surfaces are highly elliptical. One-dimensional radial scans of the plasma, end loss can be made using a pair of deflecting magnets. The deflecting magnets move the mirror fan (in its "thin" direction) up and down relative to the position of the ELA. The amount of movement by the mirror fan for a given amount of current in the deflecting magnets is determined by the EFFI code [Sackett, 19783, which calculates the magnetic field generated by the baseball and deflecting magnets.
When operated as a Faraday cup, the ELA can measure the end loss currents for the ions and hot and cold electrons. The current collected by the ELA is passed through a resistor (R) and the resulting voltage drop (V) is related to the current
'This end loss analyzer was designed by Robert Klinkowstein for the TARA tandem mirror experiment.
density of particles in the loss cone at the midplane by 2 B,, V
JA =
(2.1)
where A is the area of the entrance aperture, T (= 0.26) is the grid transmission coef-ficient, B0 is the midplane magnetic field strength, B, is the magnetic field strength at the ELA and the factor of two accounts for the fact that end loss on only one end of the machine is measured. Since hot electrons are collected along with ions, the hot electron current density must be subtracted to find the true ion current density.
The ELA can also measure the maximum plasma potential (,) and average ion end-loss temperature (T) of the plasma by sweeping the ion repeller grid through a range of positive voltages while biasing the electron repeller grid to -2000 V. The ions are expelled from the plasma with typical energy e = qik,
+
T. As long as thevoltage on the ion repeller grid (Vr,) is less than qkp, all the ions are collected. When the repeller voltage exceeds O,, ions with energy less than qiVV4 are not collected and the ion current measured by the ELA will start to drop. The knee in the curve gives the maximum plasma potential and the rate of decline is inversely proportional to
the ion temperature.
The shape of the ELA characteristic can be determined quantitatively in the limit that the ions are flow confined. Flow confinement assumes that the ions are sufficiently collisional so that their distribution function is Maxwellian, even in the loss cone. However, it also assumes that they are not so collisional that the ion's energy (e) and magnetic moment (M) are not conserved near the ion's turning point. Flow confinement is a valid approximation in Constance B since the ion mean-free-path is on the order of the plasma length. For a square well magnetic field where the maximum confining potential occurs at the mirror peak, the current density of ions in the loss cone with energies greater than E = qiV,, is given by
12,r fo {-qip)1BpV
Bof (e)
F
1jj(E) =
JEde
j
W
2dp
mE (e - qik0 - Bay)11
B.
_2;
-qj(O, - 0.)
E - qjd
- (E - qidp)
= n;--- exp[ 1+ exp.2)
B
a rme Ti TiTi
are the potential and magnetic field at the mirror peak and ni is the ion density at the midplane. The lower energy bound for ions in the loss cone is E = qi, because ions with energy less than this cannot escape from the mirror. This equation is of importance for two reasons. First, it can be fitted to the ELA characteristic to determine the maximum plasma potential and ion temperature. Second, it can be used to determine the theoretical ion confinement time in the flow limit, as shown in section 3.2.1. An important feature of Eqn. 2.2 is that the ion-confining potential dip (Op - 0,) cannot be determined from the shape of the ELA characteristic, but only from its height.
Error in the end-loss current density measurement is due primarily to error in determining the AT product in Eqn. 2.1 (10%) and shot-to-shot variations in Con-stance B (5%). The error in the plasma potential determined from the knee in the ELA characteristic is about 10%. The ion temperature measured by the ELA is typ-ically overestimated by a factor of two (compared to other diagnostics) due to the large RC time constant of the ELA (necessary to obtain an adequate signal-to-noise ratio) and therefore is not used.
2.2.2
ion time-of-flight analyzer
In order to determine the charge state distribution of the ion end-loss flux, a time-of-flight (TOF) analyzer was designed and constructed for this thesis [Petty, et al., 1988]. Ion temperatures can also be determined for each ion species. An ion leaving the plasma as end loss has a total energy equal to its kinetic energy (E) plus its potential energy (qi4p). If the ion is then accelerated through an externally applied potential (0b), the time required for it to transverse a distance L is
t = L (2.3)
2{q
1(4,~ +
q'J)+ E1.
The condition
E
<
qi(Op + qb) is always well satisfied, thereforet ~~ L± . (2.4)
V2% ((k, + Ob)*
Thus, the time-of-flight of an ion is proportional to the square root of its mass-to-charge ratio.
The ion flux (ri) is proportional to the height of the output pulse for that ion species from the TOF analyzer. The absolute values of the ion fluxes are determined by scaling them according to the total ion (electric) current-density measured by the
ELA:
Eqjrjj = J11j.
(2.5)
The TOF analyzer is located in the south fan tank near the magnetic axis and next to the ELA. One dimensional radial scans of the plasma end loss can be made using the deflecting magnets, as described in the previous section.
The temperature of each ion species can also be determined from the TOF data. The energy dependence of each ion species' flux can be found from the rise time of its pulse using Eqn. 2.3:
m;L
22t2 -4ji. (2.6)
This data is then fit to Eqn. 2.2 to determine the plasma potential and ion tem-perature. The finite rise time of the analyzer system (15 ns) leads to a minimum measurable ion temperature, which is given by
n- [Zi;P + .0b)]3
Ti(eV) = 1.12 x 10-_ , (2.7)
where zi is the ion charge state and Ai is the ion mass in amu. Thus, the higher the charge state the more difficult the measurement. In practice only ions up to zi = 5 are analyzed.
There are four sections to the time-of-flight analyzer: (1) the accelerating/focusing lens, (2) the deflection plates, (3) the time-of-flight length and (4) the ion detector. A drawing of the the first two sections is shown in Fig. 2-6. For simplicity the analyzer is designed to be a line-of-sight device. If potential is measured relative to the plasma, then the entrance aperture is negative by the plasma potential (0,). The second aperture is biased at a high negative voltage (0b) to accelerate the ions to 2-3 kV. It is important that this bias voltage be much greater than the ion temperature, otherwise the TOF will depend more on temperature than on m/q1. These two accelerating apertures make up a convergent lens with a focal length approximately equal to three
Accel
-erating Eintel Deflection Exit lens lens plates oper
b
Posmol[ To ion detector
S1.2.7N4
6.4endoss l
T
.4m owy1316.91313 60 014 49 0 20 " 63.5
ture
Figure 2-6: Diagram of accelerating/focusing lens, collimators and deflection plates. All dimensions are in mm.
times the distance between them [Harting and Read, 1976). An einzel lens is placed after the accelerating lens in order to refocus the beam and therefore increase the amount of current reaching the ion detector. The einzel lens does not change the ion's energy because the entrance and exit apertures are at the same potential. The middle aperture is biased with a second power supply at a less negative potential
(4).
The ions exit the accelerating/focusing lens with paths parallel to the axis when the sum of the midfocal lengths of the two lenses equals the distance between their reference planes. The current at the ion detector is typically increased by a factor of fifteen when the einzel lens is used.After leaving the accelerating/focusing lens, the ion beam is collimated and passes between two electrostatic deflection plates. Normally, one plate is biased relative to the other, creating an electric field which deflects the ions. The angle of deflection (0) is given by
tan 0
= 0d, (2.8)2d(el
+ tn)Pulse
in
l00Q
.1LF
.OIMF
Vd
(mylar) (ceramic)
To
dRo
dftection
plates
HV
Isolation
transf ormer
Figure 2-7: Fast switching circuit for deflection plates.
(=
100 V) is the potential difference between the plates. Note that the angle of deflection is independent of ion mass or charge. There is an exit aperture located 63.5 mm .past the deflection plates which deflected ions cannot pass. In order to send a burst of ions through the exit aperture to the ion detector, the deflection plate voltage is pulsed to zero by the circuit shown in Fig. 2-7. Typical pulse lengths are 100-300 ns, with 7 ns rise and fall times. This fast rise time is necessary in order to determine the ion temperature from the analyzer output pulse. Because of fringing electric fields, the minimum required pulse length is actually twice as long as it takes the slowest ion to travel the length of the deflection plates (a too short pulse length will result in the lowest charge states being cut off).After passing through the exit aperture, the ions travel down a long section of tubing. This serves as the time-of-flight length. In general, the longer the tube, the better the mi/qi resolution and the more accurate the ion temperature measurement. In this case, the maximum length was set by space limitations to be 1.20 m. This length gives typical time-of-flights of several microseconds.
At the end of the flight, an electron multiplier serves as the ion detector. A
110 +
-Vacumetrics AEM-1000 multiplier is used which has a rise time of 3 ns and is small enough to fit inside a standard 1.375 inch diameter tube. The multiplier gain is 5 x 10' at 2 kV. The electron multiplier supply voltage is the same bias voltage used to accelerate the ions. Because large peak currents are drawn from the multiplier (typically 100 pA), a 300 pF vacuum compatible, glass capacitor is placed across the resistor from the last dynode to ground. The multiplier output is amplified by an EG&G PARC 115 wideband pre-amp with a gain of ten. All signal cables are terminated in 50 Q. The total rise time of the analyzer system is determined from individual counts to be 15 ns.
The magnetic field lines from the Constance B baseball magnet are parallel to the axis of the TOF analyzer, with a typical field strength of 90 G at the entrance. The entire length of the analyzer is magnetically shielded to ensure that there are no ion gyroradius effects and to prevent gain loss of the electron multiplier. The magnetic shielding doubles as a high voltage shield since the analyzer floats at the bias voltage. The TOF analyzer can produce an ion spectrum every 20 ps. Since the usual time scale of interest is several hundred milliseconds, data averaging is performed to improve the signal-to-noise ratio. On Constance B, the major source of noise is from hot electron end loss. Electrons with kinetic energy greater than about 40 keV will enter the analyzer and pass by the deflection plates unaffected, therefore reaching the electron multiplier. Summing many spectra averages these counts out to an offset current. Because the TOF analyzer is a line-of-sight instrument, a second source of noise is from photons which can pass through the apertures and strike the detector.
The primary method of signal averaging is to digitize the electron multiplier out-put at 100 MHz and then sum the spectra using a hardware signal averager. This setup consists of a Transiac 2001s transient digitizer linked to a Transiac 4001 signal averaging memory. Spectra 20.48 ps long can be summed at a rate of 1 kHz, with summation rate being inversely proportional to memory size. Thus, averaging over a period of one second gives a typical signal-to-noise ratio improvement of 32. A TOF spectrum for an argon plasma is shown in Fig. 2-8, demonstrating the resolution pos-sible between high charge state ions. Plasma impurities are also evident, principally