HAL Id: hal-03183931
https://hal.archives-ouvertes.fr/hal-03183931
Submitted on 29 Mar 2021
HAL is a multi-disciplinary open access
archive for the deposit and dissemination of
sci-entific research documents, whether they are
pub-lished or not. The documents may come from
teaching and research institutions in France or
abroad, or from public or private research centers.
L’archive ouverte pluridisciplinaire HAL, est
destinée au dépôt et à la diffusion de documents
scientifiques de niveau recherche, publiés ou non,
émanant des établissements d’enseignement et de
recherche français ou étrangers, des laboratoires
publics ou privés.
Fairness of Scoring in Online Job Marketplaces
Sihem Amer-Yahia, Shady Elbassuoni, Ahmad Ghizzawi
To cite this version:
Sihem Amer-Yahia, Shady Elbassuoni, Ahmad Ghizzawi. Fairness of Scoring in Online Job
Mar-ketplaces. ACM/IMS Transactions on Data Science, ACM, 2020, 1 (4), pp.1-30. �10.1145/3402883�.
�hal-03183931�
AUTHORS’ VERSION
SHADY ELBASSUONI,
Computer Science Department, American University of BeirutSIHEM AMER-YAHIA,
CNRS, University of Grenoble Alpes, FranceAHMAD GHIZZAWI,
Computer Science Department, American University of BeirutWe study fairness of scoring in online job marketplaces. We focus on group fairness and aim to algorithmically explore how a scoring function, through which individuals are ranked for jobs, treats different demographic groups. Previous work on group-level fairness has focused on the case where groups are pre-defined or where they are defined using a single protected attribute (e.g., whites vs blacks or males vs females). In this manuscript, we argue for the need to examine fairness for groups of people defined with any combination of protected attributes (the-so called subgroup fairness). Existing work also assumes the availability of worker’s data (i.e., data transparency) and the scoring function (i.e., process transparency). We relax that assumption in this work and run user studies to assess the effect of different data and process transparency settings on the ability to assess fairness.
To quantify the fairness of a scoring of a group of individuals, we formulate an optimization problem to find a partitioning of those individuals on their protected attributes that exhibits the highest unfairness with respect to the scoring function. The scoring function yields one histogram of score distributions per partition and we rely on Earth Mover’s Distance, a measure that is commonly used to compare histograms, to quantify unfairness. Since the number of ways to partition individuals is exponential in the number of their protected attributes, we propose a heuristic algorithm to navigate the space of all possible partitionings to identify the one with the highest unfairness. We evaluate our algorithm using a simulation of a crowdsourcing platform and show that it can effectively quantify unfairness of various scoring functions. We additionally run experiments to assess the applicability of our approach in other less-transparent data and process settings. Finally, we demonstrate the effectiveness of our approach in assessing fairness of scoring in a real dataset crawled from the online job marketplace TaskRabbit.
Additional Key Words and Phrases: algorithmic fairness, scoring, discrimination, demographic disparity, transparency, group fairness, virtual marketplaces
ACM Reference Format:
Shady Elbassuoni, Sihem Amer-Yahia, and Ahmad Ghizzawi . 2021. Fairness of Scoring in Online Job Market-places AUTHORS’ VERSION. 1, 1 (March 2021), 29 pages. https://doi.org/10.1145/nnnnnnn.nnnnnnn
1 INTRODUCTION
Online job marketplaces are gaining popularity as mediums to hire people to perform certain jobs. These marketplaces include freelancing platforms such as Qapa and MisterTemp’ in France, and TaskRabbit and Fiverr in the USA. On these platforms, individuals can find temporary jobs in the physical world (e.g., looking for a plumber), or in the form of virtual “micro-gigs” such as “help
Authors’ addresses: Shady Elbassuoni Computer Science Department, American University of Beirut, se58@aub.edu.lb; Sihem Amer-Yahia CNRS, University of Grenoble Alpes, France, sihem.amer- yahia@univ- grenoble- alpes.fr; Ahmad Ghizzawi Computer Science Department, American University of Beirut, ahg05@mail.aub.edu.
Permission to make digital or hard copies of all or part of this work for personal or classroom use is granted without fee provided that copies are not made or distributed for profit or commercial advantage and that copies bear this notice and the full citation on the first page. Copyrights for components of this work owned by others than ACM must be honored. Abstracting with credit is permitted. To copy otherwise, or republish, to post on servers or to redistribute to lists, requires prior specific permission and /or a fee. Request permissions from permissions@acm.org.
© 2021 Association for Computing Machinery. XXXX-XXXX/2021/3-ART $15.00
with HTML, JavaScript, CSS, and JQuery”. Crowdsourcing platforms are also a very popular type of online job marketplaces nowadays. These platforms are fully virtual: workers are hired online and tasks are also completed online. Examples of crowdsourcing platforms are FouleFactory, and Prolific Academic in Europe, and Amazon Mechanical Turk and Figure Eight in the USA.
On virtual marketplaces, either people are ranked or jobs. For instance, on Amazon Mechanical Turk, a worker sees a ranked lists of micro-tasks while on TaskRabbit, an employer sees a ranked list of potential employees. In this work, we are interested in studying fairness in the case wherepeople are ranked. A person who needs to hire someone for a job on these platforms can formulate a query and is shown a ranked list of people based on some scoring function. The resulting ranking naturally poses the question of fairness. Algorithmic fairness has recently received great attention from the data mining, information retrieval and machine learning communities (See for instance [1–4]). The most common definition of fairness was introduced in [5, 6] asdemographic disparity, that is the unfair treatment of a person based onbelonging to a certain group of people. Groups are defined using protected attributes such as gender, age, ethnicity or location. For instance, in the French Criminal Law (Article 225-1), 23 such attributes are listed as discriminatory.1We carry these definitions in our work and define unfairness of scoring in online marketplaces as the unequal treatment of people by a scoring process based on their protected attributes. This definition is inline with what is also commonly referred to asgroup unfairness [7].
Fairness Model. Our goal in this manuscript is quantify unfairness of a scoring of individuals in online job marketplaces. We cast our problem into a mathematical formulation based on the one defined in [7] for fairness in decision making in general. In this formulation, the scoring process takes place through three metric spaces:the construct space, which contains necessary but unmeasurable attributes to score individuals such as their grit, punctuality and experience,the observed space, which is a set of measurable attributes that approximate those in the construct space such as ratings, number of past jobs and qualification scores, andthe decision space, which contains the outcome of the scoring process. Our goal is then to quantify unfairness in the decision space, which occurs as a consequence ofstructural bias, i.e., the unequal treatment of groups of people based on their protected attributes by the observation process that maps between the construct space and the observed space. In some cases, discriminatory scoring might be desired, which is known as positive discrimination [8] where disadvantaged individuals are favored. Nonetheless, unwarranted unfairness can occur within subgroups. For example, consider a requester on a crowdsourcing platform who is looking forfemale annotators only. This is an example of positive discrimination. The scoring function can however still be unfair with respect to subgroups of females such as older females or black ones. Our framework thus aims to identify unfairness at any subgroup level. However, it stops short of fixing any unveiled unfairness, whether positive or negative, and it is up to the user, the job owner or the platform developer, to decide on the right subsequent action.
Most previous work on group-level fairness have either assumed that groups are pre-defined [4] or that they are defined using a single protected attribute (e.g., whites vs blacks or males vs females) [9]. As mentioned above, in this manuscript we consider groups of individuals defined with any combination of protected attributes (the so-calledsubgroup fairness [3]). The scoring function through which individuals are ranked yields one histogram per demographic group as score distributions. We use the the Earth Mover’s Distance (EMD) [10], a measure that is commonly used to compare histograms, to quantify distances between groups. The intuition behind this is that if the distribution of scores is significantly different between different groups, the scoring process does not treat the individuals in these groups equally. For instance, consider two groups
1
https://www.legifrance.gouv.fr/affichCodeArticle.do?cidTexte=LEGITEXT000006070719&idArticle= LEGIARTI000006417828
only, namely young males and young females. Unfairness can be computed as the EMD between the score distributions of these two groups. Note that these groups are disjoint by definition and thus other metrics such as Kendall Tau or Pearson correlation are not applicable. The choice of EMD is also inspired by the mathematical model in [7] where group unfairness is measured using the Wasserstein distance, which is another name for EMD.
To motivate the significance of subgroup fairness, consider the following scenario where a job owner is looking for an event planner in San Francisco on an online marketplace. Assume there are only two binary protected attributes: age = {young, old} and gender = {male, female}. Also assume that the process used to score the individuals on the marketplace includes only males regardless of their age group andyoung females in the top-10 ranking. If one were to examine either protected attribute alone, the scoring function might seem fair since both young and old individuals appear in the top-10 ranking and both males and females appear in the top-10 as well. However, it is only by looking at combinations of these attributes that one can truly unveil that the scoring process is unfair with respect to the subgroupolder females.
Motivating Examples. To motivate our work, consider the following crowdsourcing scenario where a requester has posted a tweet generation task that requires good knowledge of English and the ability to follow task instructions. To be able to assign this task to workers on the crowdsourcing platform, the requester relies on a language test and the worker approval rate to compute a score for each worker that shows interest in the task. This score can then be used to rank those workers and the requester can pick the top-k ranked workers to finally perform the task. The requester can also use a threshold to assign the task to those workers whose scores surpass the threshold. Such scoring process can be unfair if it systematically disadvantages certain groups of workers based on their protected attributes. For instance, the language test can suffer from what is known as test bias [11]. Similarly, online ratings, such as approval rates in crowdsourcing platforms, are vulnerable to bias [12]. This might in turn cause the scoring function through which workers are ranked to be biased by systematically associating certain groups of workers, say women or older people or people from certain locations with lower scores compared to other comparable groups of workers.
As another example, consider a mounting job in New York City posted on a freelancing platform such as TaskRabbit. The job owner receives a ranked list of individuals on the platform for this job. Such ranking might be considered unfair if it is biased towards certain groups of people, say where white males are consistently ranked above black males or white females. This can commonly happen since such ranking might depend on the ratings of individuals and the number of their past jobs, both of which can perpetuate bias against certain groups of individuals.
Algorithm. Since we do not want to focus only on pre-defined groups, we must exhaust all possible ways of partitioning individuals on their protected attributes to quantify unfairness. We thus define an optimization problem as finding a partitioning of the decision space, i.e., individuals and their scores, that exhibits the highest average EMD between its partitions. Exhaustively enumerating all possible partitionings is exponential in the number of protected attributes. More precisely, given 𝑛 protected attributes, the number of possible partitionings on those attributes is equal to 2𝑛− 1. Even for small values of 𝑛, this can grow very fast. For instance, as mentioned above, the french criminal law defines 23 protected attributes, which yields 223− 1 = 8, 388, 607 possible ways of partitioning individuals on those 23 protected attributes.
Therefore, we propose a heuristic algorithm, EMDP, which stands for EMD partitioner. At each step, EMDP greedily splits individuals on the worst attribute, i.e., the one that results in the partitioning with the highest average EMD between score distributions. This local decision is akin to the one made in decision trees using gain functions [13]. The algorithm stops when there are
no further attributes left to split on or when the current partitioning of individuals exhibits more unfairness than it would if its partitions were split further.
Data and Process Transparencies. Our framework assumes the availability of individuals’ data (i.e., data transparency) and the scoring function (i.e., process transparency). To assess the validity of such assumptions in real-world online job marketplaces, we ran a series of user studies on Academic Prolific (https://prolific.ac/) to examine the relationship between transparency and fairness of scoring from the perspective of individuals being ranked for jobs. Our first two studies ondata transparency found that individuals do not object to exposing their protected attributes, such as their age and location, to job owners for the purpose of being ranked for jobs. They also prefer job owners to see theirobserved attributes such as their approval rate and language skills, because they believe the scoring process will be more accurate in light of that information. Our third study onprocess transparency found that when asked to choose between a transparent scoring process and an opaque but more fair one, most individuals preferred the transparent one. This last result confirms a previously established hypothesis in Economics [14] where it was shown that people are more accepting of transparent procedures that treat them “with respect and dignity”, making it easier to accept outcomes, even if they do not like those outcomes. In our last user study, human judges, that play the role of platform auditors, were asked to assess fairness under different transparency settings. We found that judges prefer data transparency over process transparency when assessing fairness. The intuitive explanation is that if individuals’ data and jobs they qualify for are made available to a judge (data transparency), she can better infer the process through which the individuals are ranked for those jobs, and assess its fairness.
Evaluation. Our user studies show that individuals believe that an approach to quantify un-fairness of scoring can operate more effectively if it has access to their protected and observed attributes, and that they are not sensitive about sharing such attributes if it results in a fairer scoring process. They also prefer the scoring process to be transparent, however they do not deem this crucial for quantifying unfairness. These findings motivated us to evaluate our approach in various transparency settings, the first of which is the case of transparent data/transparent process, where our framework is given access to individuals’ attributes and the scoring function. We also evaluate our approach in the case of transparent data/opaque process, where our framework is given access to individuals’ data and only the outcome of the scoring process. Finally, we also evaluate our approach in the case of opaque data/transparent process, where our approach is given access to k-anonymized individuals’ data and the full scoring process.
Our evaluation results on a database of workers simulated from Amazon Mechanical Turk show that our proposed approach can efficiently and effectively quantify unfairness in scoring of individuals. They also suggest that our approach is effective in quantifying unfairness regardless of the transparency setting. Naturally, it is most effective when it has access to as much information as possible. This is especially true regarding data transparency. Our approach is most successful in quantifying unfairness when it has access to workers’ protected attributes, regardless of whether the scoring process is transparent or opaque. This indeed coincides with our findings from the user studies, in which workers indicated being more successful in assessing fairness when they have access to individuals’ attributes, regardless of whether the process is transparent or not.
Finally, to assess the effectiveness of our approach in quantifying unfairness on real data, we run an experiment on a dataset crawled from the online freelancing platform TaskRabbit. Our findings suggest that the majority of jobs on such platform during the time of crawling suffered from systematic bias based on ethnicity followed by gender followed by the combination of both. This is inline with recent studies where such assessment was manually done [9]. Our findings also suggest that jobs related to moving, handyman and yard work exhibited the highest amount of
Table 1. Task examples and their respective Construct and Observed spaces
Task Construct spaceCS Observed spaceOS
Tweet generation Language level, General knowledge Language test, General knowledge test Audio transcription Language level, Ability to recognize spoken words Language test, Approval rate Text translation Language level Language test, Approval rate Image transcription Basic language level Language test, Approval rate Image description Written language level, Ability to follow instructions Language test, Approval rate
unfairness in scoring compared to event staffing and general cleaning. Additionally, we used our approach to identify the locations that exhibited the highest amount of unfairness in scoring in our crawled dataset, which happened to be San Antonio in Texas, Louisville in Kentucky, and Cleveland in Ohio.
Contributions. We summarize our contributions as follows:
(1) We cast the problem of fairness of scoring in online job marketplaces as an optimization problem to find the partitioning of individuals based on their protected attributes that exhibits the highest unfairness.
(2) We develop an efficient algorithm that solves our optimization problem and finds groups of individuals, a.k.a., partitions, described with any combination of their protected attributes. (3) We run user studies to examine the relationship between transparency and fairness of scoring
in online job marketplaces and report findings that align with previous theories.
(4) We run extensive experiments on simulated and real datasets that demonstrate the ability of our approach in quantifying unfairness of scoring in online job marketplaces under different transparency settings.
System. Our approach is implemented as an interactive system to explore fairness of scoring in online job marketplaces [15, 16]. Our system appeals to different users. It can be used byauditors, whose role is to monitor the fairness of scoring in a given marketplace. It can be used by ajob owner, who wants to study the behavior of a scoring function and its variants to understand their impact on the ranking of individuals, and choose the fairest one among them. Finally, it can be used bythe end-user, who is being ranked, to assess the fairness of jobs on different marketplaces and make an informed decision about which one to target.
Our framework is general as it can be used both to verify hypotheses (given as baselines) and to generate new ones (for which no ground truth exists). New hypotheses can serve as a basis for real-world campaigns where they can be tested.
Outline. The manuscript is organized as follows. In Section 2, we present our data model. In Section 3, we describe our algorithm for quantifying unfairness of scoring and in Section 4, we present our experimental results. Finally, in Section 5, we review related work and conclude and present future directions in Section 6.
2 DATA MODEL
To study fairness of scoring in online job marketplaces, we adopt the mathematical data model for fairness in decision making defined in [7]. In that model, given a set of individuals 𝑊 associated with a set of protected attributes 𝐴= {𝑎1, 𝑎2, ..., 𝑎𝑛}, the scoring process takes place through the
following three metric spaces over 𝑊 : • Construct Space: CS = (𝑊 , 𝑑𝑤)
to their qualifications for a job. This space contains necessary butunmeasurable attributes for scoring individuals. Table 1 shows example jobs (i.e., tasks) and their construct space in a crowdsourcing setting. For instance, for an audio transcription task,CS contains the language level of a worker.
• Observed Space: OS = ( ˆ𝑊 ,𝑑ˆ)
A metric space where𝑊 are entities generated from individuals in 𝑊 using an observationˆ process 𝑔 : 𝑊 → ˆ𝑊 and𝑑 is a distance between those entities. The observation process 𝑔ˆ serves as a proxy for the construct space and the observed space will thus contain a set of measurable attributes 𝐵= {𝑏1, 𝑏2, . . . , 𝑏𝑚} through which those in the construct space can be
inferred. For instance, the language level of a worker is inferred using a language test (see Table 1).
• Decision Space: DS = (𝑂, 𝑑𝑂)
A metric space where 𝑂 is a space of outcomes and 𝑑𝑂 is a metric defined on 𝑂 that results
from a mapping 𝑓 :𝑊ˆ → 𝑂, where 𝑓 is a scoring function that is used for scoring individuals in 𝑊 . The decision spaceDS usually contains the potential of an individual to perform a job computed as a real-valued score using 𝑓 . It could also simply contain a binary outcome: “an individual qualifies for a job” or “an individual does not qualify for a job”, if a threshold is applied to generate individual qualification decisions. It can also simply contain the rank of each individual for the job.
We can now define data and process transparencies as follows, where, unless otherwise stated, by process we mean the scoring process:
• Data Transparency is defined as the availability of individuals’ protected attributes 𝐴 = {𝑎1, 𝑎2, ..., 𝑎𝑛} and observed attributes 𝐵 = {𝑏1, 𝑏2, . . . , 𝑏𝑚}. By definition, the attributes in the
construct space,CS are unmeasurable and hence opaque.
• Process Transparency is defined as the availability of the scoring function 𝑓 that maps between the observed spaceOS and the decision space DS.
Our aim is to quantify unfairness in the decision spaceDS. We rely on the same common underlying assumption as in [7] in which individuals can be partitioned into groups, i.e., a collection of individuals that share a certain set of characteristics or protected attributes such as gender, race, or religion. The assumption is that in the construct space,CS, all groups look essentially the same. In other words, there are no innate differences between groups of individuals defined via those potentially discriminatory characteristics. Unfairness occurs in the decision space when the same groups are treated differently by the scoring process, i.e., the scoring function 𝑓 would favor certain individuals over others based on their group membership. This happens as a result ofstructural bias, when the construct space CS is not accurately represented by the observed space OS due to noise in the transformation between the two spaces.
For example, consider an audio transcription task in a crowdsourcing platform and assume that the construct space consists of the language level of the workers. Also, assume that workers are grouped based on age and gender into four groups: young males, old males, young females and old females. Our assumption is that all four groups have the same distribution of language levels. Now, assume that the observed space is represented using a language test to quantify the language level of workers. If that test suffers from structural bias, i.e., unequal treatment of the four groups, then unfairness might occur when the language test scores are used in scoring the workers for the task. To formulate fairness of scoring in online job marketplaces, we propose to identify the extent of unfairness that might occur given a set of individuals and a scoring function. To do this, we assume bothdata and process transparencies and we measure unfairness as the average distance between partitions of individuals in the decision space. Unlike previous work where partitions were defined
or known a priori (e.g., [9]), in this work we explore the space of all possible groups of individuals defined by a combination of their protected attributes. The goal becomes finding themost unfair partitioning of individuals under the scoring function 𝑓 . This can be viewed as a worst-case scenario, where we want to measure how differently 𝑓 treats groups under this worst-case partitioning of individuals. We cast this goal as an optimization problem as follows.
Definition 1 (Most Unfair Partitioning Problem). We are given a set of individuals 𝑊 , where each individual is associated with a set of protected attributes 𝐴 = {𝑎1, 𝑎2, ..., 𝑎𝑛} and observed
attributes 𝐵 = {𝑏1, 𝑏2, . . . , 𝑏𝑚}. The protected attributes are inherent properties of the individuals
such as gender, age, ethnicity, origin, etc. The observed attributes represent the qualifications of an individual for jobs and could include, for instance, the approval rate of the individual, a language test score and a mathematical test score in case of crowdsourcing or rating and number of past jobs and skills in case of freelancing. We are also given a scoring function 𝑓 : 𝑊 → [0, 1] through which the individuals are ranked for jobs. Our goal is to fully partition the individuals in 𝑊 into 𝑘 disjoint partitions 𝑃 = {𝑝1, 𝑝2, . . . , 𝑝𝑘} based on their protected attributes in 𝐴 using the following optimization
objective: argmax 𝑃 𝑢𝑛 𝑓 𝑎𝑖𝑟 𝑛𝑒𝑠𝑠(𝑃, 𝑓 ) subject to ∀𝑖, 𝑗 𝑝𝑖 Ù 𝑝𝑗 = 𝜙 𝑘 Ø 𝑖=1 𝑝𝑖 = 𝑊
We now define how to compute the amount of unfairness of a function 𝑓 for a partitioning 𝑃 , or 𝑢𝑛 𝑓 𝑎𝑖𝑟 𝑛𝑒𝑠𝑠(𝑃, 𝑓 ) in the above optimization problem.
Definition 2 (Earth Mover’s Distance Unfairness). Given a set of individuals 𝑊 , a full-disjoint partitioning of the individuals 𝑃 = {𝑝1, 𝑝2, . . . , 𝑝𝑘} and a scoring function 𝑓 , the amount of
unfairness of 𝑓 for the partitioning 𝑃 is measured as the average Earth Mover’s Distance (EMD) between the distribution of scores of individuals using 𝑓 in the different partitions in 𝑃 , which is computed as follows:
𝑢𝑛 𝑓 𝑎𝑖𝑟 𝑛𝑒𝑠𝑠(𝑃, 𝑓 ) = avg
𝑖, 𝑗
𝐸 𝑀 𝐷(ℎ(𝑝𝑖, 𝑓), ℎ(𝑝𝑗, 𝑓)) where ℎ(𝑝𝑖, 𝑓) is a histogram of the scores of individuals in 𝑝𝑖 using 𝑓 .
Note that another aggregation method other than average can be used in the above formulation. For instance, one could use maximum or minimum to obtain the partitioning with the maximum or minimum EMD between the distribution of scores of individuals in the different partitions.
Example. In Table 2, we display a toy example consisting of 10 workers in a crowdsourcing platform, their protected attributes 𝐴 and their observed attributes 𝐵. Consider a scoring function for tweet generation applied to this set of workers which is of the form:
𝑓 = 0.3 × 𝐿𝑎𝑛𝑔𝑢𝑎𝑔𝑒𝑇 𝑒𝑠𝑡 + 0.7 × 𝐴𝑝𝑝𝑟𝑜𝑣𝑎𝑙𝑅𝑎𝑡𝑒
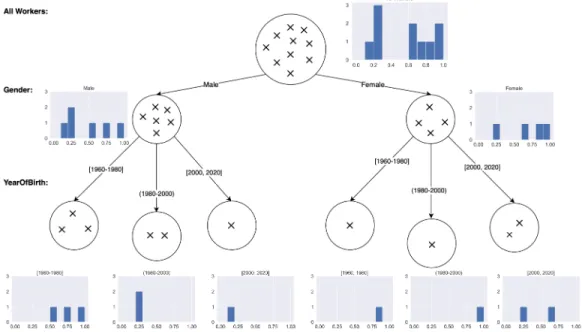
Figure 1 shows the partitioning of workers that results in the highest average pairwise EMD induced by the function 𝑓 . In our toy example, the optimum partitioning is the one resulting from splitting the workers based onGender first then YearOfBirth to get to the partitioning shown in the leaf nodes. To arrive to this partitioning, one must exhaust all possiblefull disjoint partitionings of workers based on any combination of their protected attributes 𝐴 and for each possible partitioning
Table 2. Toy example consisting of 10 workers and a scoring function for tweet generation
Worker Gender Country YearOfBirth Language Ethnicity Experience LanguageTest ApprovalRate f(w) w1 Female India 2004 English Indian 0 0.50 0.20 0.29 w2 Male America 1976 English White 14 0.89 0.92 0.911 w3 Male India 1976 Indian White 6 0.35 0.65 0.560 w4 Male Other 1963 Other Indian 18 0.64 0.76 0.724 w5 Female India 1963 Indian Indian 21 0.85 0.90 0.885 w6 Male America 1995 English African-American 2 0.42 0.20 0.266 w7 Female America 1982 English African-American 16 0.95 0.98 0.971 w8 Male Other 2008 English Other 0 0.30 0.15 0.195 w9 Male Other 1992 English White 2 0.32 0.25 0.271 w10 Female America 2000 English White 5 0.76 0.56 0.620
Fig. 1. Optimum partitioning of the toy example data
compute the average EMD between all pairs of partitions. To do that, we generate a histogram for each partition as indicated in Figure 1 based on the function scores by creating equal bins over the range of 𝑓 and counting the number of workers whose function values 𝑓(𝑤 ) fall in each bin. Once the partitioning with highest average pairwise EMD has been identified, it is up to the user, requester or crowdsourcing platform developer, to decide on the right subsequent action.Note that since the partitions are disjoint, other metrics such as Kendall Tau or Pearson correlation will not be applicable.
3 ALGORITHM
Our optimization problem for finding the most unfair partitioning is hard since the number of possible partitionings is exponential in the number of protected attributes. More precisely, assuming 𝑛 protected attributes, then there are 𝑂(2𝑛) possible partitionings of users based on those 𝑛 protected attributes. This can be very large even for relatively small values of 𝑛. For this reason, we propose a
ALGORITHM 1: EMDP (𝑊 : a set of individuals, 𝑓 : a scoring function, 𝐴: a set of attributes) 1: 𝑎= 𝑤𝑜𝑟𝑠𝑡𝐴𝑡𝑡𝑟𝑖𝑏𝑢𝑡𝑒 (𝑊 , 𝑓 , 𝐴) 2: 𝐴= 𝐴 − 𝑎 3: 𝑐𝑢𝑟 𝑟 𝑒𝑛𝑡= 𝑠𝑝𝑙𝑖𝑡 (𝑊 , 𝑎) 4: 𝑐𝑢𝑟 𝑟 𝑒𝑛𝑡 𝐴𝑣𝑔= 𝑎𝑣𝑒𝑟𝑎𝑔𝑒𝐸𝑀𝐷 (𝑐𝑢𝑟𝑟𝑒𝑛𝑡, 𝑓 ) 5: while 𝐴 ≠ ∅ do 6: 𝑎= 𝑤𝑜𝑟𝑠𝑡𝐴𝑡𝑡𝑟𝑖𝑏𝑢𝑡𝑒 (𝑐𝑢𝑟𝑟𝑒𝑛𝑡, 𝑓 , 𝐴) 7: 𝐴= 𝐴 − 𝑎 8: 𝑐ℎ𝑖𝑙𝑑𝑟 𝑒𝑛= 𝑠𝑝𝑙𝑖𝑡 (𝑐𝑢𝑟𝑟𝑒𝑛𝑡, 𝑎) 9: 𝑐ℎ𝑖𝑙𝑑𝑟 𝑒𝑛𝐴𝑣𝑔= 𝑎𝑣𝑒𝑟𝑎𝑔𝑒𝐸𝑀𝐷 (𝑐ℎ𝑖𝑙𝑑𝑟𝑒𝑛, 𝑓 ) 10: if 𝑐𝑢𝑟𝑟𝑒𝑛𝑡𝐴𝑣𝑔 ≥ 𝑐ℎ𝑖𝑙𝑑𝑟𝑒𝑛𝐴𝑣𝑔 then 11: break 12: else 13: 𝑐𝑢𝑟 𝑟 𝑒𝑛𝑡= 𝑐ℎ𝑖𝑙𝑑𝑟𝑒𝑛 14: 𝑐𝑢𝑟 𝑟 𝑒𝑛𝑡 𝐴𝑣𝑔= 𝑐ℎ𝑖𝑙𝑑𝑟𝑒𝑛𝐴𝑣𝑔 15: end if 16: end while 17: return 𝑐𝑢𝑟𝑟𝑒𝑛𝑡
heuristics-based algorithm to identify a partitioning of individuals with respect to our optimization objective within reasonable time.
Algorithm 1 shows the pseudocode of our EMD partitioning algorithm EMDP. It generates a partitioning of the individuals in a greedy manner using the EMD of the partitions. EMDP is based on decision trees with EMD as utility [13]. It starts by splitting the individuals on theworst attribute with respect to EMD. This is done by trying out all possible attributes one at a time, and associating to each attribute-value partition, one histogram of the scores of all the individuals it contains. For each candidate attribute, EMDP computes the average pairwise EMD over histograms associated to the partitions obtained with the values of that attribute. It then returns the attribute with the highest average pairwise EMD and splits on that attribute. In the subsequent splitting steps, EMDP iteratively partitions the individuals using the other attributes in the same manner and only stops when the average pairwise EMD of the current partitioning is greater than that of the next candidate partitioning.
Algorithm EMDP has a complexity of 𝑂(𝑛2) in the worst case, where 𝑛 is the number of protected attributes. At first the algorithm tries out 𝑛 possible partitionings using a single attribute, and then it tries 𝑛− 1 partitionings corresponding to the remaining 𝑛 − 1 attributes and so on until there are no more attributes left. Hence, it will examine a total of 𝑛+ (𝑛 − 1) + · · · + 1 = 𝑂 (𝑛2) partitionings in the worst case (i.e., if the termination condition was ever met).
Note that in case of positive discrimination, i.e., when only certain individuals are considered for jobs based on some of their protected attributes, one can seamlessly run EMDP on those individuals only and exclude those protected attributes necessary for the job when quantifying subgroup unfairness.
4 EXPERIMENTS
Our algorithm described in the previous section assumes both data and process transparencies, i.e., the availability of individuals’ protected and observed attributes as well as the scoring function. Before we set out to evaluate its effectiveness in quantifying unfairness of scoring in online job marketplaces, we first run a series of user studies to assess the feasibility of such assumptions and to gauge individuals’ perceived fairness of scoring. We then evaluate our algorithm and compare it to
a series of baselines under various transparency settings, namely transparent data and transparent process, transparent data and opaque process, and opaque data and transparent process. Finally, we apply our algorithm on real data crawled from the freelancing platform TaskRabbit and report findings on fairness of scoring for various jobs on this platform.
4.1 User Studies on Transparency Settings
Our user studies have two goals. The first goal is to verify how sensitive individuals on online job marketplaces are to making their data transparent. The second goal is to examine the impact of data and process transparencies on the ability of judging fairness of scoring on these platforms from the individuals’ perspective. Without loss of generality, we focus on crowdsourcing as one example of such online marketplaces in our user studies. However, we believe our findings to be applicable to other types of online job marketplaces.
We designed different surveys to address the questions:
(1) How do workers in crowdsourcing platforms feel about sharing their protected attributes when it comes to scoring them for tasks?
(2) How do workers feel about sharing their observed attributes? (3) Do workers prefer a transparent scoring process or an opaque one?
(4) From the workers point of view, how does the interplay between data and process trans-parencies affect their ability to judge fairness of scoring?
4.1.1 Recruitment. We recruited our subjects from Prolific Academic2
, a crowdsourcing platform with a workforce accustomed to completing surveys. Recruited subjects were redirected toesurv.org to fill out forms we designed for each user study. We based our choice of sample size on the following formula, that is estimated using the central limit theorem [17]:
Sample size= 𝑧2 ×𝑝 (1−𝑝 ) 𝑒2 1+(𝑧2 ×𝑝 (1−𝑝 ) 𝑒2𝑁 ) where:
• N = 22378 is the population size:, the Prolific Academic workforce eligible for our survey completion task,
• e = 8% is the margin of error: the percentage of deviation in result in the sample size compared with the total population,
• z = 90% is the confidence level: if the task is repeated 100 times, 90 times out of 100 the result would lie within the margin of error, and
• p = 50% is the percentage value: it is the expected result value of the experiment. It is advised to put it at 50% when the result is not known.
Our sample size rounded up at 105 subjects per user study.
4.1.2 Survey Design and Results. We designed four surveys to answer the questions stated in the beginning of this section on perceived fairness by workers and their preference for data and process transparencies. In all four, we assumed an audio transcription task in English. We also assumed that there are five workers, some of which are qualified for the task and some are not. Each worker has only one single protected attribute, namelynationality, which is either English/American or non-English/American. Similarly, each worker has one observed attribute, namelyqualification, which is assumed to be a combination of English level and approval rate. The requester gets to choose which workers are qualified for the task based on a scoring process that can use a combination of the workers’ protected and observed attributes.
2
Fig. 2. Survey to assess how workers feel about sharing their protected attributes
Our first survey shown in Figure 2, was used to assess how workers feel about sharing their protected attributes. The workers were presented with two scenarios, one where the requester of the task had access to both protected and observed attributes of workers, and hence might use both to score the workers, and another where the requester had only access to observed attributes. The workers were asked to choose which scenario they prefer. The two scenarios received equal votes implying that workers are not sensitive about sharing their protected attributes even if they are used to score them. Those who preferred not to share their protected attributes raised concerns about fairness if such attributes were made available. Note that in both cases we did not provide the scoring function itself (i.e., we assumed an opaque scoring process).
Our second survey is very similar to the first one (see Figure 3) and was used to assess how workers feel about sharing theirobserved attributes. The workers were presented with two scenarios, one where the requester had access to both protected and observed attributes and another where the requester had only access to protected attributes. The workers were asked to indicate which scenario they prefer and overwhelmingly, 83.65% of them, chose the first scenario that makes observed attributes transparent to requesters. They indicated that requesters will do a better job at scoring them for tasks, if they have access to their observed attributes such as English proficiency. Our third survey was used to assess whether workers prefer a transparent scoring process or an opaque one (see Figure 4). The workers were again given two scenarios to choose from. The first represented the case of a transparent scoring process, where the workers were shown the scoring function by which the requester scores the workers for the tasks. The second scenario represented the case of an opaque process where the workers were only presented with the scoring process decisions (i.e., which workers were qualified for the task and which were not ). In both cases, all workers’ protected and observed attributes were available (i.e., transparent data). The majority of workers, 62.85%, preferred the transparent process scenario because they believed it was more fair. This confirms a previous result in Economics [14, 18] that people are more accepting of procedures that treat them with respect and dignity, making it easier to accept outcomes, even if they do not like those outcomes.
Fig. 3. Survey to assess how workers feel about sharing their observed attributes
Fig. 4. Survey to assess whether workers prefer a transparent scoring process or an opaque one
Finally, to assess the impact of data and process transparencies on workers’ ability to judge fairness in scoring, we designeda fourth survey, again about audio transcription (see Figure 5). The survey consisted of two scenarios, the first representing the setting of a transparent data and opaque process and the second representing an opaque data and transparent process setting. In the first scenario, only the workers’ protected and observed attributes were shown. In the second scenario, only the scoring function was shown. In both scenarios, the workers who participated in
Fig. 5. Survey to assess the impact of data and process transparencies on workers’ ability to judge fairness
the survey were asked to pretend they are auditors judging the fairness of the scoring process and were asked to choose which scenario made it easier for them to judge. 66.67% of the workers were in favor of scenario 1 and 33.33% of scenario 2. A further examination of the comments from the workers showed that they preferred the first scenario because the transparent data (both worker data and decisions) made it easier for them to judge the fairness of the scoring process, even though the process itself was not shown. Note that we did not consider the scenario where both data and process are opaque since it would be impossible for the workers to judge fairness in that case. We also did not consider the scenario where both data and process are transparent since it was already considered in our third survey, which has shown that in the case where data is transparent, workers prefer transparent scoring process as well, perceiving it as more fair.
To summarize, our user studies have shown that workers do not mind sharing their protected and observed attributes on crowdsourcing platforms and generally prefer participating in transpar-ent scoring processes. They also believe that in order to judge fairness in scoring on these platforms, access to protected and observed attributes of workers is necessary even if the scoring process itself was not available for judging. Our approach and algorithm have thus far assumed the availability of both individuals’ data and the scoring process. In the next experiment, we assess their effectiveness in this setting and then in our next two experiments, we relax this assumption and evaluate our algorithm in the case where the scoring process is not available, as well as when the individuals’ data is k-anonymized [19].
4.2 Transparent Data - Transparent Process
In this experiment, we evaluate the effectiveness of our approach in quantifying unfairness in the case of transparent data and process. We run a simulation of a crowdsourcing platform using various sets ofactive workers and various scoring functions to compare our proposed algorithm EMDP against a set of baselines.
4.2.1 Setting. We generate three sets of active workers W of different sizes: 50, 500 and 7300 (the estimated number of Amazon Mechanical Turk workers who are active at any time [20]). Each 𝑤 inW has six protected attributes:
• Gender = {Male, Female},
Table 3. Average EMD and runtime for 50 workers and random functions
Algorithm Average EMD time (in secs)
𝑓1 𝑓2 𝑓3 𝑓4 𝑓5 𝑓1 𝑓2 𝑓3 𝑓4 𝑓5
EMDP 0.185 0.184 0.167 0.264 0.241 2.348 2.211 2.34 2.305 3.453
r-EMDP 0.180 0.182 0.159 0.263 0.243 0.89 0.796 0.785 1.031 0.952
F ULL 0.174 0.179 0.158 0.260 0.239 0.417 0.462 0.462 0.463 0.465
Optimum 0.185 0.192 0.167 0.272 0.257 11.408 11.405 11.583 12.5 13.064
Table 4. Average EMD and runtime for 500 workers and random functions
Algorithm Average EMD time (in secs)
𝑓1 𝑓2 𝑓3 𝑓4 𝑓5 𝑓1 𝑓2 𝑓3 𝑓4 𝑓5 EMDP 0.196 0.194 0.177 0.246 0.253 163.036 180.181 181.441 181.88 181.017 r-EMDP 0.195 0.193 0.177 0.246 0.253 86.697 75.017 89.363 91.35 76.096 F ULL 0.195 0.193 0.177 0.246 0.253 41.588 41.355 41.16 40.931 41.274 Optimum 0.196 0.194 0.177 0.246 0.253 363.866 367.177 367.012 413.061 367.828 • YearOfBirth = [1950, 2009],
• Language = {English, Indian, Other},
• Ethnicity = {White, African-American , Indian, Other}, and • YearsOfExperience = [0,30],
and two observed attributes: • LanguageTest = [25,100] and • ApprovalRate = [25,100].
The values of those attributes are populated randomly so as to avoid injecting any bias in the data ourselves. Moreover, we define five different task qualification functions:
• 𝑓1= 0.3 × 𝐿𝑎𝑛𝑔𝑢𝑎𝑔𝑒𝑇 𝑒𝑠𝑡 + 0.7 × 𝐴𝑝𝑝𝑟𝑜𝑣𝑎𝑙𝑅𝑎𝑡𝑒
• 𝑓2= 0.7 × 𝐿𝑎𝑛𝑔𝑢𝑎𝑔𝑒𝑇 𝑒𝑠𝑡 + 0.3 × 𝐴𝑝𝑝𝑟𝑜𝑣𝑎𝑙𝑅𝑎𝑡𝑒
• 𝑓3= 0.5 × 𝐿𝑎𝑛𝑔𝑢𝑎𝑔𝑒𝑇 𝑒𝑠𝑡 + 0.5 × 𝐴𝑝𝑝𝑟𝑜𝑣𝑎𝑙𝑅𝑎𝑡𝑒
• 𝑓4= 1 × 𝐿𝑎𝑛𝑔𝑢𝑎𝑔𝑒𝑇 𝑒𝑠𝑡 + 0 × 𝐴𝑝𝑝𝑟𝑜𝑣𝑎𝑙𝑅𝑎𝑡𝑒
• 𝑓5= 0 × 𝐿𝑎𝑛𝑔𝑢𝑎𝑔𝑒𝑇 𝑒𝑠𝑡 + 1 × 𝐴𝑝𝑝𝑟𝑜𝑣𝑎𝑙𝑅𝑎𝑡𝑒
We compare our proposed algorithm EMDP to two baselines. The first baseline, which we refer to as r-EMDP, is a copy of our algorithm EMDP that uses a random attribute instead of the worst attribute to split the workers at each step. This baseline was used to attest the validity of our greedy heuristic of choosing the worst attribute to split on. The second baseline, which we refer to as F ULL, is an algorithm that splits the workers based onall their protected attributes resulting in a full partitioning. This baseline was used to validate the effectiveness of our stopping condition. We also compare our algorithm EMDP to an optimum algorithm that solves our optimization problem exactly by exhaustively examining every possible partitioning of the workers using any combination of their protected attributes and returning the one with the highest average pairwise EMD between partitions.
4.2.2 Simulation Results. Tables 3, 4 and 5 show the average EMD obtained by the different algorithms for the three datasets and their runtimes. Our first observation from the three tables is that for all datasets, functions 𝑓4 and 𝑓5 exhibit the highest unfairness as measured by the
Table 5. Average EMD and runtime for 7300 workers and random functions
Algorithm Average EMD time (in secs)
𝑓1 𝑓2 𝑓3 𝑓4 𝑓5 𝑓1 𝑓2 𝑓3 𝑓4 𝑓5
EMDP 0.163 0.163 0.151 0.210 0.211 2343.189 2333.634 1894.409 1911.65 1910.175 r-EMDP 0.163 0.163 0.151 0.210 0.170 1878.688 1735.444 1413.876 1360.265 1105.924
F ULL 0.163 0.163 0.151 0.210 0.211 1453.626 1449.466 1450.712 469.839 1467.606 Optimum 0.163 0.163 0.151 0.210 0.211 2944.879 2619.262 2364.807 2409.187 2413.059
functions are the ones that rely on one observed attribute only (LanguageTest in case of 𝑓4and
ApprovalRate in case of 𝑓5).This indicates that when the scoring process uses fewer observed attributes
to score individuals, the chance of unfairness increases. In our simulation, since the attribute values were generated at random, there is a higher chance that the scoring function correlates with a single protected attribute than with multiple attributes.
Second, we observe that our algorithm EMDP consistently outperforms or do as good as both baselines r-EMDP and F ULL for almost all datasets and functions. Particularly, EMDP beats both its baselines in 6 cases out of 15, and ties with one of them or both in 8 cases and loses to one of them (random counterpart) in just one case. On the other hand, EMDP achieves the optimum partitioning in 12 cases out of 15. Note that in the case of 7300 workers, all algorithms returned the full partitioning tree, i.e., using all protected attributes, which is the same as the partitioning returned by the F ULL algorithm.We conjecture that it is due to the random values of all attributes.
In terms of efficiency, F ULL is obviously the fastest algorithm since it does not involve any checks and partitions all the individuals upfront using all attributes. Optimum takes the most time to terminate since it has to exhaustively examine an exponential number of partitionings. On the other hand, our algorithm EMDP incurs additional time compared to its random counterpart since at each splitting step, it needs to examine all remaining attributes to determine the worst one (i.e., the one which might result in the highest average EMD). All these factors contributed to the increased time to execute EMDP compared to r-EMDP and F ULL. Finally, we observe that the larger the dataset is, the more time it took for all algorithms to finish. This is very intuitive given that the larger the dataset is, the larger the individual histograms are and the more time it takes to compute the pairwise EMD between them. Moreover, the deeper the partitioning tree, the larger the number of histograms that need to be compared.
4.2.3 Qualitative Results. In addition to our simulation where we used a set of random scoring functions, we also ran our algorithm on the following set of carefully-constructed functions, which are explicitly unfair by design:
• 𝑓6: this function is unfair against females by setting the scoring function of workers as follows:
𝑓6(𝑤 ) > 0.8 if 𝑤 is male and 𝑓6(𝑤 ) < 0.2 if 𝑤 is female.
• 𝑓7: this function sets the score of workers in a biased manner based on their gender and
nationality as follows: 𝑓7(𝑤 ) > 0.8 if 𝑤 is male and American, 𝑓7(𝑤 ) < 0.2 if 𝑤 is female and
American, 0.5 < 𝑓7(𝑤 ) < 0.7 if 𝑤 is Indian, either male or female, 𝑓7(𝑤 ) > 0.8 if 𝑤 is female
with any other nationality, and 𝑓7(𝑤 ) < 0.2 if 𝑤 is male with any other nationality.
• 𝑓8: this function was designed as follows: 𝑓8(𝑤 ) > 0.8 if 𝑤 is female and American, 0.5 <
𝑓8(𝑤 ) < 0.8 if 𝑤 is female and Indian and 𝑓8(𝑤 ) < 0.2 if 𝑤 is female with another nationality.
• 𝑓9: this function was designed to correlate with three protected attributes, namely: ethnicity,
language and year of birth in a similar manner as the previous ones.
As can be seen from Table 6 for the case of 7300 workers, EMDP retrieves the optimal partitionings with the highest possible average EMD. In addition, the resulting partitionings are the ones expected,
Table 6. Average EMD for 7300 workers and biased functions
Algorithm Average EMD
𝑓6 𝑓7 𝑓8 𝑓9
EMDP 0.800 0.426 0.456 0.358
r-EMDP 0.492 0.342 0.295 0.280
F ULL 0.421 0.368 0.338 0.358
Optimum 0.800 0.426 0.456 0.358
Fig. 6. Runtime of EMDP and Optimum when varying the number of attributes
i.e., using the attributes for which the functions were designed to correlate with. For example, for 𝑓6, EMDP partitions the workers on only gender. Similarly, for 𝑓7, it partitions the workers on both
gender and country. Finally, we observe thatoverall for all functions and algorithms, the average EMD is much higher compared to the functions used in our simulation experiment, which indicates that our optimization problem is indeed effective in capturing unfairness in scoring as conjectured.
Finally, to test the scalability of our algorithm EMDP, we ran a simulation of a new dataset consisting of 50 workers and varying the number of protected attributes from 3 to 16. Figure 6 shows the runtime of each algorithm in log-scale versus the number of protected attributes. Note that the optimum algorithm did not finish running in 24 hours when the number of attributes exceeded 16. Also note that for 16 attributes, EMDP ended up splitting on only 3 attributes after which the stopping condition was met, which explains the smaller running time compared to the case of 15 attributes.
4.3 Transparent Data - Opaque Process
In this experiment, we run our simulation again from the previous experiment, however, we assume an opaque process. Our algorithms are therefore given access only to the workers’ data (both protected and observed attributes) and to the scoring process decisions, which are binary values indicating whether a worker is qualified for the task or not. Worker scores are not available since the process being assessed is opaque. To do so, we assign a value of 1 to 10%, 30% and 50% of the workers at random and the rest are assigned the value 0. We do not consider any other cases such as assigning a value of 1 to 70% or 90% of the workers since they are redundant because we only have binary decisions. We then run our algorithm EMDP as well as our baselines r-EMDP and F ULL, and the optimum algorithm Optimum over the three different worker datasets. Note that in this setting, the only change that will take place in any of the algorithms is the way the histograms
Table 7. Average EMD and runtime for 50 workers and random binary decisions
Algorithm Average EMD time (in secs)
10% 30% 50% 10% 30% 50%
EMDP 0.067 0.218 0.255 1.783 2.73 3.006
r-EMDP 0.041 0.204 0.255 0.389 0.692 1.117
F ULL 0.020 0.204 0.255 0.347 0.347 0.349
Optimum 0.067 0.221 0.255 10.481 10.542 10.515
Table 8. Average EMD and runtime for 500 workers and random binary decisions
Algorithm Average EMD time (in secs)
10% 30% 50% 10% 30% 50%
EMDP 0.099 0.217 0.249 101.623 134.529 134.446
r-EMDP 0.099 0.217 0.249 51.53 62.157 55.484
F ULL 0.099 0.217 0.249 31.418 31.354 31.367
Optimum 0.102 0.217 0.249 269.767 268.852 268.183
of workers per partition are generated. Instead of building a histogram to represent the distribution of the function score values, the histograms will represent the distribution of qualification decisions per partition. That is, each histogram will consist of two bins, one representing those workers who did not qualify for the task (value of 0) and the other those who qualified for the task (value of 1).
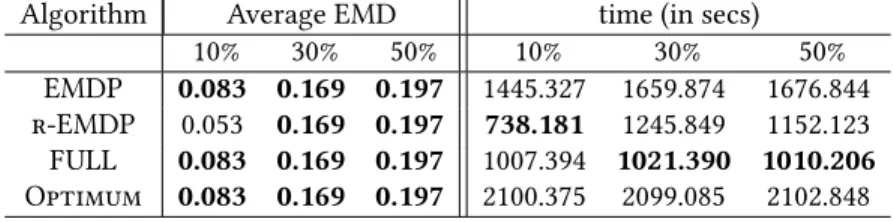
4.3.1 Simulation Results. As can be seen from Tables 7, 8 and 9, EMDP retrieves the optimum partitioning in most of the cases (7 out of 9). It also outperforms or do as well as both its baselines in all the cases. Moreover, we observe that as we increase the percentage of workers who are considered qualified (i.e., assigned the value 1), the amount of unfairness as measured by the average EMD increases. This is consistent across all algorithms and datasets. Since we randomly picked the workers to be considered qualified in this experiment, it is intuitive that the fewer such workers are, the less likely is their chance of correlating with protected attributes. That is, one would expect that qualified workers would fall in random partitions across the partitioning space. As the number of qualified workers increases, their chance of correlating with the protected attributes increases too. In terms of efficiency, again similar to the case of transparent data and process, Optimum is the most time-consuming, followed by EMDP, then r-EMDP and finally F ULL is the least time-consuming.
4.3.2 Qualitative Results. Similar to the case of the transparent data and process, we constructed two opaque scoring processes that were unfair by design. The first such process qualifies only males (i.e., assigns them a value of 1) and the second qualifies workers based on their country and gender. Table 10 shows the average EMD for each of the algorithms for our various datasets. As can be seen from the table, both EMDP and Optimum retrieve the partitionings with the highest average EMD compared to all other algorithms for the case of 7300 workers. Moreover, they partition the workers as expected based on the attributes that correlate with the scoring process, namely gender in the first case and gender and country in the second case. Finally, it can be observed that for all the algorithms, the average EMD is higher than those retrieved in the case of the random scoring processes shown in Tables 7, 8 and 9.
Table 9. Average EMD and runtime for 7300 workers and random binary decisions
Algorithm Average EMD time (in secs)
10% 30% 50% 10% 30% 50%
EMDP 0.083 0.169 0.197 1445.327 1659.874 1676.844
r-EMDP 0.053 0.169 0.197 738.181 1245.849 1152.123
F ULL 0.083 0.169 0.197 1007.394 1021.390 1010.206
Optimum 0.083 0.169 0.197 2100.375 2099.085 2102.848
Table 10. Average EMD for 7300 workers and biased binary decisions
Algorithm Average EMD
gender gender & country
EMDP 0.500 0.300
r-EMDP 0.306 0.225
F ULL 0.250 0.250
Optimum 0.500 0.300
4.4 Opaque Data - Transparent Process
In our third experiment, we run our simulation again from our first experiment, however, in this case we assume that our algorithms are given access to workers k-anonymized data [21], in addition to the scoring function through which the workers are ranked. This represents a setting where we havepartially opaque data and a transparent process. In our context, the data is k-anonymized with respect to the workers’ protected attributes if there are at least k workers whose protected attribute values are the same. In case the k-anonymity condition does not hold, the k-anonymization approach generalizes some of the protected attributes to satisfy the k-anonymity property. We rely on the ARX data anonymization tool3. The tool takes as input a set of quasi-identifiers, which we assume to be all the protected attributes in our case, a value of 𝑘 , and a generalization hierarchy for each attribute. For year of birth and years of experience, we define four levels of generalization, which will replace individual values of such attributes with a broader range. For example, to anonymize year of birth, the tool can generalize the exact values to ranges such as[1960 − 1070], [1980 − 1990], [1990 − 2000], 𝑒𝑡𝑐. In case this is not sufficient to achieve k-anonymity, a higher level of generalization is used, for instance by generalizing the year of birth to the ranges[1960 − 1980], [1980 − 2000], 𝑒𝑡𝑐. For the attributes gender, ethnicity, language and country, which have only a hand-full of values in our datasets, we only define one level of generalization, which basically results in anonymizing the whole attribute. This in turn entails that these fully anonymized attributes are discarded by our algorithms when partitioning workers.
We set out to investigate the applicability of our algorithms in quantifying unfairness of scoring even in the case when data is k-anonymized. We run the k-anonymization ARX tool on our three simulation datasets, setting 𝑘= 10 and then passing the resulting k-anonymized datasets as input to our algorithm EMDP. We set 𝑘 = 10 since our data is randomly generated, and thus most of the workers have unique tuples in terms of their protected attributes (i.e., the data is highly un-anonymized). For the case of 50 workers, the k-anonymization approach completely anonymized the attributes country, year of birth, language and ethnicity and generalized the years of experience to 20 years spans. For the case of 500 workers, the k-anonymization approach completely anonymized the
3
Table 11. Average EMD and runtime for 50 k-anonymized workers and random functions
Algorithm Average EMD time (in secs)
𝑓1 𝑓2 𝑓3 𝑓4 𝑓5 𝑓1 𝑓2 𝑓3 𝑓4 𝑓5 50 workers EMDP 0.070 0.060 0.053 0.074 0.092 0.005 0.005 0.004 0.004 0.004 r-EMDP 0.070 0.058 0.053 0.074 0.092 0.004 0.004 0.004 0.004 0.004 F ULL 0.070 0.057 0.053 0.074 0.092 0.003 0.003 0.003 0.003 0.003 Optimum 0.070 0.060 0.053 0.074 0.092 0.004 0.004 0.004 0.004 0.005
Table 12. Average EMD and runtime for 500 k-anonymized workers and random functions
Algorithm Average EMD time (in secs)
𝑓1 𝑓2 𝑓3 𝑓4 𝑓5 𝑓1 𝑓2 𝑓3 𝑓4 𝑓5 500 workers EMDP 0.063 0.071 0.065 0.089 0.064 0.205 0.203 0.201 0.204 0.204 r-EMDP 0.063 0.071 0.065 0.089 0.064 0.164 0.179 0.163 0.162 0.165 F ULL 0.063 0.071 0.065 0.089 0.064 0.139 0.140 0.138 0.142 0.141 Optimum 0.063 0.071 0.065 0.089 0.064 0.211 0.211 0.21 0.213 0.211
Table 13. Average EMD and runtime for 7300 k-anonymized workers and random functions
Algorithm Highest EMD time (in secs)
𝑓1 𝑓2 𝑓3 𝑓4 𝑓5 𝑓1 𝑓2 𝑓3 𝑓4 𝑓5
EMDP 0.042 0.040 0.038 0.047 0.049 8.763 9.978 8.742 8.902 8.834
r-EMDP 0.042 0.040 0.038 0.047 0.049 6.663 7.010 6.863 7.159 7.042
F ULL 0.042 0.040 0.038 0.047 0.049 5.647 5.623 5.636 5.663 5.671
Optimum 0.042 0.040 0.038 0.047 0.049 13.44 13.212 13.33 13.307 13.278
year of birth, language, ethnicity and years of experience. Finally, for the case of 7300 workers, the k-anonymization approach completely anonymized the year of birth and ethnicity, and generalized the years of experience to 20 years spans.
4.4.1 Results. Tables 11, 12 and 13 display the average EMD and the runtime of our algorithm EMDP, Optimum and the baselines with the k-anonymized instances of our three datasets. We ob-serve that overall, the average EMD values returned are all less than the case when non-anonymized data was available, regardless of the algorithm, scoring function or dataset. This is intuitive given that the algorithms have fewer attributes and attribute values to split on. However, we also observe that for the cases of 50 and 7300 workers, the obtained average EMD values are higher for 𝑓4and
𝑓5compared to the first three functions, which is inline with the results obtained for the case of
transparent data/transparent process from our first experiment. This is also true for 𝑓4in the case of
500 workers. We observe that in most cases, the results of all algorithms were very similar, which again can be attributed to the reduction in the partitioning space induced by the k-anonymization process. In terms of efficiency, again EMDP is the slowest after Optimum, however, in the case of k-anonymization, we also observe that the runtimes of all algorithms are reduced since the number of possible partitions is reduced and hence the algorithms compare fewer histograms to compute the average EMD.
Fig. 7. Gender breakdown Fig. 8. Ethnic breakdown
We conclude by pointing out that our algorithm has shown to be effective in quantifying unfairness in scoring of individuals regardless of the transparency setting. Naturally, it is most effective when it has access to as much information as possible. This is especially true regarding data transparency. Our algorithm is most successful in quantifying unfairness when it has access to workers’ protected attributes, regardless of whether the scoring process is transparent or opaque. This coincides with our finding from the user studies, in which workers indicated that they were more successful in assessing fairness when they have access to workers’ attributes, regardless of whether the scoring process is transparent or not.
4.5 TaskRabbit
In this final experiment, we demonstrate the effectiveness of our approach on real data. More precisely, we run our algorithm EMDP on a dataset crawled from the online freelancing platform TaskRabbit4and study fairness of scoring for various services (i.e., job types) and in various locations on this platform.
4.5.1 Setting. TaskRabbit is an online marketplace that matches freelance labor with local demand, allowing consumers to find immediate help with everyday tasks, including cleaning, moving, delivery and handyman work. TaskRabbit is supported in 45 different cities mostly in the US. For each one of the 45 locations available on TaskRabbit, we retrieved up to 20 of the most popular services offered in that particular location. We thus generated a total of 278 queries, where each query was a combination of a location and a service, e.g.,Home Cleaning in New York. Note that all queries were generated with the service date set one week in the future relative to the crawl date.
For each query, we extracted the rank of each tasker per query, their badges, reviews, profile pictures, and hourly rates, where the number of taskers returned per query was limited to 50. Since the demographics of the taskers were not readily available on the platform, we crowdsourced the taskers’ profile pictures to obtain such demographics. We asked contributors on Figure Eight5to indicate the gender and ethnicity of the TaskRabbit taskers based on their profile pictures. Each profile picture was labeled by three different contributors on Figure Eight and a majority vote was employed to obtain a final label per demographic attribute for each tasker. The contributors were given pre-defined categories for gender = {male, female} and ethnicity = {asian, black,white}. We also computed the Kappa coefficient to report agreement between contributors. The values for gender and ethnicity are 0.934 and 0.871, respectively, which shows significant agreement. We also ran Face++6, a tool that infers gender automatically from images and we measured the agreement
4
https://www.taskrabbit.com/
5
https://www.figure- eight.com/
6
Table 14. Average and standard deviation of the number of taskers per partition across all queries per service. Service Average STD Run Errands 34.38 11.96 Event Staffing 28.44 13.20 General Cleaning 28.28 16.22 Furniture Assembly 26.80 16.19 Delivery 24.76 16.29 Moving 15.94 13.27 Handyman 15.64 13.58 Yard Work 10.00 10.98
between crowdsourced annotations and the results of Face++ using Kappa coefficient. The value fore gender is 0.954.
The gender and ethnic breakdowns of the taskers in our dataset are shown in Figures 7 and 8. Overall, we had a total of 2184 unique taskers in our crawled dataset, the majority of which were male (≈ 74%) and white (≈ 73%).
4.5.2 Results. We ran our algorithm EMDP on all 278 queries to quantify the unfairness of scoring for these queries. Since we do not have access to the scoring function through which the taskers are ranked, we assume anopaque scoring process setting and we utilize the taskers’ ranks to build the score distributions. That is, for a given query 𝑞 and a tasker 𝑤 , we set the score 𝑓(𝑤, 𝑞) of tasker 𝑤 with respect to the query 𝑞 as follows:
𝑓(𝑤, 𝑞) = 1 −
𝑟 𝑎𝑛𝑘(𝑤, 𝑞) |𝑞|
where 𝑟 𝑎𝑛𝑘(𝑤, 𝑞) is the rank of tasker 𝑤 for query 𝑞 and |𝑞| is the number of taskers returned per query (maximum of 50).
We then partition the taskers using our algorithm EMDP to identify the most unfair partitioning of taskers for each query 𝑞 that we crawled. Since we only had two protected attributes in our dataset, EMDP resulted in three different types of partitionings, one based on ethnicity only, one based on gender only and one that used both attributes (i.e., a full partitioning).
Figure 9 displays the number of queries for which the most unfair partitioning identified by our algorithm EMDP was based on ethnicity only, on gender only or on both attributes. As can be seen in the figure, for the majority of the queries (112 out of 278), our algorithm EMDP partitioned the taskers only on ethnicity indicating that it was the attribute for which most unfairness in scoring occurred. In other words, for those 112 queries, the highest disparity in scoring occurred between whites, black and Asians. This was followed by gender in 89 out of the 278 queries in our crawled dataset. Finally, in 77 queries out of the 278 we had, the highest unfairness unveiled by our EMDP algorithm was when we split the taskers on both ethnicity and gender. The average number of taskers per partition returned by EMDP across all queries is 7.28 and its standard deviation is 9.28. Table 14 shows the average and standard deviation of the number of taskers per partition across all queries per service.
In Figure 10, we show the number of queries per ethnic group. Recall that out of the 278 queries in our dataset, the most unfair partitioning for 112 of those was achieved when partitioning the taskers using ethnicity only. As can be seen from Figure 10, all of these queries consisted of white taskers in the top 50 rankings, whereas only 103 of those consisted of black taskers, and only 38
Fig. 9. Number of queries for different partitionings Fig. 10. Number of queries per ethnic group
Fig. 11. Number of queries per gender group Fig. 12. Number of queries per ethnic-gender group
queries consisted of Asian taskers. This demonstrates that on TaskRabbit, black taskers are not included at all in the top-50 rankings for some services in certain locations. This becomes even more severe in the case of Asians, where for the majority of the queries (74 out of 112), no Asian taskers were included at all in the top-50 rankings. This conforms with the general distribution of taskers overall queries, where 73% of taskers were white, 23% were black and 4% were Asians. When breaking down the taskers for the 112 queries partitioned on ethnicity, the distribution of taskers per ethnicity and per gender followed closely that of the whole dataset. This indicates that the majority of taskers ranked in the top-50 were males and whites, compared to other ethnic and gender groups.
When looking at the number of queries per gender group (Figure 11), we observe that for the 89 queries for which the most unfairness occurred based on gender as revealed by our algorithm, all such queries consisted of both male and female taskers. This means that unlike ethnicity, all 89 queries included both male and female taskers in the top 50 rankings. Nonetheless, since our algorithm partitioned the taskers on only gender, this indicates that the rank distributions between the male and the female taskers were significantly different as measured by the average EMD. By breaking down those taskers in the top-50 rankings for those 89 queries, we observe that 83% of the top-ranked taskers were male compared to only 17% female taskers. This is a deviation from the overall distribution of taskers per gender in the whole dataset. Our algorithm was thus successful in flagging queries for which significantly fewer number of female taskers were in the top-rankings compared to male taskers. On the other hand, when breaking down the taskers based on ethnicity for those flagged 89 queries, they only marginally differed from the overall distribution per ethnicity group as in the whole dataset, where the majority of the taskers were white (75%), followed by blacks (23%) and finally Asians (only 2%).
Table 15. Average EMD and standard deviation over all queries for different types of partitioning and the two top cities and services for each group of queries
Attribute Average EMD± STD Top 2 Cities Top 2 Services Ethnicity 0.341± 0.109 Memphis, TN, Indianapolis, IN Handyman, Moving
Gender 0.317± 0.109 Minneapolis, MN, Columbus, OH Handyman, Moving Ethnicity-Gender 0.318± 0.096 San Francisco Bay Area, CA , Baltimore, MD Handyman, Delivery
Table 16. Average pairwise EMD between each ethnic group and all other ethnic groups
Group Average Pairwise EMD
Asian 0.337
Black 0.285
White 0.278
Finally, when looking at the queries for which our algorithm partitioned the taskers on both ethnicity and gender (77 queries) as shown in Figure 12, we observe that all those queries included white males in the top rankings, and almost all, with the exception of three queries included female white taskers. On the other hand, five queries did not include any black male taskers compared to 16 which did not include any black females. Finally, only 39 queries (i.e., almost half ) included Asian male taskers in the top rankings and only 19 queries included Asian female taskers in the top rankings. When breaking down the taskers for the 77 queries, we observe that the distribution of taskers per gender group and ethnic group closely followed that of the overall distribution of taskers in the whole dataset.
Table 15 shows the average EMD and its standard deviation over all queries for the different types of partitioning by EMDP (i.e., based on ethnicity alone, on gender alone or on both). It also displays the top cities and services among each group of queries for each case. As can be seen from the table, all three types of partitionings had relatively similar amount of unfairness as measured by the average EMD between their partitions. On the other hand, the service Handyman seemed to be the one which is most unfair on the basis of ethnicity, gender, or both. Moving seemed to be also one of the most unfair services when it comes to ethnicity alone or gender alone, whereas delivery was the second most unfair service on the basis of both protected attributes. When it comes to locations, Memphis, TN and Indianapolis, IN were the two most unfair locations on the basis of ethnicity, Minneapolis, MN and Columbus, OH for gender, and San Francisco Bay Area, CA and Baltimore, MD for both protected attributes.
Table 16 displays the average pairwise EMD values between each ethnic group and all other ethnic groups for the 112 queries that were partitioned on ethnicity only. As can be seen from the table, Asian taskers have the highest average pairwise EMD with all other ethnic groups, followed by blacks and whites. This indicates that for those queries that contained Asian taskers in the top rankings, the score distributions between those Asian taskers and all other taskers were significantly different. In other words, the ranking tend to either favor or disfavor Asians compared to all other ethnic groups. On the other hand, for those queries that contained white taskers with other types of taskers, the average pairwise EMD was less than that of Asians or blacks, indicating that overall white taskers were not particularly treated unfairly compared to other ethnic groups. Table 17 shows the average pairwise EMD for each ethnic-gender group with respect to all other groups based on gender and ethnicity. As can be seen from the table, Asian males tend to have the highest average pairwise EMD followed by black females followed by Asian females followed by