Comparison of Discrete Fracture and Effective Media
Representation of Fractures on Azimuthal AVO
Yang Zhang, Shihong Chi, Mark E. Willis, Daniel Burns, and M. Nafi Toksöz, Earth Resources Laboratory
Dept. of Earth, Atmospheric and Planetary Sciences Massachusetts Institute of Technology
Cambridge, MA 02139
Abstract
In fractured reservoir development, azimuthal AVO (AVOaz) properties of reflected PP waves from reservoir tops are often used to infer fracture properties. The fracture parameter inversion is based on either an effective media model (EMM) or a discrete fracture model (DFM). We address the differences in fracture properties that may be inferred by AVOaz based on the two models. For the DFM we focus on fractures whose length and spacing are comparable to the seismic wavelength. First, we compute the elastic parameters describing the fractured reservoir for each type of model. Then we synthesize seismic data using a finite-difference program for both sets of elastic parameters. By performing AVOaz analysis, we find that EMM and DFM predict different offsets for maximum AVOaz magnitudes. The DFM results show larger AVOaz magnitude with farther offsets, and phase changes at offsets larger than 35 degrees may indicate compliant fractures in a reservoir. For compliant fractures, the fracture strike determined using AVOaz effect based on the EMM is opposite to that from the DFM. This difference could cause incorrect estimation of fracture orientation if the EMM is used to interpret data from a reservoir with discrete fracture zones. DFM may be better suited for modeling wavelength-scale fractures.
1. Introduction
Geophysicists commonly use effective media theory to interpret the seismic amplitude and velocity variations with azimuth and offset for formations with vertically aligned fractures (e.g., Lynn, 2004). The azimuthal AVO (AVOaz) properties of reflected PP waves have been used to identify fracture orientation (e.g. Shen et al., 2002). However, the effective media model (EMM) is only valid for media with fractures that are small relative to the seismic wavelength (e.g., Lynn, 2004, Liu et al., 2000). For fractures whose lengths are comparable to seismic wavelength, discrete fracture models (DFM) are more realistic (Coates and Schoenberg, 1995). Willis et al. (2004) used the DFM and scattered seismic energy to determine spatial orientation and distribution of reservoir fractures. They applied their method to synthetic and field data and showed results consistent with log data. They computed their synthetic data using DFM. Until recently, most work on AVOaz analysis has been based on EMM, which suggests that many small evenly distributed cracks can have an important effect on seismic reflections from the top of a fractured reservoir. For more isolated discrete fractures or fracture zones distributed with spacing on the order of a seismic wavelength, however, conventional wisdom suggests that there would be very little effect on the PP reflection from the top of the reservoir and most of the effect would be visible later in the trace due to scattering. The purpose of this paper is to give some thoughts on how discrete fractures can have impact on AVOaz analysis for PP reflections from the top of the fractured reservoir. In addition to the utility of the scattered energy from discrete fractures for reservoir characterization, the AVOaz from the top of the reservoir also carries valuable information. Because these discrete fractures are important factors in controlling fluid flow and production, we should use all possible interpretive tools to characterize their properties.In this study, we compare the AVOaz characteristics of a fractured medium described by (1) small scale distributed fractures (EMM) and (2) larger scale discrete fractures (DFM). We use finite difference modeling to calculate the synthetic seismograms.
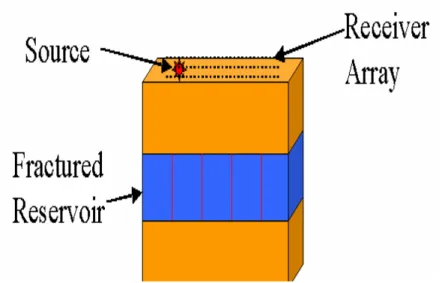
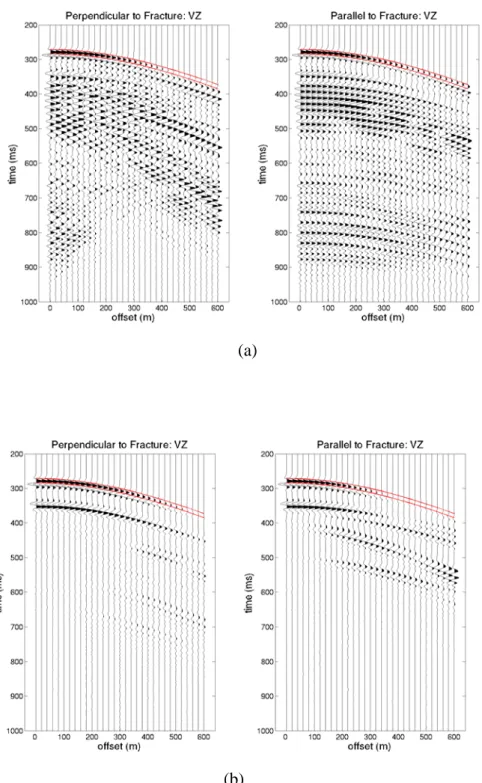
We generate the 3-D full-azimuth, synthetic seismograms using elastic, anisotropic finite-difference calculations. The finite-difference code uses a rotated staggered grid (RSG) (Saenger, 2004). The RSG method can represent accurately large contrasts of elastic moduli between the fractures and surrounding formation. We also apply the perfectly matched layer (PML) absorbing boundary condition to minimize boundary reflections (Marcinkovich and Olsen, 2003). Figure 1 shows the schematics of the model: the properties of the top and bottom layers are Vp = 2460 m/s, Vs = 1230 m/s, and density= 2300 kg/m3, while the fractured layer is100 meter thick and the background properties are Vp = 3300 m/s, Vs = 1800 m/s, and density= 2200 kg/m3. The difference between the configuration of fractures in the EMM and DFM is shown in Figure 2. In the EMM, small cracks or fractures are evenly distributed within the fractured layer, but in the DFM small cracks are assumed to cluster onto discrete fracture zones that are distributed in the layer. In the DFM the formation is homogeneous and unfractured between the discrete fracture zones. We assume the same crack density, aperture, and fluid inclusion throughout the layer for the EMM case and in each fracture zone for the DFM. The total fractured layer in the EMM and each discrete fracture in DFM can be represented as an equivalent transversely isotropic medium with a horizontal symmetry axis. In the limit as the fracture spacing goes to zero the DFM and EMM would have identical properties. For the EMM, we use the method of Liu et al. (2000) to calculate the medium properties. For DFM, we compute the elastic constants using the method of Coates and Schoenberg (1995). For the DFM we create four different fracture spacing models: 20m, 30m, 40m, and 50m. For all models we use a 40 Hz Ricker wavelet for the source (with a nominal P wavelength of 66m and S wavelength of 30 m), and assume that the fractures are filled with gas and the tangential and normal compliances (Zt and Zn) are of the same order. The tangential and normal compliances of the fractures are: for compliant fractures, Zt = 4.04*10-10 m/Pa, Zn = 3.46*10-10 m/Pa, and for stiff fractures, Zt = 8.67*10-11 m/Pa, Zn = 7.42*10-11 m/Pa. Figure 3 shows the synthetic seismograms parallel and perpendicular to the fracture strike for the DFM and EMM. Note that the DFM results in a complicated section with the seismic energy scattered from and between individual fractures.
3. AVO Analysis
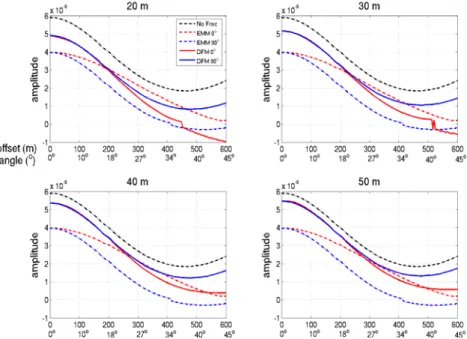
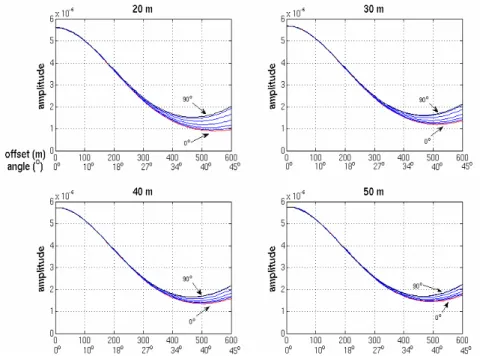
We analyze the AVOaz perpendicular (defined as 0 degree) and parallel (defined as 90 degrees) to the fracture strike for both the EMM and DFM synthetics. We first window the PP reflection from the top of the reservoir, and then pick the maximum amplitude in each window for each azimuth over a range of offsets. Figure 4 shows the comparison of AVOaz perpendicular and parallel to the compliant fracture strike for the EMM and DFM. Figure 5 shows the same comparison for stiff fractures. We then study the AVOaz magnitude by subtracting the absolute values of amplitudes in the perpendicular and parallel directions and then taking the absolute values of the difference. We then normalize the difference values by the sum of the parallel and perpendicular amplitudes. Figure 6 shows the normalized differences of AVOaz magnitudes for the compliant fractures while Figure 7 shows the same plots for the stiff fractures. Finally, we analyze the AVOaz every 15 degrees from perpendicular to parallel to the fracture strike using DFM synthetics (Figure 8 and 9).
4. Discussion
4.1 AVOaz comparison
Even when the fracture spacing is comparable to the seismic wavelength, we observe the effect of discrete fractures on the seismic amplitude of PP reflection from the top of the reservoir. From the AVOaz obtained from the EMM (Figure 6 and 7), we see that the maximum AVOaz effect of fractures is at offsets (angle of incidence) of about 35 degrees. However, the AVOaz obtained from the DFM becomes more prominent as offset increases from 30 to 45 degrees (Figure 6 and 7), especially for compliant fractures. For stiff fractures, though the contrast between fractures and background medium is small, we still observe the effect.
Based on the differences between the EMM and the DFM results, it is clear that the type of model assumed for the subsurface will play a very important role in the interpreted fracture properties. If the fractures are distributed as discrete zones, but we try using an effective media model to invert for the fracture properties such as crack density, we might get a very low average crack density in the whole fractured layer. Actually, the crack density in each single fracture in this case would be much higher than the inversion estimate. Such low estimates could incorrectly bias our interpretation of the reservoir fluid flow capacity.
When we look at the AVOaz behavior for the DFM in more detail (Figure 8), we also observe a phase change at offsets (incidence angles) larger than 35 degrees for compliant fractures. The offset at which the phase change occurs also varies with fracture spacing and azimuth. But for stiff fractures, no phase change is observed (Figure 9). Such phase changes, with proper calibration, could provide a means for characterizing fracture compliance.
4.2 AVOaz in directions perpendicular and parallel to fracture strike
For the DFM, we observe that the amplitude in the direction perpendicular to the compliant fracture strike (0 degree) is smaller than that in the parallel direction (90 degrees) (Figure 4). However, for the EMM, the opposite trend is seen for middle to far offsets. But for stiff fractures, the EMM and DFM show the same trend of AVOaz, that is amplitudes increase from 0 to 90 degrees (Figure 5). These results again point out that the choice of model is critical in interpreting any measured field data. For the compliant fracture synthetic data (Figure 4), very different fracture orientation estimates would result if we used the incorrect model type.
Another observation is that the AVOaz magnitude predicted by the DFM is larger than that of the EMM for offsets larger than 40 degrees for compliant fractures with spacings greater than 20m (Figure 6). Lynn (2004b) has observed that in the analysis of field data the AVOaz magnitude is usually much larger than theoretical prediction by EMM. She suggests that this effect could be the result of larger scale fractures. Our synthetic results provide some support to that hypothesis.
For the DFM, we also see that the fracture spacing affects the AVOaz magnitude. The larger the spacing is, the smaller the magnitude at the same offset (Figure 4). This is a direct result of the model definition. As mentioned previously, the crack density is the same for the entire reservoir in the EMM and within each discrete fracture zone in the DFM. As the fracture spacing decreases, the DFM approaches the EMM. In the limit of zero spacing the two models would be equivalent.
Finally, the AVOaz magnitude gradually increases with azimuth for the DFM results (Figure 8 and 9). We find AVOaz from far offset data are more sensitive to fracture properties, such as compliance and spacing.
5. Conclusion
We compare the AVOaz magnitudes using effective media (EMM) and discrete fracture (DFM) models. We assume that the crack properties are the same for both models, with the cracks distributed throughout the fractured layer for the EMM and clustering on discrete single fracture zones for the DFM. For the DFM fracture lengths and spacings are comparable to the seismic wavelength. Based on synthetic waveforms generated by finite difference calculations we see that the AVOaz of the PP reflection from the top of a fractured reservoir is affected differently by distributed and discrete fracture distributions. Results from EMM show that around 30 degrees offset the magnitude of AVOaz is a maximum, but the DFM results show larger AVOaz magnitude with farther offsets. Fracture orientation extracted from AVOaz based on the EMM and DFM could differ by 90 degrees for compliant fractures. In the model of compliant fractures we also observe phase changes at offsets larger than 35 degrees.
We thank Xander Chapman for their helpful review and discussions. We also thank the Founding Members of the MIT Earth Resources Laboratory for their support, and DOE award No. DE-FC26-02NT15346.
7. References
Coates, R. T. and Schoenberg, M., 1995, Finite-difference modeling of faults and fractures, Geophysics, 60, 5, 1514-1526.
Liu, E., Hudson, J. A., and Pointer, 2000, T., Equivalent medium representation of fractured rock, J. Geophy. Res.,105, 2981-3000.
Lynn, H. B., 2004, The winds of change: Anisotropic rocks—their preferred direction of fluid flow and their associated seismic signatures—Part 1, The Leading Edge, 1156-1162.
Lynn, H. B., 2004, The winds of change: Anisotropic rocks—their preferred direction of fluid flow and their associated seismic signatures—Part 2, The Leading Edge, 1258-1168.
Marcinkovich, C. and Olsen, K., 2003, On the implementation of perfectly matched layers in a three-dimensional fourth-order velocity-stress finite difference scheme, J. Geophy. Res., 108, B5, ESE 18-1 - 18-16.
Saenger, E. H. and Bohlen, T., 2004, Finite-difference modeling of viscoelastic and anisotropic wave propagation using the rotated staggered grid, Geophysics, 68, 2, 583-591.
Schoenberg, M. and Sayers, C. M., 1995, Seismic anisotropy of fracture rock, Geophysics, 60, 1, 204-211.
Shen, F., Zhu, X., and Toksoz, M.N., 2002, Effects of fractures on NMO velocities and P-wave azimuthal AVO response, Geophysics, 67, 3, 711-726.
Willis, M. E., Rao, R., Burns, D., Byun, J., and Vetri, L., 2004, Spatial orientation and distribution of reservoir fractures from scattered seismic energy, 74th Ann. Internat. Mtg. Soc. Expl. Geophys., Expanded Abstracts, 278-281.


