Activity and stability of cobalt phosphides
for hydrogen evolution upon water splitting
The MIT Faculty has made this article openly available.
Please share
how this access benefits you. Your story matters.
Citation
Ha, Don-Hyung et al. “Activity and Stability of Cobalt Phosphides
for Hydrogen Evolution Upon Water Splitting.” Nano Energy 29
(November 2016): 37–45 © 2016 Elsevier Ltd
As Published
http://dx.doi.org/10.1016/j.nanoen.2016.04.034
Publisher
Elsevier
Version
Author's final manuscript
Citable link
http://hdl.handle.net/1721.1/118893
Terms of Use
Creative Commons Attribution-NonCommercial-NoDerivs License
1
Activity and Stability of Cobalt Phosphides for Hydrogen Evolution Upon Water
Splitting
Don-Hyung Ha†#, Binghong Han§#, Marcel Risch†#, Livia Giordano†‡, Koffi P. C. Yao∥,
Pinar Karayaylali∥, and Yang Shao-Horn*†§∥
†Research Laboratory of Electronics, §Department of Materials Science & Engineering,
∥Department of Mechanical Engineering,
Massachusetts Institute of Technology, Cambridge, Massachusetts 02139, United States
‡ Dipartimento di Scienza dei Materiali, Università di Milano-Bicocca, Milano, Italy
# Contributed equally
---
Corresponding Author
2 TOC
Abstract
Late transition metal phosphides have been reported to have high activity for catalyzing hydrogen evolution reaction (HER), yet their active site and stability are not well-understood. Here we report systematic activity and stability study of CoP for HER by combining electrochemical measurements for CoP nanoparticles (NPs) with ex situ and in situ synchrotron X-ray absorption (XAS) spectroscopy at phosphorus and cobalt K edges, as well as density functional theory (DFT) calculations. Colloidally synthesized CoP NPs showed high HER activity in both acid and base electrolytes, comparable to previous work, where no significant pH dependence was observed. Transmission electron microscopy-energy dispersive spectroscopy study of CoP NPs before and after exposure to potentials in the range from 0 to 1.4 V vs. the reversible hydrogen electrode (RHE) revealed that the P/Co ratio reduced with increasing potential in the potentiostatic measurements prior to HER measurements. The reduced P/Co ratio was accompanied with the emergence of (oxy)phosphate(s) as revealed by XAS, and reduced specific HER activity, suggesting the important role of P in catalyzing HER. This hypothesis was further supported by DFT calculations of HER on the most stable (011) surface of CoP and voltage dependent intensities of both phosphide and phosphate components from P-K edge X-ray spectroscopy. This work highlights the need of stabilizing metal phosphides and optimizing their surface P sites in order to realize the practical use of metal phosphides to catalyze HER in electrochemical and photoelectrochemical devices.
Key words
3 Research Highlights
- Phosphorus (P) leaches from CoP nanoparticles as phosphate (P5+) at potentials above 0.4 V vs.
reversible hydrogen electrode (RHE).
- CoP nanoparticles transform to (oxy)phosphates upon exposure to high voltages. - Both phosphide (P3-) and phosphate (P5+) responded to applied potentials as shown by
synchrotron X-ray spectroscopy
4 Introduction
Efficient hydrogen production by water electrolysis is a crucial electrochemical reaction since hydrogen is a key energy carrier having a large energy density [1]. Pt is considered as the most active electrocatalyst for the hydrogen evolution reaction (HER) while practical application is hindered by its high cost and limited supply. Over the last few decades, tremendous efforts have been made to explore new electrocatalysts beyond Pt-based materials. Particularly, a few classes of materials have been studied as potential alternative HER catalysts such as metal sulfides and selenides, which show high HER activity (Table S1) [2-6]. Recently metal phosphides have gained renewed interest as alternative materials for HER catalysts due to high activity compared to other non-precious metal catalysts and relatively low cost compared to Pt [7-12]. Generally, metal phosphide show lower overpotential during HER (~55-170 mV at 10mA∙cm-2) than metal sulfide and selenides (~130-270 mV at 10mA∙cm-2, Table S1). However, unlike the
well-studied metal surfaces [13-18], the HER mechanism on metal phosphides is less understood, which is essential for optimizing the catalytic surface in order to further improve the HER activity and stability of metal phosphide catalysts.
On metal surfaces, Gerischer [19] and Parsons [20] have discussed the influence of binding on the HER activity, where hydrogen binding must be neither too strong nor too weak for optimal activity according to the Sabatier’s principle [21]. The first volcano trend with experimental data was later constructed by Trasatti [22] who used the hydride enthalpy of formation as a proxy for hydrogen binding on the active site. More recently, using density function theory (DFT), Nørskov and coworkers [23] have correlated experimental exchange currents with calculated hydrogen adsorption energies on metals, where maximum activity is obtainable when the free energy change of hydrogen adsorption is zero. Generally speaking, HER on the metal site (M) in acid proceeds with an initial adsorption and discharge of H+ (Volmer step) [24],
followed by either adsorption of H on M-H (Heyrovsky step) [25] or combination of two M-H groups (Tafel step) [26]. If the combination of M-H is limiting, a Tafel slope of 29 mV/dec (at room temperature) can be calculated from microkinetic analysis [27]. Adsorption of H+ on M-H yields 39 mV/dec and if the initial
adsorption is limiting, 118 mV/dec can be expected, regardless of subsequent reaction steps [27]. In alkaline electrolytes, some controversy exists whether H2O or H+ participates in the Volmer and Heyrovsky steps
[15, 28]. Dusan et al. [29] and Herranz et al. [30] review interfacial, electrolyte and pH effects on HER on metal surfaces in this Electrocatalysis Special Issue. We refer the reader to these contributions for an overview of current developments regarding descriptors for metal catalysts and pH-dependent mechanisms on metals.
5 Recently limited studies were reported on the volcano trend and optimal surface structures of the HER in metal chalcogenides and metal phosphides [10, 31, 32]. Using a combination of experimental and theoretical methods, the (101) surface of Fe0.5Co0.5P was identified as having the highest HER activity
among metal phosphides due to nearly optimal hydrogen binding strength based on their volcano relationship [10]. However, unlike the well-studied HER mechanism on metal surfaces, HER mechanism on metal phosphides and chalcogenides is not fully understood. For layered metal chalcogenides [31], adsorption of H on X-H (X= metal or S, Se) has been predicted by DFT as the most-likely reaction mechanism. This “Volmer-Heyrovsky” mechanism is also supported by experimental Tafel slopes around 40 mV/dec, e.g. for MoSx [31]. However, for metal phosphides, Tafel slopes of 50-60 mV/dec are most
commonly reported [10, 33], which cannot be reconciled with the established reaction steps on metal surfaces. Thus, further mechanistic studies are needed to understand the HER catalysis on metal phosphides.
Aside from catalytic activity, side reactions can affect experimental Tafel slopes. A highly undesirable side reaction is electrochemical redox followed by dissolution of the produced species. Very recently DFT studies of metal chalcogenides have shown an inverse relationship between H binding (activity) and HX binding (stability) on the surfaces [31], suggesting that poor stability could be another important issue for the development of metal phosphide as the highly active HER catalysts. Therefore, studying stability is also required to optimize the conditions for HER catalysis using metal phosphides.
In this work, we provide new insights into the active sites and stability of CoP nanoparticles (NPs) for HER through experiments and density functional theory (DFT) calculations. CoP NPs exhibit high HER activity in both acid and base electrolytes. Unfortunately, exposure to potentials above 0.4 V vs. the reversible hydrogen electrode (RHE) before HER reduces HER activity. Co-K edge X-ray spectroscopy has revealed the emergence of (oxy)phosphates at positive potentials above 0.4 V vs. RHE. Furthermore, P-K X-ray spectroscopy shows a voltage dependence of both phosphide and phosphate components, indicating that P plays a vital role for HER catalysis. This critical role of P is further supported by DFT calculations showing that the P site could be the active site for the HER. The insight in this paper provides a framework for HER on metal phosphides and guidelines for the optimization of metal phosphide HER catalysts.
6 Results and discussion
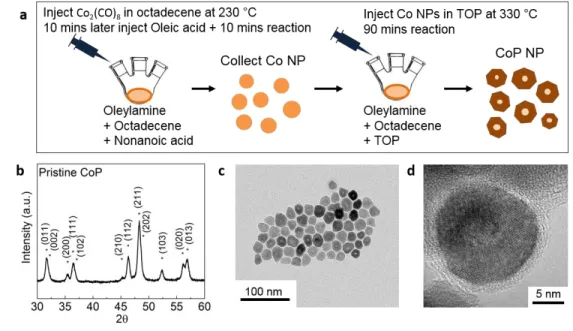
In this paper, CoP NPs were synthesized in two steps using a colloidal method similar to previous work [7] (Figure 1a). Firstly, cobalt NP was synthesized by Co2(CO)8 (dicobalt octacarbonyl) in 1-octadecene
injection into the solution of oleylamine, 1-octadecene, and nonanoic acid at 230 °C (see details in the experimental section). Secondly, cobalt NPs were sequentially converted to CoP NPs through the reaction with tri-octylphosphine (TOP) at an elevated temperature (~330 °C). X-ray diffraction (XRD) results confirmed that these CoP NPs had an orthorhombic unit cell having space group of Pnma (Figure 1b), where no secondary phase was detected. Transmission electron microscopy (TEM) images show that CoP NPs have an average particle size of 18±3 nm (Figures 1c, 1d and S1), and Brunauer–Emmett–Teller (BET) measurement shows a surface area of ~34 m2/g. Our CoP NPs have a semi-spherical shape, with a hollow
or thin core based on TEM images, which can be attributed to the nanoscale Kirkendall effect during the transformation from cobalt to CoP as reported previously [34]. An amorphous layer on the surface of CoP NPs was observed by high-resolution TEM (HRTEM, Figure 1d). The energy dispersive spectroscopy (EDX) data taken on the amorphous surface layer (with a beam spot < 1 nm in diameter) showed a P/Co ratio of ~0.6 with no carbon or oxygen signal. The amorphous shell could be some leftover reactant adsorbed to the surface. Meanwhile, EDX showed that the pristine CoP crystalline particles have a P/Co ratio of ~0.82, implying a deficiency of P from the CoP stoichiometry, which is also confirmed by XAS results that will be discussed later.
Figure 1 Synthesis and characterization of CoP NPs. (a) Schematic diagram of the two-step synthesis route toward CoP NPs. (b) XRD pattern of pristine NP sample matches CoP with space group Pnma with lattice parameters of a, b, and c as 5.08, 3.28, and 5.59 Å, respectively (see details in experimental section)
7 [35]. (c) TEM image showing relatively uniform particle sizes with a mean diameter of ~18 nm in size (see histogram in Figure S1). (d) HRTEM image showing thinned centers of CoP NPs as compared to edge regions.
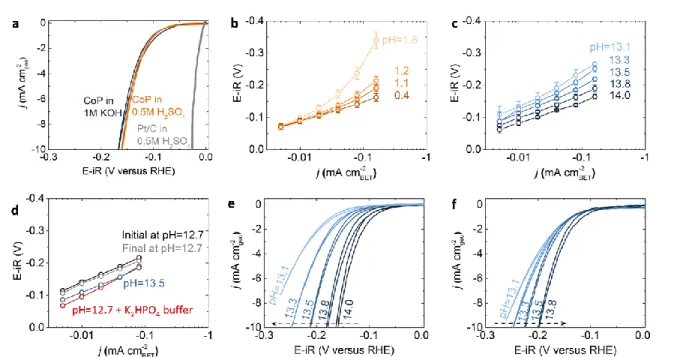
Figure 2 Cyclic voltammetry (CV) and Tafel plots for the HER of CoP NPs at different pHs with the upper voltage limit of +0.1 V vs. RHE. (a) CV scans were performed at a sweep rate of 10 mV/s for CoP NPs in acid (orange, 0.5 M H2SO4 and pH = 0.4) and in base (dark blue, 1 M KOH, pH = 14.0) with the
loading of 180 μgCoP/cm2geo, as well as Pt NPs (grey, 0.5 M H2SO4 and pH = 0.4) with the loading of 20
μgpt/cm2geo for comparison (see details in experimental section). Tafel slope changes of CoP NPs show
distinct behaviors depending on pH in (b) acid (H2SO4) and (c) alkaline (KOH) solution. The error bars in
(b) and (c) represent the standard deviation of at least three measurements. (d) Starting from pH 12.7 electrolyte (black), after adding 0.22 M of K2HPO4 (red), the specific HER activity was increased and
became similar to the activity measured at pH 13.5 (blue). When coming back to the original pH 12.7 electrolyte without K2HPO4 (grey), the activity also returned back to the initial value CV measurements
showed apparent pH-dependent activity in alkaline, which is more pronounced by scanning from high pH to low pH (e) than from low pH to high pH (f), where the dashed arrow indicates the direction of pH changes during the measurements. All the CoP loadings in this figure were 180 μg/cm2
geo. All CV data were both
8 CoP NPs were found to exhibit comparably high specific HER catalytic activities in acid (0.5 M H2SO4)
and in base (1 M KOH), as shown in the cyclic voltammetry (CV) measurements in Figure 2a. Specific activity of HER, which was estimated based on the BET surface area of CoP NPs, were greater than 100 μA/cm2
BET and ~8 mA/ cm2geo at -0.15 V vs. RHE. When the same loading amount is used as the previous
work (0.9 mg/cm2
geo, Figure S2), the comparable geometric activity of our CoP NPs was observed to
previous work, which has ~20 mA/cm2
geo at -0.1 V vs. RHE [7].
No significant pH dependence in the specific HER activity of CoP NPs in acid (H2SO4) nor base (KOH)
was observed, as shown in Figures 2b and 2c. Comparable activities with Tafel slopes of ~60 mV/dec were found from pH 0.4 to 1.8 at low currents (< ~20 μA/cmBET2 ). At high currents in acid, the Tafel slopes increased from ~60 mV/dec to ~200 mV/dec, which was most pronounced for pH 1.8. This increase of Tafel slopes at high currents could be attributed to the local pH change during HER since the NP film and electrolyte were quiescent during the measurement. With increasing pH in acid moving away from the pKa
of H3O+/H2O (pKa = 0), the electrolyte buffering capacity for H3O+ becomes weaker, and thus the local pH
on the CoP surface can differ from the bulk pH due to the local consumption of H3O+ at high HER current
densities, which can result in the increase in the Tafel slope with increasing pH. On the other hand, with increasing pH from 13.1 to 14.0 in basic solution (Figure 2c), the Tafel slope was decreased from 111 to 66 mV/dec, which is accompanied with an increase of the specific HER current by one order of magnitude. The observed increase in the HER current with increasing pH in basic solution can be attributed to increasing buffering capacity at pH close to the pKa of H2O/OH- (pKa = 14). This hypothesis is supported
by an experiment where adding 0.22 M of K2HPO4 (pKa = 12.7 for HPO42-/PO43-]) into the KOH electrolyte
with pH 12.7 increased the HER activity to a value similar to that measured at pH 13.5 (Figure 2d). Without sufficient buffering to support HER, the local pH near the catalyst surface might be much higher than the bulk pH in the electrolyte during the HER, which decreased the relative thermodynamic driving force (overpotential) during the HER and therefore lead to lower HER current. The hydrogen evolution reaction in alkaline solution can be written as following equation:
2H2O + 2e- → H2 + 2OH
-Although the HER activity of CoP was found stable at HER potentials (-0.1 V and -0.16 V vs. RHE) from potentiostatic measurements (Figure S3), degradation in the HER activity of CoP might occur over time at higher potentials. CV sweeps up to +0.1 V vs. RHE (Figure 2) could induce oxidation of CoP and reduce the activity (further discussed later). Degradation over time and less buffering at lower pH could lead to larger pH dependence when the measurements were performed from high pH to low pH (Figure 2e and S4). On the contrary, when the activity was measured from low to high pH, the degradation of CoP NPs can
9 mask the gain in the HER current if any associated with greater buffering of the electrolytes at higher pH, leading to negligible activity differences when varying pH (Figure 2f).
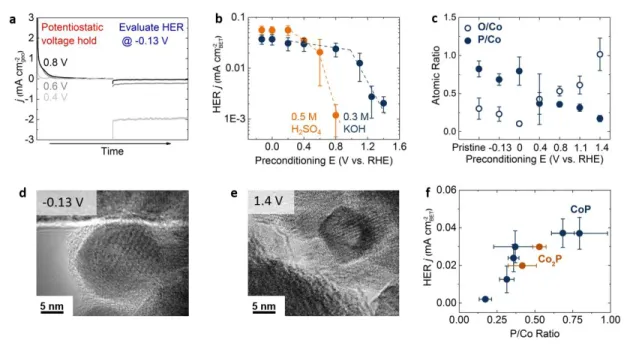
Figure 3 Effects of potential exposure on the HER activity in H2-saturated acid (0.5 H2SO4) or alkali
(0.3 M KOH) electrolyte. (a) Geometric current density from potentiostatic holding for 20 min and subsequent HER activity measurements evaluated at -0.13 V vs. RHE in acid solution. The loading of CoP was 180 μgCoP/cm2geo. (b) Specific HER activity in acid and base as a function of holding potential prior to
HER activity measurements. (c) P/Co and O/Co ratios obtained from TEM EDX analysis before and after potentiostatic holding at various potentials for 20 min in basic solution (0.3M KOH). The error bars in (b) and (c) represent the standard deviation of at least three measurements. HRTEM images of CoP after potentiostatic holding at (d) -0.13 V and (e) 1.4 V vs. RHE. (f) Specific HER currents in alkali solution at -0.13 V vs. RHE as a function of P/Co ratio obtained from TEM-EDX showing that higher P concentration leads to higher specific HER activity. All specific HER currents were normalized by BET surface area.
HER activity of CoP NPs in acidic and basic solution was found to decrease with increasing potential in the prior potentiostatic holding step. Oxidative current densities in the potentiostatic holding (for 20 min), increased with potential, which is accompanied with subsequent reduced HER current density measured at -0.13 V vs. RHE in both acid and base solutions, as shown in Figure 3a and S5. The figure 3a shows the current changes in the sequential experiment of preconditioning step and HER evaluation step with various preconditioning potentials. The CoP NP samples were stable for 30 min at HER operation conditions both in acid and alkaline (Figure S3). Specific HER activity was found to reduce significantly at potentials
10 greater than 0.4 V vs. RHE in both acidic and basic solution (Figure 3b), which can be attributed to severer oxidation of CoP at higher potentials. Therefore, this result suggests that controlling the operation potential of CoP NPs is critical to prevent activity degradation and maintain its HER catalytic performance, especially considering that the open circuit voltages of CoP NPs in H2-saturated acidic and basic solution
are 0.3 and 0.7 V vs. RHE, respectively. Interestingly, the potential for significant loss in the specific HER activity is lower in acid than that in basic solution, which might be attributed to dissolution of oxidized species of CoP NPs. Dissolution at these potentials did not occur or was much slower in basic solution.
The reduction in the specific HER activity of CoP NPs in Figure 3a can be attributed to the loss of P in the potentiostatic step at 0.4 V vs. RHE and greater. Through ex situ TEM EDX, the chemical compositions were examined for the pristine CoP NPs and the NPs right after potentiostatic holding at various potentials from -0.13 to 1.4 V vs. RHE in alkaline electrolytes. As shown in Figure 3c, in alkaline solution, CoP NPs held at -0.13 and 0 V vs. RHE, had P/Co (solid circles) and O/Co (open circles) ratios comparable to pristine CoP, indicating that CoP was stable up to 0 V vs. RHE. Further support came from HRTEM images, which revealed that there was no noticeable NP shape change (Figure S6, >100 particles examined). However, holding at 0.4 V vs. RHE and greater led to decreased P/Co and increased O/Co ratios collected from CoP NPs, indicating gradual oxidation of CoP NPs by formation of (oxy)phosphate moieties. While no significant morphological changes were noted for low potentials of potentiostatic holding such as 0.4 V vs. RHE (Figure S6), CoP NPs held at 1.4 V vs. RHE were found to have smaller size (Figure 3e). The morphology changes indicate that high potentials could lead to chemical transformation and structural reconstruction. On the other hand in acid electrolytes, although holding at higher voltages (> 0.6 V vs. RHE) also lead to clear HER activity drop (Figure 3b), there is no clear reduction of P/Co ratios (Figures S7) from EDX results. This likely resulted from the dissolution of the surface layer of CoP in acid electrolytes. Therefore, the surface oxidation of CoP in acid electrolyte may lead to the decrease of total catalytic surface area and the sequential decrease of HER activity, but does not change the surface chemistry noticeably.
Higher specific HER activity in alkaline solution was found to correlate strongly with increasing P/Co ratio, as shown in Figure 3f. Additionally, Co2P NPs (Figure S8) exhibited activities falling into this
correlation trend. This observation implies that raising the ratio of P to Co is critical to achieve high specific HER activity, which is in agreement with recent studies showing higher specific HER activity on P-rich metal phosphides than on metal-rich phases [36, 37]. On the other hand, increasing the O/Co ratio (Figure 3c) was concomitant with reduction in activity (Figure 3b). CoP NPs held at 1.4 V vs. RHE with low P content showed negligible HER catalytic activity (<0.005 mA/cm2
BET). Therefore, the oxidized species
11 Figure 4 XAS spectra and trends at the P-K and Co-K edges. (a) Ex-situ X-ray absorption near edge structure (XANES) of the P-K edge at different preconditioning potentials showing spectral changes with applied potentials in H2-saturated 0.3 M KOH. The loading of all ex situ XAS samples was 360 μg/cm2geo.
The base lines used to determine peak areas are shown for the sample, held at 1.4 V vs. RHE and then potential shifted to -0.12 V vs. RHE, as an example. (b) P5+ and P3- peak area as a function of the potentials
applied before XAS measurements. Open triangles and open circles represent P3- and P5+ peak area,
12 RHE are labeled in green as 2.5, 2.3, and 1.0 mA/cm-2
geo, respectively. (c) Fourier transformed (FT)
extended X-ray absorption fine structure (EXAFS) spectra of the Co-K edge obtained from in situ measurements with a loading of 360 μgCoP/cm2geo in fluorescence mode showing emergence of a new
Co-Co vector (gray line). (d) Increasing abundance of the Co-Co-Co-Co vector at different voltages from the in situ measurements (Voltage sequence: -0.2, +0.2, +0.4, +0.6, +0.8, +1.1, +1.4, +0.8, +1.4, +1.6, -0.2 V vs. RHE ).
The electronic structures of CoP NPs with high and low HER activity (i.e. high and low P/Co ratio) were contrasted by ex situ XAS at the P-K edge to gain insights into the origin of activity and instability. Figure 4a shows the P-K XANES spectra of CoP pristine and after potentiostatic holding at select voltages in 0.3 M KOH. Two peaks were observed, corresponding to the hybridization of P3- 3p and Co 3d orbitals
in phosphides at ~2142.5 eV [38, 39], and that of P5+ sp3 with O 2p orbitals (t
2*) such as PO43- anions in
phosphates at ~2150 eV [40]. The position of the P3- peak was close to that of Co
2P [38], which indicates a
slight P deficiency, while the P5+ peak indicated oxidation of the pristine sample. The areas under these
peaks where further analyzed for samples prepared at one potential (same protocol as TEM/EDX preparation) and samples prepared at a preconditioning potential followed by HER at -0.12 V vs. RHE (Figure S9). Increasing the voltage from -0.12 (including 0.4 V/HER and 1.4 V/HER) to 0.4 V to 1.4 V led to higher intensity of the P5+ peak (Figure 4b and Figure S10). Since comparable areas were found for CoP
in the pristine state and held at 0.4 V vs. RHE, the voltage trend indicates that a phosphate-like species was formed from CoP at high voltages and disappeared at low voltages, possibly by dissolving of phosphate anions. As a result from this, the difference between the area of the P5+ peak before and after HER (e.g. 0.4
V vs. 0.4 V/HER in Figure 4b) correlated with HER activity, where a small difference (0.4 V to 0.4 V/HER) lead to higher activity of 2.3 mA/cm2
geo as compared to a large difference (1.4 V to 1.4 V/HER ) for lower
activity of 1.0 mA/cm2
geo. The magnitude of changes of the area under the P3- peak was less prominent but
a clear monotonic decrease with pre-conditioning potential could be identified. Remarkably, HER did not significantly change the area for pristine to -0.12 V and for 1.4 V to 1.4 V/HER. The change from the sample held at 0.4 V to that first held at 0.4 V and then HER at -0.12 V vs. RHE appears to break this trend but we caution that this potential marks the onset of CoP oxidation as determined by EDX (Figure 3c). It should be mentioned that noticeable changes in the P-K XANES of CoP nanoparticles as a function of voltage (Figure 4), suggest considerable changes in the compositions on the surface and bulk of CoP particles, which is consistent with TEM results in Figure 3. To summarize, the amount of P5+ species
increased at positive voltages vs. RHE, and decreased after shifting the potential to the HER voltages (e.g. -0.12 V vs. RHE), while the P3- species are less sensitive to the applied potentials.
13
In situ Co-K edge measurements were performed in basic solution (0.3 M KOH) to elucidate the
structural changes during the oxidation process of CoP NPs. Figure 4c shows that as the potential increased, the peak intensity at ~2.9 Å (reduced distance, ~ 3.1 Å real distance) also increased, likely corresponding to edge-sharing Co-Co octahedra in (oxy)phosphates such as LiCo2P3O10 and Co2P2O7 [41, 42] (Table S2
and Figure S11). Pronounced oxidation of CoP NPs in basic solution at voltages greater than 1.4 V vs. RHE is in good agreement with previous work on the formation of active metal-oxide surfaces from metal phosphides for the oxygen evolution reaction [43, 44]. The (oxy)phosphate formation upon increasing the potential matches the increased O/Co ratio based on EDX analysis (Figure 3c). Furthermore, the Co-Co FT peak assigned to (oxy)phosphate increased as a function of in situ measurement time (Figure 4d), implying that the (oxy)phosphate components cannot be reduced easily even under negative potential (-0.2 V vs. RHE). We note that a short unavoidable open-circuit period (~ 0.7 V vs. RHE in 0.3 M KOH) after insertion of the electrolyte caused the initial difference between the pristine sample (measured without electrolyte, red curve in Figure 4c and red line in Figure 4d) and the FT peak height at the initial potentials (Figure 4c,d). These in situ Co-K edge XAS results indicate that cobalt (oxy)phosphate structure formation might be time sensitive in KOH solution, leading to continuous degradation in addition to the voltage dependence discussed above. In summary, the XAS experiments showed the formation of (oxy)phosphate(s) by Co-K edge EXAFS and via the P5+ peak in the P-K XANES, which corresponds to the PO
4 motif.
Figure 5 Hydrogen adsorption free energy on different facets of CoP. Adsorption free energy is calculated (a) on (011) and (b) on (101) surfaces. Insets in (a) and (b) show the top view of the most stable
14 configurations on the corresponding surfaces. White, blue, and black atoms correspond to P, Co, and H, respectively.
To gain insights in the nature of CoP active site for HER, we performed DFT calculations. We first analyzed which facets are most likely exposed by the CoP NPs. Table S3 reports the computed surface energies of different orientations of Pnma CoP low-index surfaces. The surface energy increases in the order (011) < (101) < (111) < (001) = (010) < (110) < (100). On the most stable facets, the hydrogen adsorption free energies were calculated at different sites (Figures 5a, 5b, and S12). It is interesting to note that on the most stable surface the adsorption of hydrogen on the P site is almost thermo-neutral, as shown in Figure 5a. This means that on the P site HER is thermodynamically more favorable than that on other sites such as Co site or Co bridge, since the H intermediate binds neither too weakly nor too strongly (i.e. Sabatier Principle) [10]. This thermo-neutral P site result suggests that the active site on a (011) surface is P rather than the transition metal, which is conventionally assigned to be the active site. Noteworthy, a different adsorption site is found on the (101) surface where hydrogen is in a bridging position between two Co atoms, as shown in Figure 5b, which is in agreement with previous studies [10]. This site has a similar adsorption free energy as compared to the P site on the (011) surface, suggesting that if this surface is also exposed there will be a competition between different active sites at the different facets. It is interesting to note that on this surface also other sites, like the P-Co bridge site, have adsorption free energies lower than 0.1 eV, suggesting that they could be potentially active. The presence of a variety of adsorption sites not too far from each other (Figure S12) could help reducing the barrier for combination of two adsorbed protons (Tafel step), which was shown to be exceptionally high (≥ 1.5 eV) on MoS2 where a large distance
separates the hydrogen adsorption sites [31]. In general, the surface P site plays very important role in HER either as the direct adsorption site or part of the bridging site, and therefore the specific HER activity of CoxP would greatly depend on the surface P content. The DFT calculations corroborate the important role
of P for HER on CoP in agreement with experimental results showing the strong correlation between the specific HER activity and the P/Co ratio (Figure 3e).
Conclusions
We have investigated the activity and stability of CoP for HER by electrochemical measurements, TEM, EDX, ex situ and in situ XAS measurements, as well as DFT calculations. The HER activity of CoP is found to be reduced with potentiostatic holding at potentials above 0.4 V vs. RHE. This activity loss was accompanied by leaching of P and lowered Co/P ratio suggested by EDX results. The formation of
15 (oxy)phosphate(s) emerges concomitant with activity reduction as indicated by the PO4 (P5+) signal in P-K
edge XAS and confirmed by in-situ Co-K edge EXAFS. Furthermore, DFT calculations indicate surface P could act as the active site for HER on CoP while P-K edge XAS suggest that it might be the P3- species,
which is in contrast to traditional HER mechanisms on the metal site. Further studies are needed to provide atomic insights into the active sites. Our results provide critical insights to the physical origin to HER activity on metal phosphides and the need to improve the stability during operation.
16 Experimental methods
CoP nanoparticle (NP) synthesis
CoP NP synthesis was carried out in an argon (Airgas, ultra high purity) atmosphere by employing standard Schlenk line and glove box techniques.Acetone (≥99.5%), isopropyl alcohol (≥99.5%), hexanes (≥ 98.5%), oleic acid (99%), octylphosphine oxide (TOPO, 99%), oleylamine (70%), tri-n-octylphosphine (TOP, 97%) and 1-octadecene (90%) were purchased from Aldrich. Nonanoic acid (97%) and Co2(CO)8 were purchased from Alfa Aesar.
The synthesis of CoP NPs is slightly modified from the standard procedure [7]. An Argon fluxed flask was filled with oleylamine (30 ml), 1-octadecene (50 ml), and nonanoic acid (10 ml). The solution was heated to 120 °C and kept under vacuum for 1 hour. The 500 mg of Co2(CO)8 dissolved in 1-ocadecene (22
ml) which is sonicated for 1 hour was slowly injected into the reaction solution at 230 °C. The solution was kept for 10 mins and degassed oleic acid (10 ml) was injected into the reaction solution. After the reaction progressed for another 10 mins, the heating mantle was removed and the reaction solution was cooled down. The Co NPs were washed twice with hexanes/isopropyl alcohol and centrifuged. The Co NPs were dispersed in 10 ml of trioctylphosphine (TOP).
To convert Co to CoP NPs, an Argon fluxed flask was filled with oleylamine (10 ml), 1-octadecene (5 ml), and TOP (15 ml). The solution was degassed at 120 °C for 1 hour under vacuum. The solution was then heated to 330 °C and kept for 40 mins. The Co NPs dispersed in 10 ml of TOP were injected into the reaction solution and the reaction was allowed to proceed for 90 mins. The solution was cooled to room temperature by removal of the heating mantle. The NPs were separated by centrifugation and washed twice with hexanes/acetone. The CoP NPs were dispersed in hexanes.
Electrochemical measurements
10 μl of NP solution with 3.5 mg/ml concentration were deposited on Ti foil (thickness: 0.25 mm, 99.75 from Aldrich) for electrochemical measurements. The actual area of NP film deposition was approximately 0.2 cm2. The NP film was heated to 450 °C and kept for 30 mins in a tube furnace under 5% H
2/Ar to
remove the surfactants on the NP surface. The removal of surfactant ligands is confirmed by Fourier transform infrared spectroscopy (FT-IR) (Figure S13). The Ti foil except the area where NPs are deposited was covered with chemically resistant paraffin wax (Aldrich). In base, glassy carbon was used for the electrode instead of Ti foil due to the background currents from Ti foil in alkaline solution.
17 Electrochemical measurements were carried out using a Biologic SP-300 unless otherwise noted. The electrolyte solutions were prepared using deionized water (Millipore, 18.2 MΩ cm) with KOH pellets (99.99%, Sigma-Aldrich) for base and H2SO4 (97%, Sigma-Aldrich) for acid. The pH of the solutions was
controlled by changing the concentration of KOH from 0.05 to 1M for base and H2SO4 from 0.01 to 0.5M
for acid. Saturated calomel electrode (SCE) and Pt with a glass frit were used as reference electrode and counter electrodes, respectively. The SCE reference electrode was calibrated with respect to RHE. Potentials were iR-corrected with the resistance obtained from electrochemical impedance spectroscopy measurements. All measurements were conducted in H2-saturated solution after 40 min of continuous
purging with H2 (Airgas, high purity). CV scans were performed at a sweep rate of 10 mV/s. Glassy carbon
was used as the working electrode support in basic solutions as it had no background currents in KOH solutions in the sweep range of -0.3 to 1.8 V vs RHE. Ti foil was used as a working electrode support in acid. The HER currents of the samples loaded on Ti foils were corrected by subtracting the background currents from blank Ti foils, where the background currents are roughly constant at the potentials below 0 V vs. RHE (Figure S14). In addition, the HER activity of Pt NPs was also measured for comparison. The Pt NPs (46% wt% supported by Vulcan carbon) were purchased from Tanaka Kikinzoku, and were dissolved in deionized water to make the catalyst ink. Then Pt NPs were drop-casted on a glassy carbon electrode with the loading of 20 μgpt/cm2geo. The CV scans were performed in H2-saturated 0.5 M H2SO4 at
10 mV/s, with a rotation speed of 1600 rpm.
Transmission Electron Microscopy and X-ray Diffraction
HRTEM was performed on a JEOL 2010F microscope operating at 200 keV, which is equipped with ultrahigh resolution polepiece and has a point resolution of 0.19 nm. The HRTEM samples for both pristine and after measurements were collected by scraping the particles off from the NP films using a TEM Cu grid. X-ray diffraction patterns were collected using a Rikagu Smartlab with Bragg-Brentano geometry. No bulk transformation was found after air exposure for three months (Figure S15). The digital images were analyzed using Gatan Digital Micrograph v2.01 (Gatan Inc.). Parallel-beam EDX was collected and the atomic compositions were determined using INCA (Oxford Instruments) software. For each sample, at least three different particles were used to collect the bulk chemical compositions, while three different spots with a diameter of ~ 1 nm at the particle edges were used to collect the surface chemical compositions. Error bars in all EDX data represent the standard deviation of the results on multiple spots. An example EDX spectrum is shown in Figure S16.
18 X-ray absorption spectroscopy
P-K and Co-K XAS was collected in fluorescence yield mode using a 4-element Vortex SDD detector in a helium atmosphere at the 9-BM-B beamline station (Advanced Photon Source). A double monochromator (Si-111) was used to scan the energy axis, which was calibrated by setting the first inflection point in the spectra of P2O5 to 2149 eV and Co foil to 7709 eV. All spectra were normalized by
the incident beam intensity obtained from an ionization chamber. Further normalization included fitting of a straight line to the pre-edge region and subtraction thereof over the whole scan range. The Co-K spectra were further normalized by division of a 2nd order polynomial fitted to the post-edge, while the average
intensity between 2175 and 2177 was set to unity for P-K spectra. Peak areas were extracted after subtraction of a linear baseline using the peak analyzer function in Origin. At least two spectra were recorded of each sample or condition to exclude beam drifts at the P-K edge and photo-damage at both edges. Operando experiments at the Co-K edge were performed with a home-made electrochemical cell (Figure S17) having a 100 µm thin glassy carbon working electrode, graphite counter electrode with area equal to the working electrode and a Harvard Instr. Ag/AgCl reference electrode (Figure S17). A CH Instruments potentiostats was used for in-situ measurements, where the following sequence of voltages was applied: -0.2, +0.2, +0.4, +0.6, +0.8, +1.1, +1.4, *, +0.8, +1.4, +1.6, -0.2 V vs. RHE. The electrolyte was replaced where marked by an asterisk. The cell was at OCV for a short period of time at the beginning of the experiment and after refilling the electrolyte; no data was taken during the OCV period.
DFT calculations
The surface energies and hydrogen adsorption properties were computed by means of density functional theory (DFT). We used a periodic approach, plane wave basis set (with cutoff set to 270 eV) and PBE exchange-correlation functional [45] as implemented in the VASP code [46, 47]. Core electrons were described with the Projector Augmented Wave (PAW) method [48]. The optimized Pnma lattice parameters (5.06 Å, 3.27 Å, 5.54 Å) of bulk CoP were used for the calculations. The reciprocal space was sampled with a (6×10×6) Monkhorst-Pack mesh for bulk calculations and equivalent meshes for surface calculations. The surfaces were described with slab models of about 20 Å thickness for the surface energy calculations and four CoP layer thickness for the H adsorption, which were verified to give converged results. The slabs were separated by at least 10 Å of vacuum and a dipole correction was applied in order to eliminate the residual dipoles in the direction perpendicular to the surface. The zero point energies and H2 entropic
19 Acknowledgements
This work was supported in part by BASF SE (award number 022278) and the Skoltech-MIT Center for Electrochemical Energy Storage. This research used resources of the Advanced Photon Source, a U.S. Department of Energy (DOE) Office of Science User Facility operated for the DOE Office of Science by Argonne National Laboratory under Contract No. DE-AC02-06CH11357. This work made use of the MRSEC Shared Experimental Facilities at MIT, supported by the National Science Foundation under award number DMR-1419807. This research also used resources of the National Energy Research Scientific Computing Center, a DOE Office of Science User Facility supported by the Office of Science of the U.S. Department of Energy under Contract No. DE-AC02-05CH11231.
20 References
[1] W. Lubitz, W. Tumas, Chem. Rev., 107 (2007) 3900-3903.
[2] J. Kibsgaard, Z. Chen, B.N. Reinecke, T.F. Jaramillo, Nat. Mater., 11 (2012) 963-969.
[3] A.B. Laursen, S. Kegnaes, S. Dahl, I. Chorkendorff, Energy Environ. Sci., 5 (2012) 5577-5591. [4] J. Bonde, P.G. Moses, T.F. Jaramillo, J.K. Norskov, I. Chorkendorff, Faraday Discuss., 140 (2009) 219-231.
[5] J.D. Benck, T.R. Hellstern, J. Kibsgaard, P. Chakthranont, T.F. Jaramillo, ACS Catal., 4 (2014) 3957-3971.
[6] Y. Shi, B. Zhang, Chem. Soc. Rev., (2016).
[7] E.J. Popczun, C.G. Read, C.W. Roske, N.S. Lewis, R.E. Schaak, Angew. Chem. Int. Ed., 53 (2014) 5427-5430.
[8] Q. Liu, J. Tian, W. Cui, P. Jiang, N. Cheng, A.M. Asiri, X. Sun, Angew. Chem. Int. Ed., 53 (2014) 6710-6714.
[9] E.J. Popczun, J.R. McKone, C.G. Read, A.J. Biacchi, A.M. Wiltrout, N.S. Lewis, R.E. Schaak, J. Am. Chem. Soc., 135 (2013) 9267-9270.
[10] J. Kibsgaard, C. Tsai, K. Chan, J.D. Benck, J.K. Norskov, F. Abild-Pedersen, T.F. Jaramillo, Energy Environ. Sci., 8 (2015) 3022-3029.
[11] J. Kibsgaard, T.F. Jaramillo, Angew. Chem. Int. Ed., 53 (2014) 14433-14437.
[12] Z. Huang, Z. Chen, Z. Chen, C. Lv, M.G. Humphrey, C. Zhang, Nano Energy, 9 (2014) 373-382. [13] W. Sheng, S. Chen, E. Vescovo, Y. Shao-Horn, J. Electrochem. Soc., 159 (2011) B96-B103. [14] W. Sheng, Z. Zhuang, M. Gao, J. Zheng, J.G. Chen, Y. Yan, Nat Commun, 6 (2015).
[15] J. Durst, A. Siebel, C. Simon, F. Hasche, J. Herranz, H.A. Gasteiger, Energy Environ. Sci., 7 (2014) 2255-2260.
[16] D. Strmcnik, M. Uchimura, C. Wang, R. Subbaraman, N. Danilovic, V. van der, A.P. Paulikas, V.R. Stamenkovic, N.M. Markovic, Nat Chem, 5 (2013) 300-306.
[17] R. Martínez-Hincapié, P. Sebastián-Pascual, V. Climent, J.M. Feliu, Electrochem. Commun., 58 (2015) 62-64.
[18] J. Durst, C. Simon, F. Hasché, H.A. Gasteiger, J. Electrochem. Soc., 162 (2015) F190-F203. [19] H. Gerischer, Bull. Soc. Chim. Belg., 67 (1958) 506-527.
[20] R. Parsons, Trans. Faraday Soc., 54 (1958) 1053-1063. [21] P. Sabatier, Ber. Dtsch. Chem. Ges., 44 (1911) 1984-2001.
[22] S. Trasatti, J. Electroanal. Chem. Interfacial Electrochem., 39 (1972) 163-184.
[23] J.K. Nørskov, T. Bligaard, A. Logadottir, J.R. Kitchin, J.G. Chen, S. Pandelov, U. Stimming, J. Electrochem. Soc., 152 (2005) J23-J26.
[24] T. Erdey-Gruz, M. Volmer, Z. Phys. Chem. A, 150 (1930) 203. [25] J. Heyrovský, Recl. Trav. Chim. Pays-Bas, 46 (1927) 582-585. [26] J. Tafel, Z. Phys. Chem, 50 (1905) 641.
[27] J.G.N. Thomas, Trans. Faraday Soc., 57 (1961) 1603-1611.
[28] N.M. Markovica, S.T. Sarraf, H.A. Gasteiger, P.N. Ross, J. Chem. Soc., Faraday Trans., 92 (1996) 3719-3725.
[29] D. Strmcnik, P.P. Lopes, B. Genorio, V.R. Stamenkovic, N.M. Markovic, Nano Energy, Electrocatalysis Special Issue.
[30] J. Herranz, J. Durst, E. Fabbri, A. Patru, X. Cheng, A.A. Permyakova, T.J. Schmidt, Nano Energy, Electrocatalysis Special Issue.
[31] C. Tsai, K. Chan, J.K. Nørskov, F. Abild-Pedersen, Surf. Sci., 640 (2015) 133-140. [32] C. Tsai, F. Abild-Pedersen, J.K. Nørskov, Nano Lett., 14 (2014) 1381-1387. [33] P. Xiao, W. Chen, X. Wang, Adv. Energy Mater., (2015) n/a-n/a.
[34] D.-H. Ha, L.M. Moreau, C.R. Bealing, H. Zhang, R.G. Hennig, R.D. Robinson, J. Mater. Chem., 21 (2011) 11498-11510.
21 [36] J.F. Callejas, C.G. Read, E.J. Popczun, J.M. McEnaney, R.E. Schaak, Chem. Mater., 27 (2015) 3769-3774.
[37] A.B. Laursen, K.R. Patraju, M.J. Whitaker, M. Retuerto, T. Sarkar, N. Yao, K.V. Ramanujachary, M. Greenblatt, G.C. Dismukes, Energy Environ. Sci., (2015).
[38] P.E.R. Blanchard, A.P. Grosvenor, R.G. Cavell, A. Mar, Chem. Mater., 20 (2008) 7081-7088. [39] R. Franke, Spectrochim. Acta, Part A, 53 (1997) 933-941.
[40] R. Franke, J. Hormes, Physica B, 216 (1995) 85-95.
[41] J.B. Anderson, E. Kostiner, F.A. Ruszala, Inorg. Chem., 15 (1976) 2744-2748. [42] B. El Bali, M. Bolte, Acta Crystallogr., Sect. E: Struct. Rep. Online, 58 (2002) 32-33. [43] L.-A. Stern, L. Feng, F. Song, X. Hu, Energy Environ. Sci., 8 (2015) 2347-2351. [44] J. Ryu, N. Jung, J.H. Jang, H.-J. Kim, S.J. Yoo, ACS Catal., 5 (2015) 4066-4074. [45] J.P. Perdew, K. Burke, M. Ernzerhof, Phys. Rev. Lett., 77 (1996) 3865-3868. [46] G. Kresse, J. Furthmüller, Phys. Rev. B, 54 (1996) 11169-11186.
[47] G. Kresse, J. Hafner, Phys. Rev. B, 47 (1993) 558. [48] P.E. Blöchl, Phys. Rev. B, 50 (1994) 17953.
22 Vitae
Don-Hyung Ha is a Postdoctoral Associate at the Electrochemical Energy Laboratory at Massachusetts Institute of Technology. He received his PhD degree in Materials Science and Engineering at Cornell University. His research focuses on understanding the fundamental mechanisms of electrochemical energy conversion and storage as well as designing nanomaterials controlled by chemical modulations.
Binghong Han is currently a Ph.D. candidate in Department of Materials Science and Engineering at Massachusetts Institute of Technology. He received his B.S. degree in Physics from the Peking University (2011). His research interests consist of oxygen electrocatalysis in aqueous system and in situ characterization techniques for electrochemical reactions.
23 Marcel Risch is a Senior Postdoctoral Associate at the Electrochemical Energy Laboratory at Massachusetts Institute of Technology. He received his PhD degree in Experimental Physics at Free University Berlin in 2011. His research interest is energy storage and conversion using earth-abundant materials, including stability of oxide surfaces during electrocatalysis, oxygen evolution and reduction on designed surfaces, solid reaction promoters for metal air batteries and development of operando methods to attain a molecular picture of reaction mechanisms. His research has previously been awarded with the Hans-Jürgen-Engell Prize (2015), the Carl-Ramsauer Award (2012) and the Gerhard Herzberg Memorial Scholarship (2007) among others.
Livia Giordano has been an assistant professor at the Material Science Department of University of Milano-Bicocca in Italy since 2007, and since September 2013 is also visiting professor at MIT. She obtained her PhD in Material Science from the University of Milano-Bicocca in 2002 and she was a visiting scientist at the CNRS of Marseille and the University College of London. After starting as an experimental scientist, her research has then focused on first-principles calculations of surface reactivity of oxides, and interfacial phenomena at metal-oxide and oxide-liquid interfaces.
Koffi Pierre Yao is currently a Ph.D. candidate in Mechanical Engineering at the Massachusetts Institute of Technology. He received his B.S. (2010) and M.S. (2013) degrees in Mechanical Engineering from the University of Delaware and MIT, respectively. He is currently a Ph.D candidate at MIT. His research interests span Lithium-based batteries and has spent his Ph.D investigating the recharge of Lithium-Oxygen batteries. He is currently looking to extend to CO2 reduction for synthetic fuel generation.
24
Pinar Karayaylali is currently a S.M. student in Mechanical Engineering at MIT. She received her B.S.
in Mechanical Engineering from Bilkent University in 2014. Her research work concentrates on electrode/electrolyte interface in lithium ion batteries.
Yang Shao-Horn is W.M. Keck Professor of Energy, Professor of Mechanical Engineering and Professor of Materials Science and Engineering at MIT. Professor Shao-Horn teaches and conducts research in the area of surface science, catalysis/electrocatalysis, and design of materials and processes for electrochemical energy storage. Professor Shao-Horn has published around 200 research articles and mentored/trained over 50 M.S. and Ph.D. graduate students and postdoctoral associates at MIT.
S1 Supporting Information
Activity and Stability of Cobalt Phosphides for Hydrogen Evolution Upon Water
Splitting
Don-Hyung Ha†#, Binghong Han§#, Marcel Risch†#, Livia Giordano†‡, Koffi P. C. Yao∥,
Pinar Karayaylali∥, and Yang Shao-Horn*†§∥
†Research Laboratory of Electronics, §Department of Materials Science & Engineering,
∥Department of Mechanical Engineering,
Massachusetts Institute of Technology, Cambridge, Massachusetts 02139, United States
‡ Dipartimento di Scienza dei Materiali, Università di Milano-Bicocca, Milano, Italy
# Contributed equally
---
Corresponding Author
* Yang Shao-Horn, [email protected]
Contents:
Supporting Table S1-S3……….……….…………..………..…S2 Supporting Figures S1-S17………...….……….……S5
S2 Table S1. Summary of the HER performance of representative metal phosphide, sulfide and selenide catalysts. Catalyst η10 η at 10 mA·cm-2 (mv) Tafel Slope (mV/dec) Loading (mg/cm2) Electrolyte Reference CoP Nanoparticle 88 48 0.9 0.5 M H2SO4 This work 160 60 0.175 170 66 0.175 1 M KOH
CoP Nanowire array 67 51 0.92 0.5 M H2SO4 [1] CoP Nanoparticle/CNT 122 54 0.285 0.5 M H2SO4 [2] CoP Nanoparticle 70 50 0.9 0.5 M H2SO4 [3]
Co2P Nanorod 134 71 1 0.5 M H2SO4 [4]
MoP Nanoparticle 125 54 0.36 0.5 M H2SO4 [5] MoP Nanostructure 135 54 0.86 0.5 M H2SO4 [6] Mo3P Nanostructure 500 147 0.86 0.5 M H2SO4 [6]
FeP Nanorod array
58 45 ∼1.5 0.5 M H2SO4 [7] 202 71 1 M PBS 218 146 1 M KOH
FeP Nanowire array 55 38 3.2 0.5 M H2SO4 [8] FeP nanorod array 85 60 0.6 0.5 M H2SO4 [9]
MoS2
Vertically aligned nanofilm 168 44 0.12 0.5 M H2SO4 [10] MoS2
Bicontinuous network 220 50
0.06
mg/cm2 0.5 M H2SO4 [11] FeS2 Thinfilm N/A 56.4 N/A 0.5 M H2SO4 [12] FeS2 Thinfilm 270 62.5 N/A 0.5 M H2SO4 [13] Fe0.4Co0.6S2 Thinfilm 190 55.9 N/A 0.5 M H2SO4 [13] Fe0.48Co0.52S2 Thinfilm 196 47.5 N/A 0.5 M H2SO4 [12] CoS2 Thinfilm 230 44.6 N/A 0.5 M H2SO4 [13] CoS2 Thinfilm 192 52 N/A 0.5 M H2SO4 [12] CoS2 Nanowire 145 51.6 1.7 0.5 M H2SO4 [14] NiS2 Thinfilm N/A 48.8 N/A 0.5 M H2SO4 [12] FeSe2 Thinfilm N/A 65.3 N/A 0.5 M H2SO4 [13] CoSe2 Thinfilm 230 42.4 N/A 0.5 M H2SO4 [13] CoSe2 Nanoparticle on C fiber 137 42.1 2.5-3.0 0.5 M H2SO4 [15] CoSe amorphous thinfilm 135 62 3 0.5 M H2SO4 [16]
S3 Table S2. Cobalt (oxy)phosphates and select Co-Co distances.
Chemistry space group Co-Co Co-Co Reference
LiCo2P3O10 P 21/m 3.09 4.97 [17] LiCo2P3O10 P 21/m 3.13 [18] Co2P2O7 A 2/m 3.28 3.46 [19] Co2P2O7 P 21/c 3.15 3.24 [20] CoP4O11 P 21/c 7.09 [21] Co3(PO4)2 H2O P 21/c 3.31 3.08 [22] Co2P2O12 2H2O P 21/c 3.21 3.19 [23] Co3(PO4)2 H2O P 21/c 3.56 [24] Co2O7P2 P 21/c 3.15 4.93 [20] Co3(PO4)2 2H2O P 21/c 2.87 3.59 [25] Co3P2O10 P 21/n 3.58 2.87 [26] Co2P2O7 6H2O P 21/n 5.15 5.38 [27] Na2Co8(PO4)6 P 21/n 3.16 3.67 [28] NaCoPO4 P 21/n 4.81 4.6 [29] Co(H2PO4)2 2H2O P 21/n 5.33 [25] Co3(PO4)2 P 21/n 3.7 3.16 [30] Co3(PO4)2 2H2O P 21/n 3.56 2.86 [26] Li1.865CoP2O7 P 21/a 3.18 3.25 [31] Li4.03Co1.97P4O14 P 21/a 3.2 3.17 [32] Co2P2O7 P 21/a 3.24 3.44 [33] Co3(PO4)2 P 21/b 3.61 3.32 [34] Co8P4O18 2H2O I 41/a m d 2.64 5.27 [35] Co6H2O (H2PO2)2 I 41/a c d 7.26 [36] Co3(PO4)2 2H2O P 21/n 3.58 2.87 [26] NaCoPO4 P 65 3.63 4.86 [37] Co5P2O10 2H2O P 21 21 21 3.31 3.17 [38] Li5.88Co5P8O28 P -1 3.25 [39] Co7P6O22 2H2O P -1 3.62 3.18 [40] CoP2O10 F -4 3 m 7.23 [41] H16CoP2O10 F -4 3 m 7.23 [41] CoH3PO4 P c a 21 3.61 3.15 [42] H8Co2P2O11 Pcab 3.66 3.18 [43] LiCoPO4 Pnma 3.82 5.54 [44] LiCoPO4 Pnma 3.83 5.54 [45] Co3(PO4)2 4H2O Pnma 5.67 5.32 [46] NaCoPO4 Pnma 3.39 5.1 [37]
CoPO4 Pnma 3.7 [47]
S4 Table S3. Computed surface energies (γ) for the low index surfaces of Pnma CoP. γ = (Eslab-nEbulk)/2S,
where Eslab is the total energy of the surface slab, Ebulk is total energy per formula unit of bulk CoP, n is the
number of formula units in the slab and S is the surface area.
orientation γ (J/m2) (100) 2.15 (010) 1.66 (001) 1.66 (110) 1.84 (101) 1.43 (011) 1.23 (111) 1.49
S5 Figure S1 Histogram of the diameter distributions of CoP nanoparticles (NPs).
Figure S2 CoP sample with 0.9 mg/cm2 loading in this work shows similar activity (~20 mA/cm2 at -0.1 V
vs. RHE) to previous report.[3] CV scans were performed at a sweep rate of 10 mV/s with the upper voltage limit of +0.1 V vs. RHE.
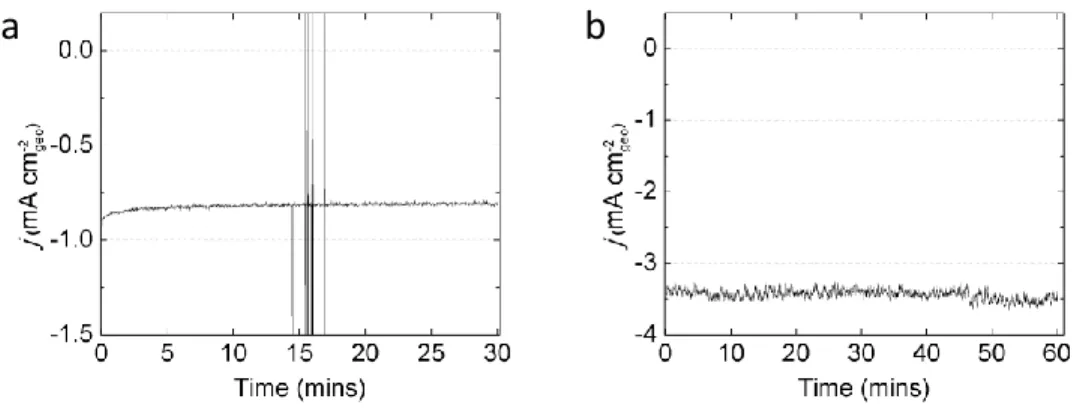
S6 Figure S3. Geometric current density from potentiostatic holding for long time. (a) No significant degradation is observed in the CoP sample held for 30 min in acid (0.5M H2SO4) at -0.1 V vs. RHE. (b)
The sample in the alkaline (0.3M KOH) solution also show no significant degradation for 1 hour at -0.16 V vs. RHE. The loading of CoP was 180 μgCoP/cm2geo.
Figure S4 Cyclic voltammetry (CV) for HER of CoP NPs in different KOH electrolytes. In addition to the data presented in Figure 2d, another experiment of CV scans were performed in alkaline from high pH to low pH, showing a comparable trend to that in Figure 2d. The loading of CoP was 180 μgCoP/cm2. CV scans
were performed at a sweep rate of 10 mV/s with the upper voltage limit of +0.1 V vs. RHE.
S7 Figure S5 Geometric current density of potentiostatic holding at various potentials (0, 0.2, 0.4, 0.6, and 0.8 V vs. RHE) for 20 min and subsequent HER activity measurements evaluated at -0.13 V vs. RHE in acid solution (0.5 M H2SO4). The loading of CoP was 180 μgCoP/cm2.
S8 Figure S6 TEM images of CoP NPs. The sample labeled as “pristine” displays the pristine CoP NPs showing amorphous layer on the surface of NPs. The sample held at -0.13 V vs. RHE is labeled as HER and it does not show significant difference from the pristine sample. 0.4 V sample also does not show significant changes in their shape and size. The sample preconditioned at 1.4 V shows smaller size and less defined shape.
S9 Figure S7 P/Co and O/Co ratios obtained from TEM EDX analysis before and after potentiostatic hold at various potentials for 20 min and then measured HER at -0.13 V vs. RHE in acid solution (0.5 M H2SO4).
Figure S8 XRD and TEM results of Co2P NPs. (a) XRD pattern of Co2P NP sample is matched Co2P
S10 Figure S9 Samples for ex situ XAS measurements. Geometric current density from potentiostatic holds and subsequent HER activity measurements evaluated at -0.13 V vs. RHE in 0.3 M KOH solution for ex situ XAS measurements.
Figure S10 P5+ peak intensity is plotted as a function of final potential. Solid circles represent the samples
controlled at -0.12, 0.4, and 1.4 V vs. RHE. The open circles represent the samples preconditioned at 0.4, 1.4 V and open circuit and sequentially held at -0.12 V vs. RHE. The inset shows the zoom in of the data points near -0.12 V vs. RHE.
S11 Figure S11. Select cobalt (oxy)phosphates (a,b) with and (c,d) without edge-sharing Co-Co octahedra at 3.1 Å . Further (oxy)phosphates may be found in Table S2.
S12 Figure S12. Schematic representing the hydrogen positions for the initial configurations considered (a and b) and for the final configurations obtained upon optimization (c and d) on the (011) and (101) surfaces of CoP. The adsorption free energies of the optimized configurations are reported. The calculations are performed at the coverage of one hydrogen atom per unit cell. (11) and (21) surface supercells are used for the (011) and (101) surfaces, respectively.
S13 Figure S13 Fourier transform infrared spectroscopy (FT-IR) spectra of as-prepared CoP NP sample (green) and the identical sample after heating treatment at 450 °C for 30 min showing that organic surfactants are removed after the heating treatment.
Figure S14 Examples of iR and background corrections. The loading of CoP was 180 μgCoP/cm2. CV
S14 Figure S15 XRD patterns of both pristine and aged NPs, which match CoP phase (JCPDS 65-1474).
S15 Figure S17 Design of the in-situ electrochemical cell. The electrochemical cell has a glassy carbon working electrode, graphite counter electrode with area equal to the working electrode and a Harvard Instr. Ag/AgCl reference electrode.
S16 References
[1] J. Tian, Q. Liu, A.M. Asiri, X. Sun, J. Am. Chem. Soc., 136 (2014) 7587-7590.
[2] Q. Liu, J. Tian, W. Cui, P. Jiang, N. Cheng, A.M. Asiri, X. Sun, Angew. Chem. Int. Ed., 53 (2014) 6710-6714.
[3] E.J. Popczun, C.G. Read, C.W. Roske, N.S. Lewis, R.E. Schaak, Angew. Chem. Int. Ed., 53 (2014) 5427-5430.
[4] Z. Huang, Z. Chen, Z. Chen, C. Lv, M.G. Humphrey, C. Zhang, Nano Energy, 9 (2014) 373-382. [5] Z. Xing, Q. Liu, A.M. Asiri, X. Sun, Adv. Mater., 26 (2014) 5702-5707.
[6] P. Xiao, M.A. Sk, L. Thia, X. Ge, R.J. Lim, J.-Y. Wang, K.H. Lim, X. Wang, Energy Environ. Sci., 7 (2014) 2624-2629.
[7] Y. Liang, Q. Liu, A.M. Asiri, X. Sun, Y. Luo, ACS Catal., (2014) 4065-4069.
[8] P. Jiang, Q. Liu, Y. Liang, J. Tian, A.M. Asiri, X. Sun, Angew. Chem. Int. Ed., 53 (2014) 12855-12859.
[9] R. Liu, S. Gu, H. Du, C.M. Li, J. Mater. Chem. A, 2 (2014) 17263-17267.
[10] H. Wang, Z. Lu, S. Xu, D. Kong, J.J. Cha, G. Zheng, P.-C. Hsu, K. Yan, D. Bradshaw, F.B. Prinz, Y. Cui, Proceedings of the National Academy of Sciences, 110 (2013) 19701-19706.
[11] J. Kibsgaard, Z. Chen, B.N. Reinecke, T.F. Jaramillo, Nat. Mater., 11 (2012) 963-969.
[12] M.S. Faber, M.A. Lukowski, Q. Ding, N.S. Kaiser, S. Jin, J. Phys. Chem. C, 118 (2014) 21347-21356.
[13] D. Kong, J.J. Cha, H. Wang, H.R. Lee, Y. Cui, Energy Environ. Sci., 6 (2013) 3553-3558.
[14] M.S. Faber, R. Dziedzic, M.A. Lukowski, N.S. Kaiser, Q. Ding, S. Jin, J Am Chem Soc, 136 (2014) 10053-10061.
[15] D. Kong, H. Wang, Z. Lu, Y. Cui, J Am Chem Soc, 136 (2014) 4897-4900.
[16] A.I. Carim, F.H. Saadi, M.P. Soriaga, N.S. Lewis, J. Mater. Chem. A, 2 (2014) 13835.
[17] K. Rissouli, K. Benkhouja, A. Sadel, M. Bettach, M. Zahir, M. Giorgi, M. Pierrot, M. Drillon, Eur. J. Solid State Inorg. Chem., 34 (1997) 221-230.
[18] F. Erragh, A. Boukhari, E. Holt, Acta Crystallogr., Sect. C: Cryst. Struct. Commun., 52 (1996) 1867-1869.
[19] A. El Belghitti, A. Boukhari, E. Holt, Acta Crystallogr., Sect. C: Cryst. Struct. Commun., 50 (1994) 482-484.
[20] B. El Bali, M. Bolte, Acta Crystallogr., Sect. E: Struct. Rep. Online, 58 (2002) 32-33.
[21] A. Olbertz, D. Stachel, I. Svoboda, H. Fuess, Zeitschrift für Kristallographie-Crystalline Materials, 208 (1993) 374-375.
[22] J. Anderson, E. Kostiner, F. Ruszala, Inorg. Chem., 15 (1976) 2744-2748.
[23] T. Yang, J. Ju, G. Li, S. Yang, J. Sun, F. Liao, J. Lin, J. Sasaki, N. Toyota, Inorg. Chem., 46 (2007) 2342-2344.
[24] Y.H. Lee, J.K. Clegg, L.F. Lindoy, G.M. Lu, Y.-C. Park, Y. Kim, Acta Crystallogr., Sect. E: Struct. Rep. Online, 64 (2008) 69-70.
[25] H. Effenberger, Acta Crystallogr., Sect. C: Cryst. Struct. Commun., 48 (1992) 2104-2107. [26] J.L. Pizarro, G. Villeneuve, P. Hagenmuller, A. Le Bail, J. Solid State Chem., 92 (1991) 273-285. [27] F. Capitelli, M. Harcharras, H. Assaaoudi, A. Ennaciri, A. Moliterni, V. Bertolasi, Zeitschrift für Kristallographie/International journal for structural, physical, and chemical aspects of crystalline materials, 218 (2003) 345-350.
[28] R. Baies, O. Perez, V. Caignaert, V. Pralong, B. Raveau, J. Mater. Chem., 16 (2006) 2434-2438. [29] A.M. Chippindale, A.R. Cowley, J. Chen, Q. Gao, R. Xu, Acta Crystallogr., Sect. C: Cryst. Struct. Commun., 55 (1999) 845-847.
[30] A.G. Nord, T. Stefanidis, H. Møllendal, H. Priebe, O.F. Nielsen, (1983).
[31] H. Zhou, S. Upreti, N.A. Chernova, M.S. Whittingham, Acta Crystallogr., Sect. E: Struct. Rep. Online, 67 (2011) i58-i59.
S17 [33] D. Kobashi, S.Z. Kohara, J. Yamakawa, A. Kawahara, Acta Crystallogr., Sect. C: Cryst. Struct. Commun., 53 (1997) 1523-1525.
[34] J. Joubert, E. BERTAUT, Zeitschrift für Kristallographie-Crystalline Materials, 136 (1972) 98-105. [35] G. Wang, M. Valldor, E.T. Spielberg, A.-V. Mudring, Inorg. Chem., 53 (2014) 3072-3077.
[36] N.V. Kuratieva, M.I. Naumova, D.Y. Naumov, Acta Crystallogr., Sect. C: Cryst. Struct. Commun., 58 (2002) 129-131.
[37] R. Hammond, J. Barbier, Acta Crystallogr., Sect. B: Struct. Sci, 52 (1996) 440-449. [38] F. Ruszala, J. Anderson, E. Kostiner, Inorg. Chem., 16 (1977) 2417-2422.
[39] F. Sanz, C. Parada, C. Ruiz-Valero, Chem. Mater., 12 (2000) 671-676.
[40] P. Lightfoot, A. Cheetham, Acta Crystallogr., Sect. C: Cryst. Struct. Commun., 44 (1988) 1331-1334.
[41] A. Ferrari, C. Colla, Gazz. Chim. Ital., 67 (1937) 294-301.
[42] F. Sapina, P. Gomez-Romero, M. Marcos, P. Amoros, R. Ibanez, D. Beltran, R. Navarro, C. Rillo, F. Lera, Eur. J. Solid State Inorg. Chem., 26 (1989) 603-617.
[43] N. Hamanaka, H. Imoto, Inorg. Chem., 37 (1998) 5844-5850. [44] F. Kubel, Zeitschrift für Kristallographie, 209 (1994) 755-755.
[45] T. Kimura, C. Chang, F. Kimura, M. Maeyama, J. Appl. Crystallogr., 42 (2009) 535-537.
[46] Y.H. Lee, J.K. Clegg, L.F. Lindoy, G.M. Lu, Y.-C. Park, Y. Kim, Acta Crystallogr., Sect. E: Struct. Rep. Online, 64 (2008) i67-i68.
[47] J. Osorio-Guillen, B. Holm, R. Ahuja, B. Johansson, Solid State Ionics, 167 (2004) 221-227. [48] D. Kobashi, S. Kohara, J. Yamakawa, A. Kawahara, Acta Crystallogr., Sect. C: Cryst. Struct. Commun., 54 (1998) 7-9.