ADVANCES IN THEORY AND APPLICATION
by F .L. PaiIlet U.S. Geological Survey
Denver, CO 80225 C.H. Cheng
Earth Resources Laboratory
Department of Earth, Atmospheric, and Planetary Sciences Massachusetts Institute of Technology
Cambridge, MA 02139 W.D. Pennington Marathon Oil Company
Denver, CO 80160
ABSTRACT
Full-waveform acoustic logging has made significant advances in both theory and applic
cation in recent years, and these advances have greatly increased the capability of log analysts to measure the physical properties of formations. Advances in theory provide the analytical tools required to understand the properties of measured seismic waves, and to relate those properties to such quantities as shear and compressional velocity and attenuation, and primary and fracture porosity and permeability of potential reservoir rocks. The theory demonstrates that all parts of recorded waveforms are related to various modes of propagation, even in the case of dipole and quadrupole source logging. However, the theory also indicates that these mode properties can be used to design velocity and attenuation picking schemes, and shows how source frequency spectra can be selected to optimize results in specific applications. Synthetic microseismogram com-putations are an effective tool in waveform interpretation theory; they demonstrate how shear arrival picks and mode attenuation can be used to compute shear velocity and intrinsic attenuation, and formation permeability for monopole, dipole and quadrupole sources. Array processing of multi-receiver data offers the opportunity to apply even more sophisticated analysis techniques. Synthetic microseismogram data is used to illus-trate the application of the maximum-likelihood method, semblance cross-correlation, and Prony's method analysis techniques to determine seismic velocities and
attenua-8 Paillet et al.
tions. The interpretation of acoustic waveform logs is illustrated by reviews of various practical applications, including synthetic seismogram generation, lithology determina-tion, estimation of geomechanical properties in situ, permeability estimadetermina-tion, and design of hydraulic fracture operations.
INTRODUCTION
Acoustic logging, and especially acoustic waveform logging in which the complete pres-sure signal is digitally recorded, has advanced rapidly in the past decade. Sources and receivers have not really changed in that acoustic logging systems are still mostly based on piezoelectric or electromechanical transducers to generate signals in the borehole fluid, and piezoelectric transducers to measure the waves propagating outward from that source at some position further up or down the borehole. Significant advances in acoustic logging equipment technology may be summarized under three categories: 1) addition of entire arrays of receivers so that the latest digital seismic data process-ing can be applied to waveform logs; 2) development of non-axisymmetric or multipole sources capable of exciting non-axisymmetric waves in the borehole fluid for improved shear velocity interpretation; and 3) generation of source energy with controlled fre-quency content capable of exciting low frefre-quency wave modes such as Stoneley waves in "soft" formations. Many of the details of these equipment advances are not given in the literature because they are proprietary to various major oil and service companies. However, the impact of the new techniques and the theory developed to take advantage of those techniques is evident in the technical literature. The most advanced acoustic logging techniques are now on the verge of measuring permeability as well as porosity in situ in the open borehole, and can provide measurements of shear velocity, intrin-sic attenuation and Poisson's ratio. Techniques are available for performing some of these measurements in cased boreholes. These are significant advances, many of which have potentially important applications in fields other than petroleum exploration and reservoir engineering.
This paper is intended to provide a general overview of the latest techniques in con-ventional acoustic and full-waveform logging. Although the subject is too large to cover in full detail, we intend to present a review of the most important results, indicating the physical mechanisms or data processing principles on which they are based, and ci ting the most important and most up to date references for each. The discussion is broken into four parts: conventional acoustic porosity logging, physical principles of acoustic full waveform logs, data processing, and applications. The conventional poros-ity logging discussion reviews the historic development of acoustic logs and describes the configuration of conventional acoustic logging probes. The physical principle discus-sion focuses on the important physical and mathematical aspects of wave propagation in boreholes, illustrating the importance of wave-mode propagation (waveguide effects)
(
in the borehole, and indicating how waveform properties are related to rock moduli, fluid properties, porosity, and permeability. We then review data processing techniques applicable to both standard dual receiver systems and advanced multi-receiver array systems. Lastly, field examples illustrate how all of the physical insight from the latest theory and the results of advanced data processing can be turned into new methods for reservoir analysis.
ACOUSTIC LOGGING - EQUIPMENT AND LOGGING
TECHNIQUES
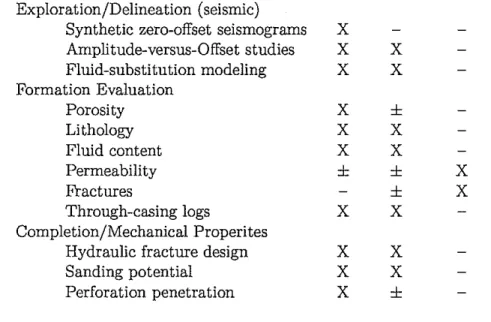
Acoustic logging was developed before 1965 as a method for measuring compressional velocity of rocks adjacent to the well bore as a function of depth along the borehole. The procedure was designed to be closely analogous to porosity logging using various other equipment, such as neutron and density logging probes. In this approach, the log would give values for compressional (P-wave) velocity averaged over a certain volume, with subsequent corrections for borehole effects such as diameter changes, invasion, and drilling damage. Conventional acoustic logs are obtained using the combination of acoustic source and receivers illustrated in Figure 1A. The source is either a piezoelec-tric or magnetospiezoelec-trictive device which translates an elecpiezoelec-trical signal into an ultrasonic vibration. Receivers are piezoelectric crystals which convert measured pressure waves into electromagnetic signals which can then be amplified and transmitted up the logging cable. Measurements are made with the logging tool centralized in the borehole, and the receiver signal averaged over the circumference of the piezoelectric receiver.
The P-wave velocity of the formation is measured by determining the difference in arrival times at the two receivers. The differencing of the arrival time automatically corrects for the "fluid delay" imposed by the time required for pressure signals to travel from the acoustic source to the formation, and from the formation to the receivers. Compensated acoustic logging systems (Figure 1B) use two sources with the two re-ceivers to make alternate acoustic measurements with the signal traveling up and down the well bore. The averaging of these measurements corrects for errors that would be introduced by changes in borehole diameter between the two receivers. Arrival time detections and P-wave velocity determinations are controlled by various gain settings on the uphole electronics.
Acoustic logging became a standard technique when useful empirical methods were developed for the calibration of acoustic velocity in formation porosity (Guyod and Shane, 1969; Paillet and Cheng, 1991). The conventional "acoustic porosity log" is plotted in inverse velocity, usually in units of microseconds per foot. Inverse velocity correlates almost linearly with porosity according to the equation
10 PaiIlet et al.
where T is the measured inverse of P-wave velocity or formation-transit time, ¢ is formation porosity, Tm is the mineral grain or "matrix" transit-time, and Tf is the transit-time of the formation fiuid (Gardner et al., 1964; Pickett, 1960). One of the most important aspects of acoustic logging system design is the selection of the ap-propriate source frequency. It was found by trial and error that source signals with a centerband frequency of 10-20 kHz gave the best results for typical logging conditions. This source frequency is associated with an acoustic wavelength of from 0.5 to 2 feet in typical formations. At these wavelengths, the logging tool would have to be Significantly decentralized to affect signal quality. Furthermore, various studies demonstrate that the volume of a uniform formation sampled by these measurements is roughly equal to the compressional wavelength in the formation (Baker, 1984; Paillet and Cheng, 1991). The situation becomes slightly more complex when a "damaged" zone is assumed to exist adjacent to the well bore; in these situations source-to-receiver spacing also becomes important in determining the volume of investigation (Baker, 1984; Koerperich, 1979). The 0.5 to 2 ft. sample volume associated with conventional acoustic logging provides a convenient compromise between depth of penetration in the borehole wall and vertical resolution.
This review paper begins with a brief overview of conventional acoustic logging as the starting point in discussing the latest advances in acoustic logging in boreholes, and especially acoustic full waveform logging. Full waveform logs are obtained by record-ing the complete pressure signal at each of the receivers in an otherwise conventional acoustic logging probe. This method was initially compared to performing a down-hole seismic refraction study, but equipment and recording procedures have been modified to include-entirely new source transducer mechanisms, and multiple receiver strings, usually denoted as acoustic waveform array processing systems. All of these advances have opened up entirely new applications to analysis using acoustic logging techniques. At the same time, the complete range of acoustic measurements in boreholes is much too broad to be included in a single review article. For this reason we restrict our discus-sion to measurements made using the logging tool geometry illustrated in Figure 1, or adaptations of that geometry incorporated in recently developed full waveform logging systems. This leaves out the otherwise important applications of acoustic measure-ments related to borehole wall imaging (acoustic televiewer) and borehole-to-borehole soundings (seismic tomography). This also leaves out another useful technique, cir-cumferential acoustic logging (Guy et al., 1987), which uses transducers and receivers situated on pads and pressed against the borehole wall to transmit pressure signals around the circumference of the well bore, and which has important applications in the detection of vertical fractures.
PHYSICAL
ANDMATHEMATICAL PRINCIPLES
Acoustic logging is one of the few areas in borehole geophysics where recent advances in the fundamental understanding of downhole measurements have greatly influenced practical logging technology. Such a strong statement is warranted because theoreti-cal developments in the last decade provide the ability to design source geometry and frequency content so as to optimize the performance of acoustic logging equipment for a specific application. The theoretical developments helped extend logging techniques to shear logging in soft formations (Schmitt, 1988; Schmitt et aI., 1988a, 1988b), in-terpretation of acoustic waveform logs in cased boreholes (Tubman et aI., 1984), and application of acoustic log techniques to the evaluation of fractured formations (Hornby et aI., 1989, 1992; Paillet, 1991). These results even affect our understanding of the sim-plest acoustic logging techniques, where measured travel times of compressional waves are related to formation porosity, and where the physics of wave transmission were supposedly well understood.
Acoustic logging probes such as those illustrated in Figure 1 measure the signal transmitted from a source in the borehole fluld to a set of receivers located some distance away and also surrounded by fluid. Seismic waves (P waves and S waves) traveling through the formation towards the receiver are those associated with the critical angle of refraction at the borehole wall. Critical refraction results at those angles of incidence where the deflection of the wave front at the interface is just that needed to force the wave to travel parallel to the interface. At smaller angles of incidence all of the wave energy is reflected back into the borehole, whereas most of the energy is lost to outward radiation at greater angles of incidence. However, critical refraction is not the whole story. The critical refraction mechanism acts in combination with internal resonances within the fluid column to produce a set of guided modes which dominate the measurements made at some distance along the well bore. The physical properties of acoustic waveforms measured by the receivers illustrated in the figure can be effectively described by considering the superposition of the modes excited by a specific source for a given borehole diameter and a known set of seismic velocities.
The properties of borehole modes can be understood by considering the geometry of multiple refractions in a fluid-filled channel between two elastic solids (Paillet and White, 1982; Paillet and Cheng, 1991). In a broad source spectrum only certain frequencies will excite refractions that reinforce each other as they propagate down the channel. There is an infinite series of such discrete frequencies, with values determined by the channel width according to the relation between angle of incidence and channel width:
a
-
=
cosO,12 Paillet et al.
where a is the channel half-width, w is the frequency, L is the acoustic wavelength, n is an integer, 6 is the angle of incidence and VI is the acoustic velocity of the fluid. The constructively interfering wave modes are attenuated because a certain amount of energy is transmitted at each refraction. However, there are no transmission losses when the angle of incidence is below the critical angle; otherwise, the transmission loss is a complicated function of angle of incidence and acoustic impedance at the borehole wall. In mathematical terms, borehole modes are described as a double infinity of discrete frequency values, each associated with constructively interfering refractions. One of the two sets is associated with the compressional (P wave) and the other with shear (8 wave) propagation in the formation around the borehole. Denoting each of these by a number (m=1,2,3, ....), we define a fundamental (m=O) mode related to resonant displacements of the entire fluid column. For an axially symmetric source, this mode is associated with the 8toneley mode of propagation on plane interfaces, and is often called a tube wave because of the cylindrical borehole geometry. The borehole equivalent of the Rayleigh mode on elastic surfaces does not exist except in the air-filled borehole (Paillet and White, 1982; Biot 1952). Analysis shows that the multiply-refracted shear waves (shear normal modes in the seismic literature) transform to the Rayleigh mode in the zero fluid density limit, so that these modes are usually called "pseudo-Rayleigh" waves.
For field-oriented geophysics unfamiliar with the most recent theory of acoustic log-ging, the important result is that waveforms measured in boreholes can be effectively analyzed using the known properties of the wave modes superimposed in the wave-form (Paillet and Cheng, 1986; Kurkjian, 1985, 1986). This means that all parts of the waveform are strongly influenced by the borehole waveguide phenomenon. The refracted compressional and shear modes are divided into those above and below the cutoff frequencies associated with critical refraction of modes. Borehole and tool ge-ometry, borehole fluid properties, and the seismic velocities of the formations together determine cutoff frequencies for each application. When source energies are above cutoff frequency, fully-trapped modes are generated. These travel along the borehole at veloc-ities near those for the borehole fluid. They are attenuated by dispersion and intrinsic attenuation but not by outward radiation. In contrast, the modes excited at frequencies below cutoff determine the first arrivals interpreted as P waves and S waves (known as head waves in the literature). The contribution to head waves is concentrated in nar-row spectral bands centered on frequencies just below mode cutoff (Paillet and Cheng, 1986). The practical result of wave mode theory is that conventional acoustic logging probes are most effective when the source frequency band is limited to the vicinity of the m=1 cutoff frequencies for the compressional and shear modes. Ifsource frequencies are lower, P waves and S waves are not efficiently generated. Ifsource frequencies extend to higher modes, P-wave and S-wave arrivals are difficult to identify precisely.
borehole forcing has important applications. Non-axisymmetric (dipole and quadrupole) borehole forcing was originally approached by assuming that such forcing would excite only shear waves, and that "shear wave logging" could be performed in a way exactly analogous to acoustic logging for compressional velocities (White, 1967; Kisunesaki, 1980; Zemanek et aI., 1984, 1991). However, wave mode theory is as important in un-derstanding the non-axisymmetric source situation as in conventional monopole logging. An arbitrary pressure signal can be expressed mathematically as a double Fourier series over azimuthal and radial coordinates (Chen, 1989; Winbow, 1988). Wave types can be grouped into an even larger number of modes indexed by radial periodicity (m=O,
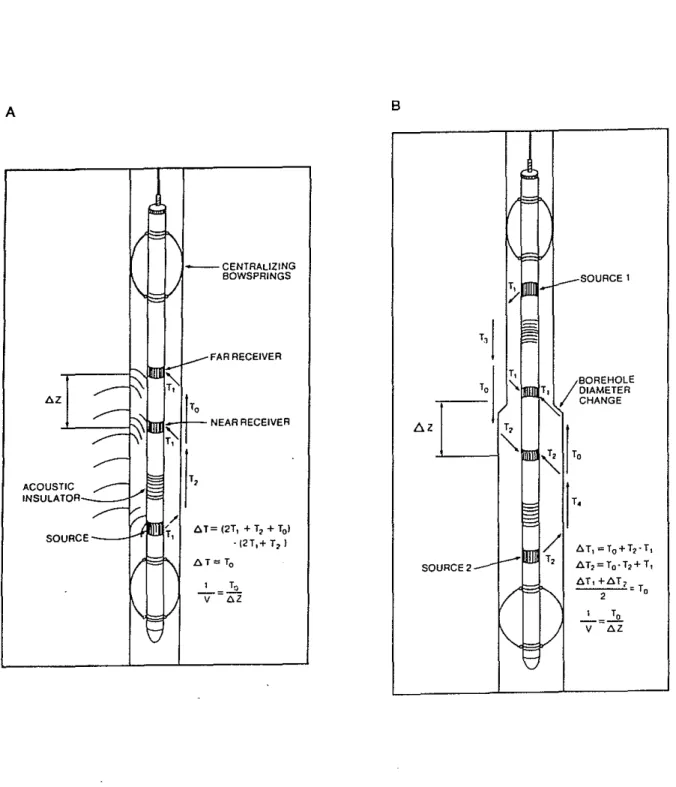
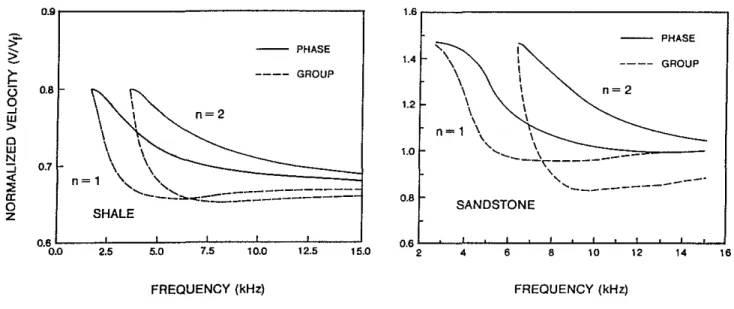
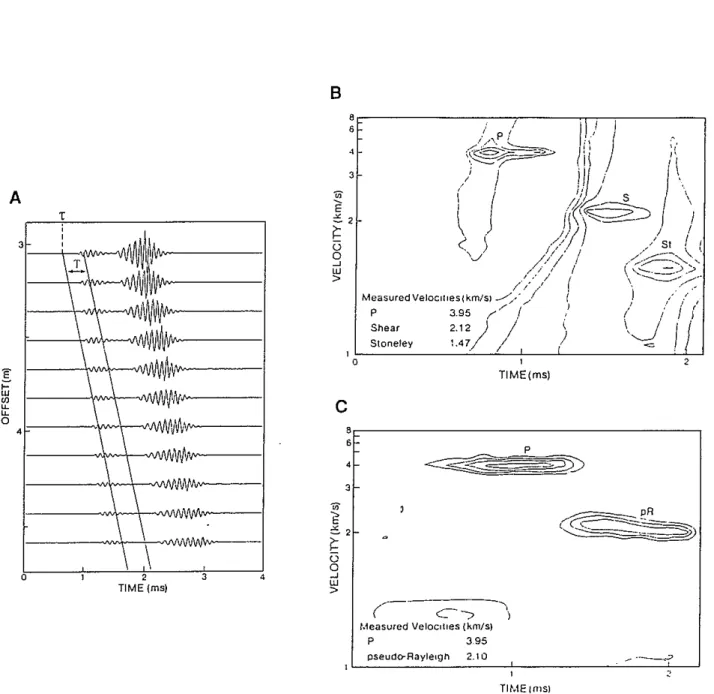
and m=1,2,3.. for compressional and shear) and by azimuthal periodicity (n=O for monopole, n=l for dipole, n=2 for quadrupole, etc). Velocities and dispersion func-tions for the nonsymmetric m=1,2,3 modes are similar to those for monopole sources. However, them=O modes for dipole and quadrupole sources have low-frequency cutoffs imposed by borehole geometry. These modes travel with velocities very close to for-mation shear velocity at typical logging frequencies in softer forfor-mations, accounting for the success of these tools in measuring shear velocity in situ (Figure 2) (Schmitt, 1988). The mode theory demonstrates that logging with dipole and quadrupole sources does not guarantee successful shear logging (Paillet and Cheng, 1991). Effective analysis of formation shear velocity requires use of mode theory in the selection of logging frequen-cies and the interpretation of waveform data. Examples of waveforms computed for the fundamental (m=O) mode for monopole, dipole, and quadrupole sources (n=0,1,2) in Figure 3 indicate the relation between mode arrival and shear travel time. Such calcu-lations demonstrate that many of the same techniques used in evaluating shear velocity from Stoneley wave slowness in "soft" formations (Cheng and ToksQz, 1982; Stevens and Day, 1986) need to be applied in "shear logging" with non-symmetric sources.
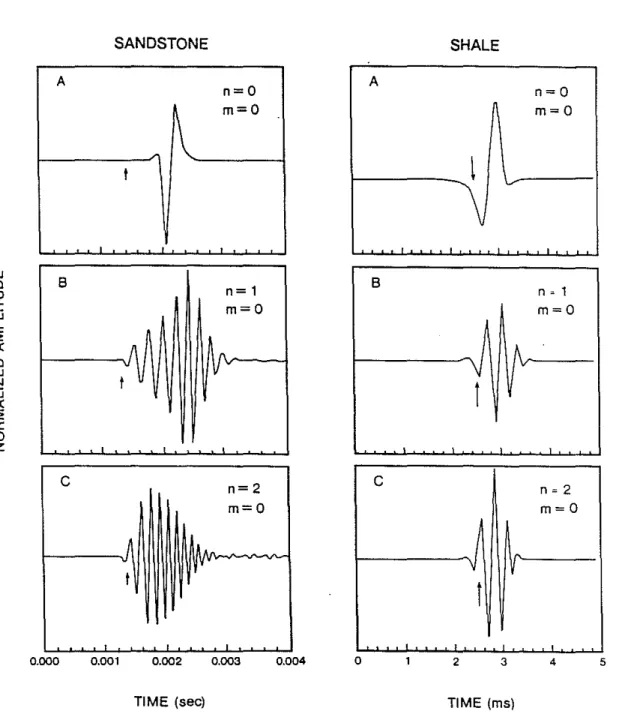
Another area in which borehole waveguide theory has advanced is in the relationship between the properties of measured waves and formation porosity and permeability. The theory used to perform these calculations is based on the formulation originally given by Biot (1956a, 1956b), and used by Rosenbaum (1974) to compute the characteristics of waveforms from monopole sources in permeable formations. The definitive study of the effects of permeability on acoustic waveform logs is described in a landmark series of papers by D.P. Schmitt (Schmitt, 1988; Schmitt et aI., 1988a, 1988b). We regret that a special acknowledgment of this contribution to the theory of wave proprogation in boreholes was inadvertently left out of a recent monograph on acoustic waveform log-ging (Paillet and Cheng, 1991). A thorough development of borehole wave mode theory in these studies has improved the understanding of these results, and extends them to dipole and quadrupole source logging (Figure 4). Mode theory and microseismogram computation indicates that the fundamental mode (m=O) is especially sensitive to per-meability. This result has been used to apply the interpretation of either amplitude or slowness of the Stoneley wave to the in situ measurement of permeability (Burns, 1991). One important complication is the effect of borehole wall sealing or mudcake on Stone-ley mode attenuation. Ifthe borehole wall is assumed to be impermeable, Rosenbaum
14 Paillet et al.
(1974) showed that the Stoneley mode attenuation associated with formation permeabil-ity would not be detectable. This effect results because the impermeable barrier at the borehole wall interferes with axisymmetric motion of the pore fluid. This phenomenon is not nearly so important for non-axisymmetric motions, so that significant mode at-tenuation occurs whether or not mudcake is present in dipole and quadrupole logging (Schmitt et al., 1988a, 1988b). This result is demonstrated by the mode computations (Figure 4). Furthermore, the theory demonstrates that Stoneley mode attenuation may be used to characterize permeability of fractures in situations where fracture zones act as thin permeable horizons (Tang et a!., 1991) that might not be detected using the low-frequency Stoneley wave (tube wave) reflection method described by Hornby et a!., (1989) .
PROCESSING OF FULL WAVEFORM DATA
P- and S-Wave Velocities from Arrival Picks
The compressional or P wave is the first arrival in a microseismogram. It is thus easy to identify. Conventional methods for picking the compressional wave arrivals from two or more receivers and then computing their velocities consist of picking the first peak, first trough, or the first zero crossing. All three methods are quite robust. However, because full waveform acoustic logs are usually digitized at· 5 ps intervals and have receiver-receiver separations of about 30 cm, the accuracy involved in these techniques is no better than one digitation interval divided by the offset. With the typical numbers quoted here, that amounts to 16.7 psec/m. In a hard limestone environment, with typ-ical P-wave transit-time of about 167-200 psec/m this amounts to an unacceptable 10% error. One way to obtain better accuracy in velocity picking from digitized waveforms is to cross-correlate the two P-wave waveforms, and then interpolate the cross-correlation function to obtain the moveout to an accuracy better than the digitizaton interval (Cheng et a!., 1981). We can safely do this because interpolating between the digitized time points is equivalent to adding zeros to the high frequency end of the spectrum and thus will not affect the signal itself directly. An improvement in accuracy of an order of magnitude is easily obtainable. A simple interpolation algorithm involves fitting the cross-correlation coefficients with a polynomial, then evaluating the polynomial at sev-eral (say ten) points between the two highest cross-correlation coefficients, and taking the maximum (Willis and ToksDz, 1983).
The determination of shear wave velocity from full waveform acoustic logs is a much more complicated problem than picking the P-wave velocity. In all formations, acoustic waves excited in the borehole fluid produce refracted shear waves in the borehole wall, wi th an efficiency that depends in a complicated way on frequency, hole diameter, and seismic properties of the formation. In a "slow" formation where the shear velocity
is less than the acoustic velocity of the borehole fluid (drilling mud or water), "shear waves" do not exist as discrete, second arrivals in recorded waveforms. Conventional "shear wave logging" cannot be used in these situations. As a result, in these formations we have to use indirect techniques to determine the formation shear wave velocity. Some of these techniques are described later in this section.
Even in a fast formation, identifying the shear wave in the full waveform seismogram and then determining shear velocity is not a straightforward process, although potential errors introduced in this process are not important in "fast" formations. This is because of the existence of the pseudo-Rayleigh wave, which travels at the formation shear wave velocity at its low frequency cutoff, and which has no geometric dispersion, resulting in a much larger amplitude than that of the refracted shear wave. The superposition of the pseudo-Rayleigh wave modes on the shear wave arrival makes the detection and picking of the shear wave more difficult than that of the compressional wave. On the other hand, because the pseudo-Rayleigh wave travels at the shear wave velocity at cutoff and has no geometric dispersion, it usually appears as a large amplitude event starting at the formation shear wave arrival time. The distinction between shear and psuedo-Rayleigh waves is not very important in shear velocity logging in fast formation; we may be picking the pseudo-Rayleigh instead of the formation refracted shear wave, the computed velocity mode is very close to formation S-wave velocity.
As in the case for the compressional wave, cross-correlation helps in improving the accuracy of the S-wave velocity determination. However, owing to the emergent nature of the shear/pseudo-Rayleigh packet, there are sometimes doubts about whether the pick is the first arrival of the shear wave. This is important because the pseudo-Rayleigh mode is dispersed, and the "beating" of several modes may introduce amplitude effects that resemble arrivals at velocities substantially slower near shear velocities. In order to cut down the influence of one bad pick and improve the accuracy of the moveout, Willis and Toksoz (1983) used a semblance correlation algorithm. Semblance cross-correlation takes into account the relative amplitudes as well as the coherency of the waveforms. In the Willis and Toksoz algorithm, the compressional wave is first extracted from the near receiver waveform, and is correlated along the rest of the waveform. The shear wave delay is then picked as that correlating lag which has the larger semblance correlation value past 1.4 times the P-wave arrival time. The shear/pseudo-Rayleigh wave packet is then extracted and semblance cross-correlated with the far receiver start-ing with the known lag to refine the velocity pick. Willis and Toksoz (1983) claim that this is the most robust and accurate of several cross-correlation methods they tested.
Shear Velocities from Guided Waves in Slow Formation
Slow formations are those where the shear wave velocity is lower than that of the acoustic wave velocity of the borehole fluid (typically drilling mud or water). In such formations,
16 Paillet et al.
compressional or pressure wave energy generated in the borehole fluid column cannot be critically refracted along the borehole wall and radiate back into the borehole to be picked up by the receivers. Thus direct determination of shear wave velocity in a slow formation is not possible without the use of a non-axisymmetric shear wave logging tool. Since most of the existing full waveform acoustic tools use a monopole source, it is necessary to derive indirect methods to determine formation shear wave velocity using the monopole full waveform data in slow formations. It is important to bear in mind that these methods are interpretative methods based on specific models of the borehole. In general, all these methods are based on a cylindrical borehole in an elastic solid, with no irregularities on the borehole wall, and no inhomogeneity in the formation. In actual applications, field conditions will be different from these idealized models. Just how different they are will determine the accuracy of the interpreted shear wave velocity. In particular, shales are not only characterized by slow seismic velocities, but they are also anisotropic. Interpretation methods applied to shales will, at best, give incomplete results and could potentially give totally erroneous information about the formation shear wave velocities.
The most common method of estimating formation shear wave velocity in a slow formation is to use the tube (Stoneley) wave (Cheng and ToksDz, 1982; Chen and Willen, 1984; Liu, 1984; Stevens and Day, 1986). The phase velocity of the tube wave, although not very sensitive to formation properties in a fast formation, is quite sensitive to the formation shear wave velocity in a slow formation. In such a formation, the high frequency tube wave velocity is mainly controlled by the formation shear wave velocity (Cheng et aI., 1982; White, 1983). The influence of formation P-wave velocity on the tube wave velocity is negligible. The other factor influencing the tube wave velocity is the borehole fluid. Thus, if we can measure the tube wave velocity and the acoustic velocity of the borehole fluid, we can solve for the formation shear wave velocity. Ifwe do not know the acoustic velocity of the borehole fluid, then we must obtain the phase velocity of the tube wave at more than one frequency. Using the measured velocity dispersion and the partition coefficients discussed in Cheng et al., (1982), we can also solve for the tube wave velocity of the formation. This is the basis of the inversion scheme used by Stevens and Day (1986).
Another way of estimating the formation shear wave velocity is from the P-wave amplitude. The relative amplitude of the P-head-wave compared to the other modes in the waveform depends on the Poisson's ratio (and thus the shear wave velocity) of the formation, because the incident P-wave energy is converted at the borehole wall into both a refracted P-head-wave and a transmitted shear wave. Therefore, the Poisson's ratio determines the relative partitioning of wave energy in P-wave and S-wave arrivals. Cheng (1989) used this approach to invert for the S-wave velocity in marine sediments using the frequency spectral ratio of the P waves. This method is time consuming and is useful only when no Stoneley waves are present in the waveform logs.
(
Shear Logging with Shear Sources
The most direct method of measuring the shear wave velocity of the formation is "di-rect" shear wave logging. This is achieved by using non-axisymmetric sources. However, the term direct shear logging as used by Williams et al. (1984) can be misleading be-cause the source transmits energy to the formation by means of a non-axisymmetric pressure fleld composed of acoustic waves in the borehole. This source mechanism is much more effective at inducing shear waves in the formation than conventional axisym-metric sources. Currently used non-axisymaxisym-metric sources can be divided into two types: dipole sources and quadrupole sources. A dipole source generates a non-axisymmetric pulse with a positive displacement of the borehole fluid in one direction and an equal but negative displacement 1800 away in azimuth. This is usually accomplished using a
bender element (White, 1967; Zemanek et al., 1984) or a movable cylinder (Kitsunezaki, 1980; Kaneko et aI., 1989). The resulting radiation pattern of the pressure generated in the borehole has a cosinej dependence, wherej is the azimuthal angle. A quadrupole source is generated with two positive displacements 1800 from each other, and two
neg-ative displacements 900
from the positive displacements, giving a cosine 20 dependence to the radiation pattern of the source pressure fleld (Chen, 1988).
The wave modes excited by either a dipole or quadrupole source in a fluid-filled borehole are guided waves which are analogous to the tube or pseudo-Rayleigh waves excited by an axisymmetric or monopole source. The wave modes generated by a dipole source are known as flexural or bending modes; those generated by a quadrupole source are known as screw modes. A detailed discussion of these modes is given in Schmitt (1988). The fundamental or the lowest order flexural and screw modes are analogous to the tube or Stoneley wave; that is, they are interface waves resulting from the existence of a liquid-solid interface. The higher-order flexural and screw modes are analogous to pseudo-Rayleigh modes in that they require the existence of a waveguide (the borehole). Unlike the case with the monopole source, both the fundamental and the higher-order modes propagate with the formation shear wave velocity at the low frequencies. The phase velocities of the flexural and screw modes decrease with increasing frequency. No matter whether we are exciting the fundamental or the higher order flexural or screw mode, the first arrival will always travel with the formation shear wave velocity, provided the source frequency band covers at least one of the modal cutoff frequencies. Thus, formation shear wave velocity can be picked by a straightforward, two-receiver moveout algorithm as described earlier in this section.
Array Processing
Modern full-waveform acoustic logging tools have multiple receivers. In order to take advantage of this redundancy in the receiver wavefleld, we can use array processing
18 Paillet et al.
techniques to get a better estimate of the velocity of the P wave, S wave and Stoneley waves. Hsu and Baggeroer (1986) and Block et al. (1991) examine this problem using two different array-processing velocity-analysis techniques: the Maximum Likelihood Method (MLM) and Semblance cross-correlation (Kimball and Marzetta, 1984). Both MLM and Semblance velocity analysis are implemented within short time windows of given moveout across the receiver array. An example of such a window is shown in Figure 5A. r is the beginning time of the window on the near trace, T is the length of the window, and v is the slope (dx/dt) of the window. v is equal to a trial phase velocity in the direction of the array and thus the phase velocity of propagation. For a fixed time r, cross-correlation are made for a range of slownessesp = dt/dx = l/v. The window is then advanced by a small amount dr, and the process is repeated. The final result is a series of contour plots as a function of time r and velocity v (or slowness
pl.
The next two sections describe the two commonly used methods of velocity analysis: MLM and Semblance.The Maximum Likelihood Method
The Maximum Likelihood estimate of the power provides an unbiased estimate of the power of the plane wave component at the scanning slowness p. In addition, the total power estimate within the time window is minimized in order to reduce the contributions from components with slownesses near p. For a complete discussion of this subject, the reader is referred to the original development given in Duckworth (1983) and the application to waveform logging described by Block et al. (1991). For the Maximum Likelihood Method of velocity analysis, the output is power as a function of window starting timer and slowness p (or, more conveniently, velocityv) at discrete frequencies dictated by the time sampling !::.t and window lengthT. These frequencies correspond to l/T, 2/T, ...up to 1/2!::.t. An example of MLM results are shown in Figure 5B. The peaks in the p - r space correspond to P, Sand Stoneley arrivals.
Semblance
The average semblance is a trace cross-correlation with amplitude taken into account. It is the ratio of the energy of a stacked trace to the sum of the energies of the individual traces within a time window, divided by the number of traces. The values of average semblance range from zero to one. These values are averaged over the entire frequency range up to the Nyquist frequency of1/2!::.t, and are plotted as contours as a function of the window start time rand moveout velocity v. An example is shown in Figure 6C.
(
(
Prony's Method
The two velocity analysis methods described above lack frequency resolution. To over-come this problem, Parks et al. (1983), Lang et al. (1987), McClellan (1986) and Ellefsen et al. (1989) used the extended Prony's method to obtain a high resolution spectrum from which accurate dispersion curves for the guided waves were calculated. Lang et al. (1987) implemented a variation of the Prony's method to make it more robust, and Ellefsen et al. (1989) extended it to estimate attenuation as well as velocity dispersion.
Array processing of acoustic logging data using the extended Prony's method re-quires two steps: First is the application of the fast Fourier transform over time. Sec-ond is the estimation of each wave property using the extended Prony's method. This method is based upon the assumption that the Fourier transform of the trace at receiver n may be represented by a finite sum of damped exponentials.
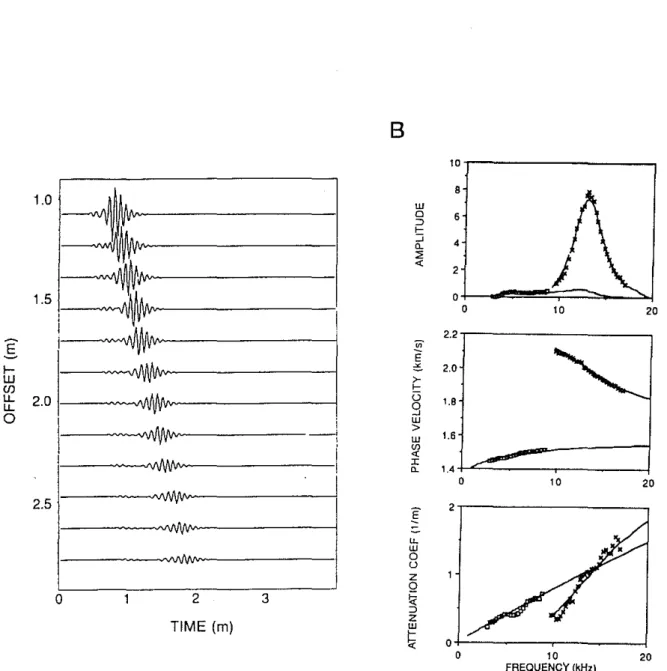
Prony's method is particularly effective in estimating the velocity dispersion of the pseudo-Rayleigh and Stoneley waves together without first having to separate them in time or frequency domain. An example of the use of Prony's method is shown in Figure 6.
APPLICATIONS OF ACOUSTIC LOGGING TO FORMATION
EVALUATION
Acoustic logging has traditionally been performed for two quite different purposes: porosity determination and correlation with surface seismic studies. In recent years, efforts to expand the applications to permeability determination, fracture characteriza-tion, lithology determinacharacteriza-tion, and mechanical-properties evaluation have been increas-ing, and meeting with various degrees of success. In this section, we will address these different aspects in turn, grouped by discipline or application.
Exploration/Delineation
The first applications of acoustic logging were for correlation with surface reflection-seismic studies. Summers and Broding (1952) described the use of early sonic logs for identifying such aspects of reflection character as positive and negative reflections, based on velocity differences. Petersen et al. (1955) described the use of synthetic seismograms generated from well log data, and demonstrated how this technique can be used to correlate seismic data with wells. In fact, the use of synthetic seismograms is routine today, using a simple model for convolving a presumed wavelet with a reflection
20 Paillet et aI.
series derived from the sonic and density logs. Note that in this discussion the term "synthetic seismogram" refers to the model of surface seismic reflections computed from conventional acoustic logs, whereas "microseismograms" represent mathematical models of acoustic full waveform logs. In comparing the seismic properties of rocks inferred using surface reflection techniques to those inferred from acoustic logs we will use the term "seismic" to refer to the results of surface seismic surveys and "sonic" to refer to acoustic logs obtained using ultrasonic frequencies.
Synthetic (Vertical-Offset) Seismograms
The synthetic seismograms generated most frequently from sonic logs are what we call vertical-incident or zero-offset seismograms; inherent assumptions are that the layers of the earth are flat-lying, and that the desired geometry consists of a seismic source and receiver both occupying a location at the wellhead. These synthetic seismograms are then used to correlate the actual recorded seismic data with the well; that is, the peaks and troughs of the seismogram may be correlated with formation boundaries with increasing or decreasing impedance (the product of velocity and density). In order for the geophysicist to compare the log with the seismic data, the sonic log is usually displayed in units of velocity (such as feet per second) and with a two-way travel-time scale, rather than a depth scale. It is often difficult to determine the quality of conventional (threshold-detection) sonic logs unless the errors are extremely large. On the other hand, most full-waveform processing techniques provide information useful in assessing the quality of the log over specific intervals. Most geophysicists are not well-trained in log interpretation, and errors in the logs that may be obvious to a log analyst are frequently converted into mysterious and poorly-correlated reflection events on the synthetic seismograms; improved communication between the log analyst and the user of the edited logs can help to reduce these problems.
In generating synthetic seismograms, it is implicitly assumed that the velocities logged by the sonic tool, at roughly 10 kHz and within inches of the wellbore, are the same as those sampled by a passing seismic wave, at frequencies of 10 - 100 Hz and wavelengths of tens or hundreds of feet. In some environments, these assumptions are valid, but in slow, unconsolidated sands and shales in particular, significant differences can occur. In these cases, check-shot surveys or vertical seismic profiles are generally used to "correct" the logged velocities to improve the match between the synthetic seismogram and the recorded surface seismic data (White, 1983). In general, the check-shot derived velocities are found to be lower than the logged velocities (Stewart et aI., 1984). This is attributed to the combined effects of velocity dispersion and propagation delays caused by resources within closely spaced beds.
Fluid
Substitution Modeling
The synthetic seismogram obtained from logging a given well may not correspond to the model a geophysicist has in mind for a nearby location. For example, the well may have penetrated a water-bearing sand, and the geophysicist has reason to suspect that a similar sand bears gas at another location. The sonic log may be altered to model the differing saturation at the new location according to well-developed theories (Gassmann, 1951). Ifboth compressional and shear wave velocities have been logged, the fluid substitution can follow directly from Gassmann's equations. Ifthere is no shear velocity available, a common assumption is that the dry-rock Poisson's ratio is constant or a function of clay content in sandstones (Hilterman, 1990), and the new values can be determined through inserting an appropriate value into Gassmann's equations.
Amplitude Variations with Offset
As a seismic wave is reflected from a formation boundary, its amplitude will vary as a function of the angle of incidence. This variation is primarily a result of the changes in Poisson's ratio (or Vp/Vs) across the interface (e.g., Shuey, 1985). Seismic "sec-tions" usually display "stacked" seismograms, where individual seismograms of varying offsets are stretched and summed together to reduce noise, increase signal, and discrim-inate against multiple reflections, surface waves, and other events that are not primary compressional reflection events. These stacked seismograms, therefore, represent some average of the reflection amplitudes over angles that vary from zero offset to the maxi-mum offset allowed, rather than the simple vertical geometry assumed in the generation of synthetic seismograms described in the preceding paragraphs. Comparison of am-plitudes of synthetic seismograms with the stacked data may be misleading for this reason.
The information contained within the amplitude variation with offset (AVO) of seismic data is useful in its own right. In order to correctly interpret or model this effect, knowledge of the Poisson's ratio of the formations is essential, and can only be obtained through shear-wave logging, whether using monopole tools in fast formations or multi pole tools in slow formations. Poisson's ratio is particularly sensitive to a small amount of gas saturation in poorly consolidated sediments, and AVO studies are often useful in identifying gas-charged sands (Ostrander, 1984). Often, shear-wave velocities are not known, and some assumptions are again made for the dry-rock properties; Payne (1991, in press) presents a case history in which these assumptions are compared with actual logged shear-wave velocities.
Anisotropy also can seriously affect the quality of the match between the synthetic seismogram and the stacked data. The logged velocity corresponds to a vertically-propagating wave in a vertical well, whereas the stacked seismogram contains elements
22 Paillet et al.
of the horizontally-propagating waves, which may travel with a different velocity. Lami-nated shales and highly-fractured carbonates are most likely to exhibit anisotropy, both for compressional and shear waves; some of the difficulty in matching synthetic seismo-grams to recorded data in sand-shale sequences may be a result of anistropy.
Formation Evaluation
The primary goal of most logging is the evaluation of formations for quality of seal, source, and reservoir. There are many aspects of this evaluation which are routinely aided by sonic data, and a few still-experimental applications look promising.
Porosity
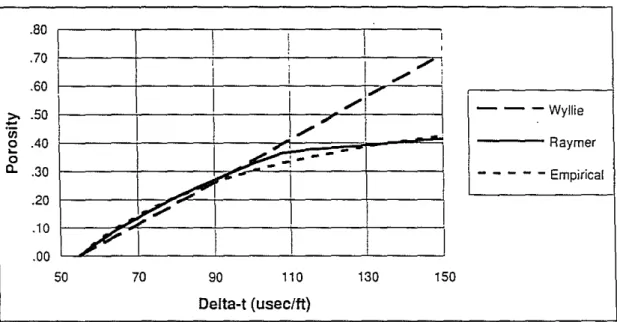
Sonic logs have long been thought of as one of the "porosity" logs (Marett and Kim-minau, 1990), even though other tools are generally superior in evaluating porosity in different rock types. In clean sands, the Wyllie et al. (1956) time-average relationship has been used extensively to provide a rough estimate of porosity; this relationship was improved somewhat by Raymer et al. (1980), a form of which is commonly used today (e.g., Schlumberger, 1987). A comparison of the Wyllie et al. (1956), Raymer et al. (1980), and the "empirical" Schlumberger (1987) models is shown in Figure 7.
Lithology
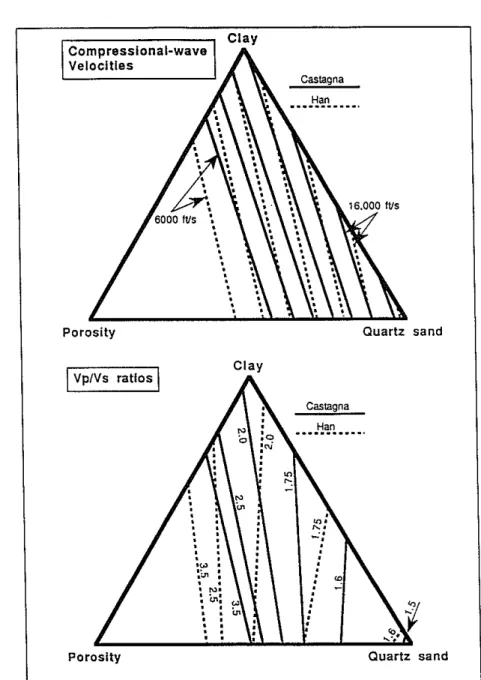
Velocities of rocks actually respond to a wide variety of properties, and porosity is just one of those, albeit an important one. Matrix mineralogy, clay content, pressure, ce-mentation type, and fluid content are all important. In order to account for these in the interpretation of logged velocities, other logging observations are needed, sometimes including shear-wave velocities obtained from full-waveform acoustic logging. For clas-tic rocks, a number of relationships between compressional-wave velocity, shear-wave velocity, porosity, and clay fraction can be found in the literature, including Castagna et al. (1985), Han et al. (1986) and Eberhart-Phillips et al. (1989). A classic study by Pickett (1963), and recent work by Krief et al. (1990), and Goldberg and Gant (1988) include relationships for carbonate rocks as well. Some of these are compared in Figure 8.
In general, a relationship between porosity or lithology and compressional- or shear-wave velocities is good only for the formations used in developing that relationship; its reliability for other rocks should be considered suspect until a calibration can be accomplished. In order to provide a first-guess estimate of the porosity or lithology, the sonic values may be used with existing relationships as they stand; but, if any confidence
(
is to be placed in these estimates (for example, in a well that, for some reason, did not have other porosity or density logs), a new relationship between porosity (or lithology) should be developed, based on comparisons made among logs in nearby wells or with core. In developing these relationships, the forms of the equations used by the existing models (Wyllie, Raymer, Krief, Han, etc.) are often useful.
Fluid Content
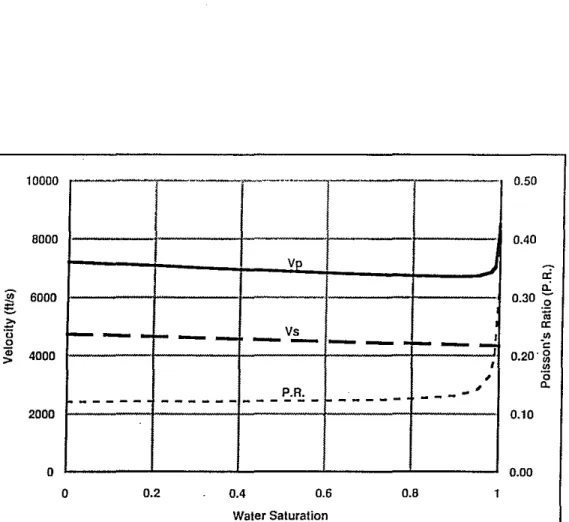
In poorly-consolidated or highiy-fractured rocks, the nature of the fluid occupying the pore spaces and fractures can have a strong influence on the compressional and shear ve-locities of the rock as a whole. Free gas, or highiy-compressible liquids (such as light oils) will tend to sharply decrease the compressional-wave velocity of loosely-consolidated sandstones, while having a very small effect on the shear-wave velocity (Figure 9). On the other hand, the velocities of most carbonates are largely unaffected by fluid satura-tion (Wang et aI., 1990), except, perhaps, when the rocks are highly-fractured (Figure 10; Kuster and Toks6z, 1974). The decrease in Poisson's ratio from partial gas satu-ration or light oil satusatu-ration has been noted in many studies (e.g., Krief et aI., 1990; Williams, 1990). In some cases, this effect can be used to find gas behind casing, but it is often used instead to model seismic response and assist in exploration and delineation. Velocities measured on rock samples in the laboratory do not always agree with sonic or seismic velocities, particularly if the rocks have non-spherical pores. Labora-tory measurements of compressional- and shear-wave velocities are generally made at frequencies of about 600 kHz - 1 MHz, and the mechanism by which pore fluids affect these velocities is likely to be different than if the observations were made at very low frequencies (the various theoretical models used to explain these observations are nicely described in a book by Bourbie et aI., 1987). Winkler (1986) has proposed using dry-rock high-frequency laboratory measurements and Gassmann (1951) theory to predict the seismic-frequency (about 10 - 100 Hz) response of saturated rocks; however, with-out extensive pore-shape modeling and application of complicated theoretical models, we cannot reliably extrapolate the sonic-frequency (about 10 kHz) response from high-frequency laboratory studies (Goldberg and Zinszner, 1989). Often, straightforward application of the laboratory results will fit the sonic-logging results, but, particularly for conditions of partial gas saturation, often they will not.
Permeability
A considerable amount of effort has been made in recent years to develop and perfect a usable permeability indicator from full-waveform sonic logs. A number of references given earlier in this paper describe the theory relating Stoneley or tube wave velocity and attenuation to permeability; the definitive pair of references for this theory is Schmitt
24 Paillet et al.
(1988a, 1988b). The few case histories published have been encouraging: Burns (1991) found that he could relate core-measured permeability to the difference between mea-sured Stoneley slowness and that predicted from (impermeable) elastic theory; Winkler et ai. (1989) found good agreement between theory and laboratory-scale models of sonic logging for both Stoneley-wave velocities and attenuation; and Dominguez and Perez (1991) found a good correlation between Stoneley-wave attenuation and permeability from logging observations in highly fractured rocks.
There is always the possibility that in any given case there exists a fortuitous rela-tionship between some sonic-logging observation and the permeability of a formation. For the models that have been developed theoretically to be readily applied, the logging must be made with a tool that has excellent low-frequency response, without contam-ination by a tool wave at low frequencies and velocities. The newer acoustic-logging tools have been designed with this in mind; we should expect to see increasing use of Stoneley characteristics for permeability determination with the increasing availability of these tools in commercial wells.
Fractures
Fractures that intersect a wellbore present a sudden contrast in elastic properties to any elastic wave that travels along the wellbore. The most significant features often prove to be the reflections of various modes, particularly Stoneley waves, and the attenuation of Stoneley waves across fractured intervals. Case studies have been presented by Hardin et ai. (1987), Hornby et ai. (1989, 1992), and Arditty et ai. (1991), among others. For these techniques to work well, the analyst or interpreter must be able to differentiate between reflections caused by lithologic changes or changes in hole size, and those that are caused by true fractures; this may restrict such studies to wells that are roughly in gauge and without frequent bed boundaries. On the other hand, Stoneley-wave studies may have a particular advantage over other types of fracture studies by being able to provide a measure of the fracture transmissivity (or permeability) with a depth of investigation of several inches (see, for example, the discussions by Palllet, 1991; Hornby et al., 1989).
Through-Casing Logs
One important aspect of full-waveform acoustic logs is the ability to log for both P-and S-wave velocities through casing (Tubman et aI., 1984; Chen P-and Eriksen, 1991). The casing must be reasonably well-bonded to the cement and to the formation, a requirement that sometimes can be met by pressuring the well, as is done for cement-bond logging. In areas where fluid loss or excessive pressures require casing prior to logging, the additional benefit of the acoustic-log data can be very valuable. Itis often
(
(
a good idea, in these cases, to run the sonic log just after the cement-bond log, using the same surface pressure equipment. The chances of obtaining a good log after the well has been perforated, and without increasing the pressure, are lessened, but often good enough to warrant the effort. An interesting case history of finding gas behind casing, by comparing porosity derived from the cased-hole acoustic log with a cased-hole neutron porosity log, is presented in a paper by Georgi et al. (1991).
Completion and Mechanical Properties
The completion strategy for many oil and gas wells is determined by evaluating the desired fiow rate of various fluids (gas, oil, water, and condensate) and the capacity of the formation to deliver the fluids at that rate. Sometimes, the well must be stimulated by hydraulic fracturing to increase the effective communication of the well with the formation; at other times, the formation is considered too weak to support the stress imbalance at a flowing wellbore, and the well is treated with a gravel-pack. Both of these evaluations require estimates of the in situ stresses and formation strength; these properties are often obtained from the acoustic log, preferably using both compressional and shear values (Sams and Goldberg, 1990).
Hydraulic Fracture Design
In designing a hydraulic fracture program for a well, the engineer requires estimates of the stresses in the formation opposing the opening of a fracture within it, and the tensile strength of the rock (commonly assumed to be near zero due to the likely exis-tence of small natural fractures). The local stress profile is often assumed to be a result of overburden stresses, which try to "push" the formation out sideways. A critical as-sumption may then be made: the formation is laterally confined, and resists deformation sideways; the stresses opposing the deformation are the lateral stresses in the forma-tion. Of course, this assumption neglects the possibility of unbalanced lateral stresses which result in mountain building and other geologic phenomena. However, with this assumption, the computation of lateral stresses is almost trivial:
V
STRESShorizantal
=
--STRESSooerburden I - vwhere v is Poisson's ratio (Coates and Denoo, 1981). Of course, Poisson's ratio is often best determined from full-waveform acoustic logging. This relationship must be calibrated locally, and corrected for the neglected tectonic stresses, poroelastic effects, and other factors (Ahmed et a!., 1988).
26
Sanding Potential
Paillet et aI.
The problem for determining the likelihood that a formation will fail, and produce sand along with fluids, is similar to that for designing a hydrauiic fracture, although the strength of the rock becomes much more important. Simple relationships have been developed for flnding the strength from logged elastic properties (Coates and Denoo, 1981), and laboratory calibration of rock strength from core samples can improve these relationships considerably (Edwards, 1988; Jizba, 1991). Recognize, however, that the formations being evaluated for sanding potential are typically slow formations, and multipole tools are required to obtain reliable shear-wave velocities.
Perforation Penetration
A completions engineer usually tries to design a perforating program to result in, among other things, very deep penetration of the charge into the formation. Recent work has suggested, based on laboratory studies, that the depth of penetration may be predictable from elastic properties such as compressional-wave velocity (Halleck et aI., 1991).
Summary of Applications
The applications of full-waveform acoustic logging extend to a number of disciplines within the oil and gas industry, and also to various other geotechnical activities, such as hazardous-waste disposal, water-well design, and related technologies. Various aspects of the logging are required for different applications. These are summarized in Table l. Keep in mind that the state-of-the-art is continually changing, and newer and better tools and interpretation techniques will work to modify this chart as time goes on.
(
Table 1. The various modes of full-waveform acoustic logging required or helpful for different applications.
Discipline and Application DTC DTS Stoneley
Exploration/Delineation (seismic)
Synthetic zero-offset seismograms X
Amplitude-versus-Offset studies X X Fluid-substitution modeling X X Formation Evaluation Porosity X
±
Lithology X X Fluid content X X Permeability±
±
X Fractures±
X Through-casing logs X X Completion/Mechanical ProperitesHydraulic fracture design X X
Sanding potential X X
Perforation penetration X
±
Key: DTC
=
Compressional-wave log DTS = Shear-wave logStoneley
=
Stoneley wave properties28 Paillet et al.
REFERENCES
Ahmed, D., M.E. Markley, S.F. Crary, and O.Y. Liu, 1988, Enhanced in-situ stress profiling using microfrac, core, and sonic logging data, SPE 19004, presented at SPE/Rocky Mountain Region/Low Permeability Reservoirs Symposium and Exhi-bition, Denver, CO.
Arditty, P.C., D. Fait, F. Mathieu, and P. Staron, 1991, Characterization of fractured hydrocarbon reservoirs using the EVA acoustic logging tool, The Log Analyst, 32, 215-232.
Baker, L.J., 1984, The effect of the invaded zone on the full wavetrain acoustic logging, Geophysics,
49,
796-809.Biot, M.A., 1956a, Theory of propagation of elastic waves in a fiuid saturated porous rock. 1. Low frequency range, J. Acoust. Soc. Am., 28, 168-178.
Biot, M.A., 1956b, Theory of propagation of elastic waves in a fiuid saturated porous rock. II. Higher frequency range, J. Acoust. Soc. Am., 28, 179-191.
Block, L.V., C.H. Cheng, and C.L. Duckworth, 1991, Velocity analysis of multi-receiver full waveform acoustic logging data in open and eased holes, The Log Analyst, 32, 188-200.
Bourbie, T., O. Coussy, and B. Zinszner, 1987, Acoustics of Porous Media, Editions Technip, Paris.
Burns, D.R., 1991, Predicting relative and absolute variations of in situ permeability from full-waveform acoustic logs, The Log Analyst, 32, 246-255.
Castagna, J.P., M.L. Batzle, and R.L. Eastwood, 1985, Relationships between compressional-wave and shear-compressional-wave velocities in clastic silicate rocks, Geophysics, 50, 571-581.
Chen, S.T., 1988, Shear-wave logging with dipole sources, Geophysics, 53, 659-667. Chen, S.T., 1989, Shear wave logging with multi-pole sources, Geophysics,
54,
590-517. Chen, S.T., and E.A. Eriksen, 1991, Compressional and shear-wave logging in open andcased holes using a multipole tool, Geophysics, 56, 550-557.
Chen, S.T., and D.E. Willen, 1984, Shear wave logging in slow formation, Trans. 25th SPWLA Ann. Logging Symp., DDI-DDI8.
Cheng, C.H., 1989, Full waveform inversion of P waves for Vs and Qp, J. Geophys. Res.,
94,
19619-19625.Cheng, C.R., and M.N. Toks6z, 1982, Generation, propagation and analysis of tube waves in a borehole, Trans. 23rd SPWLA Ann. Logging Symp., P1-P26.
Cheng, C.H., M.N. Toks6z, and M.E. Willis, 1981, Velocity and attenuation from full waveform acoustic logs, Trans. 22nd SPWLA Ann. Logging Symp., Paper 01-019. Cheng, C.H., M.N. Toks6z, and M.E. Willis, 1982, Determination of in situ attenuation
from full waveform acoustic logs, J. Geophy. Res., 87, 5477-5484.
Coates, G.R, and S.A. Denoo, 1981, Mechanical properties program using borehole analysis and Mohr's circle, in Trans. 29th SPWLA Ann. Logging Symp., DD1-DD17. Dominguez, H., and G. Perez, 1991, Permeability estimation in naturally fractured fields
by analysis of Stoneley waves, The Log Analyst, 32, 120-128.
Duckworth, G.L., 1983, Processing and inversion of Arctic Ocean refraction data, Sc.D. Thesis, Joint Program in Ocean Engineering, Mass. lnst. Tech., Cambridge, Mass., and Woods Hole Oceanographic lnst., Woods Hole, Mass.
Eberhart-Phillips, D., D.H. Han, and M.D. Zoback, 1989, Emperical relationships among seismic velocity, effective pressure, porosity, and clay content in sandstone, Geo-physics,
54,
82-89.Edwards, D., H. Joranson, and J. Spurlin, 1988, Field normalization of formation me-chanical properties for use in sand control management, Trans. 29th SPWLA Ann. Logging Symp., Y1-Y19.
Ellefsen, K.J., C.H. Cheng, and K.M. Tubman, 1989, Estimating phase velocity and attenuation of guided waves in acoustic logging data, Geophysics,
54,
1054-1059. Gardner, G.H.F., M.RJ. Wyllie, and D.M. Droschak, 1964, Effects of pressure and fluidsaturation on the attenuation of elastic waves, J. Petro Tech., 16, 189.
Gassmann, F., 1951, Elastic waves through a packing of spheres, Geophysics, 16, 673-685.
Georgi, D.T., RG. Heavysege, S.T. Chen, and E.A. Eriksen, 1991, Application of shear and compressional transit-time data to cased-hole carbonate reservoir evaluation, The Log Analyst, 32, 129-143.
Goldberg, D., and W.T. Gant, 1988, Shear wave processing of sonic log waveforms in a limestone reservoir, Geophysics, 53, 668-676.
Goldberg, D., and B. Zinszner, 1989, P-wave attenuation measurements from laboratory resonance and sonic waveform data, Geophysics,
54,
76-8l.30 PaiIlet et al.
logging evaluates vertically fractured reservoirs, Trans. 28th SPWLA Ann. Logging Symp., QQ1-QQ13.
Guyod, H., and L.K Shane, 1969, Geophysical Well Logging, 1, Introduction to Logging and Acoustic Logging, Guyod, Houston, 256 p.
Halleck, P., D. Wesson, P. Snider, and M. Navarette, 1991, Prediction of in-situ shaped charge penetration using acoustic and density logs, SPE Trans. 66th Ann. Tech.
Con!, in press.
Han, D.H., A. Nur, and D. Morgan, 1986, Effects of porosity and clay content on wave velocities in sandstones, Geophysics, 51, 2093-2107.
Hardin, KL., C.H. Cheng, F.L. Paillet, and J.D. Mendelson, 1987, Fracture character-ization by means of tube waves in fractured crystalline rock at Mirror Lake, New Hampshire, J. Geophys. Res., 92, 7989-8006.
Hilterman, F., 1990, Is AVO the seismic signature of lithology? A case history of Ship Shoal-South Addition, The Leading Edge, g, 15-22.
Hornby, B.E., D.L. Johnson, K.H. Winkler, and R.A. Plumb, 1989, Fracture evaluation from the borehole Stoneley wave, Geophysics, 54, 1274-1288.
Hornby, B.E., S.M. Luthi, and R.A. Plumb, 1992, Comparison offracture apertures com-puted from electrical borehole scans and reflected Stoneley waves, The Log Analyst, 33, 50-66.
Hsu, K., and A.B. Baggeroer, 1986, Application of the maximum-liklihood method (MLM) for sonic velocity logging, Geophysics, 51, 780-787.
Jizba, D., 1991, Uniaxial compressive strength in tight gas sandstones and shales, Topical Report, March 12, 1991, Gas Research Institute, GRI-9l/0l06, 58 p.
Kaneko, F., T. Kanemori, and K. Tonouchi, 1989, Low-frequency shear wave logging in unconsolidated formations for geotechnical applications, in Geophysical Applications for Geotechnical Investigations, F.L. Paillet and W.R. Saunders, eds., ASTM STP 1101, 79-98.
Kimball, C.V., and T.L. Marzetta, 1984, Semblance processing of borehole acoustic array data, Geophysics, 4g, 274-281.
Kitsunezaki, C., 1980, A new method for shear wave logging, Geophysics, 45, 1489-1506. Koerperich, E.A., 1979, Shear wave velocities determined from long and short spaced
borehole acoustic devices, Soc. Petro Engr. Paper SPE 8237, 12 p.
Krief, M., J. Garat, J. Stellingwerff, and J. Ventre, 1990, A petrophysical interpretation
(
(
l
using the velocities of P and S waves (full-waveform sonic), The Log Analyst, 31, 355-369.
Kurkjian, A.L., 1985, Numerical computation of individual far field arrivals excited by an acoustic source in a borehole, Geophysics, 50, 1438-1449.
Kurkjian, A.L., 1986, Theoretical far-field radiation from a low-frequency horizontal point force in a vertical borehole, Geophysics, 51, 930-939.
Kuster, G.T., and M.N. Toksoz, 1974, Velocity and attenuation of seismic waves in two-phase media, part 1. theoretical formulations, Geophysics, 39, 587-606.
Lang, S.W., A.L. Kurkjian, J.H. McClellan, C.F. Morris, and T.W. Parks, 1987, Esti-mating slowness dispersion from arrays of sonic logging data, Geophysics, 52, 1279-1289.
Liu, O.Y., 1984, Stoneley wave-derived Dt shear log, Trans. 25th SPWLA Ann. Logging Symp., ZZl-ZZ14.
Marett, G. and S. Kimminau, 1990, Logs, charts, and computers, the history of log interpretation modeling, The Log Analyst, 31, 335-354.
McClellan, J.H., 1986, Two-dimensional spectrum analysis in sonic logging, Acoust., Speech, Signal Processing Magazine, 3, 12-18.
Ostrander, W.J., 1984, Plane-wave reflection coefficients for gas sands at nonnormal angles of incidence, Geophysics, 49, 1637-1648.
Paillet, F.L., 1991, Use of geophysical well logs in evaluating crystalline rocks for siting of radioactive-waste repositories, The Log Analyst, 32,85-107.
Paillet, F.L., and C.H. Cheng, 1986, A numerical investigation of head waves and leaky modes in fluid-filled boreholes, Geophysics, 51, 1438-1449.
Paillet, F.L., and C.H. Cheng, 1991, Acoustic Waves in Boreholes - The Theory and Application of Acoustic F'ull- Waveform Logs, CRC Press, 264 p.
Paillet, F.L., C.H. Cheng, and J.A. Meredith, 1987, New applications in the inversion of acoustic full waveform logs-relating mode excitation to lithology, The Log Analyst, 28, 307-320.
Paillet, F.L., and J.E. White, 1982, Acoustic modes of propagation in the borehole and their relationship to rock properties, Geophysics, 47, 1215-1228.
Parks, T.W., J.H. McClellan, C.F. and Morris, 1983, Algorithms for full-waveform sonic logging, in Proc. 2nd Acoust., Speech, Signal Processing Workshop on Spectral Esti-mation, 186-191.
32 Paillet et al.
Payne, M. A., 1991, Shear-wave logging to enhance seismic modeling, Geophysics, in press.
Peterson, RA., W.R Fillippone, and F.B. Coker, 1955, The synthesis of seismograms from well log data, Geophysics, 20, 516-538.
Pickett, G.R; 1960, The use of acoustic logs in the evaluation of sandstone reservoirs, Geophysics, 25, 250.
Pickett, G.R., 1963, Acoustic character logs and their applications in formation evalu-ation, J. Petro Tech., 15, 650-667. .
Raymer, L.L., E.R Hunt, and J.S. Gardner, 1980, An improved sonic transit time to porosity transform, Trans. 21st SPWLA Ann. Logging Symp., PP1-PP12.
Rosenbaum, J.H., 1974, Synthetic microseismograms-logging in porous formations, Geo-physics, 3g, 14-32.
Sams, M., and D. Goldberg, 1990, The validity of Q estimates from borehole data using spectral ratios, Geophysics, 55, 97-10l.
Schlumberger, 1987, Log Interpretation Principles/Applications, Schlumberger Educa-tional Services, Houston, TX, 198 p.
Schmitt, D.P., 1988, Shear wave logging in elastic formations, J. Acoust. Soc. Am., 84, 2215-2229.
Schmitt, D.P., M. Bouchon, and G. Bonnet, 1988a, Full-wave synthetic acoustic logs in radially semi-infinite saturated porous media, Geophysics, 3, 807-823.
Schmitt, D.P., Y. Zhu, and C.H. Cheng, 1988b, Shear wave logging in semi-infinite satured porous formations, J. Acoust. Soc. Am.,
84,
2230-2244.Shuey, RT., 1985, A simplification of the Zoeppritz equations, Geophysics, 50,609-614. Stevens, J.L., and S.M. Day, 1986, Shear velocity logging in slow formations using the
Stoneley wave, Geophysics, 51, 137-147.
Stewart, RR, P.D. Huddleston, and T.K. Kan, 1984, Seismic versus sonic velocity, a vertical seismic profile study, Geophysics, 4g, 1153-1168.
Summers, G.C., and RA. Broding, 1952, Continuous velocity logging, Geophysics, 17, 598-614.
Tang, X.M., C.H. Cheng, and F.L. Paillet, 1991, Modeling borehole Stoneley wave propa-gation across permeable in-situ fractures, Trans. 32nd SPWLA Ann. Logging Symp., GGl-25.
(
'lUbman, KM., C.H. Cheng, and M.N. ToksDz, 1984, Synthetic full waveform acoustic logs in cased boreholes, Geophysics, 4g, 1051-1059.
Wang, Z., W.K Hirsche, G. Sedgwick, 1990, Seismic velocities in carbonate rocks, Petroleum Soc. of GIM/ Society of Petroleum Engineers, Paper No. GIM/SPE
90-11, 1-21.
White, J.E., 1983, Underground Sound - Applications of Seismic Waves, New York, Elsevier, 249 p.
White, J.E., 1967, The hula log-a proposed acoustic tool, Trans. 8th SPWLA Ann. Logging Symp., Il-I27.
Winkler, KW., 1986, Estimates of velocity dispersion between seismic and ultrasonic frequencies, Geophysics, 51, 183-189.
Winkler, KW., H.L. Liu, and D.L. Johnson, 1989, Permeability and borehole Stoneley waves, comparison between theory and experiment, Geophysics, 54, 66-75.
Willis, M.E. and M.N. ToksDz, 1983, Automatic P and S velocity determination from full waveform acoustic logs, Geophysics, 48, 1631-1644.
Winbow, G.A., 1988, A theoretical study of acoustic S-wave and P-wave velocity logging with conventional and dipole sources in soft formations, Geophysics, 53, 1334-1342. Wyllie, M.R.J., A.R. Gregory, and L.W. Gardner, 1956, Elastic wave velocities in
het-erogeneous and porous media, Geophysics, 21, 41-70.
Zemanek, J., F.A. Angona, D.M. Williams, and R.L. Caldwell, 1984, Continuous acous-tic shear wave logging, Trans. 25th SPWLA Ann. Logging Symp., UI-UI4.
Zemanek, J., D.M. Williams, and D.P. Schmitt, 1991, Shear-wave logging using multi-pole sources, The Log Analyst, 32, 233-241.
34 Paillet et aI. A B ( ( ( SOU ACE 1 61\=10 +12 ,1, AT2=To·T2+T, 61, +llTt 2 '"To T, BOREHOLE
"\mIK'
/DIAMETEA I""'" CHANGE T,'Z
r
T, E=[T.
~ Jn11// J--11l1II T, SQUACE2--FAA RECEIVER 6T= (21,+T..+Tal - (21,+ T.. ) T, - CENTRALIZING BOWSPAINGS.L---r-1>mI,..-+1r--NEAR RECEIVER
D.Z
SOURCE _ _-I-'"'/""
ACOUSTIC
INSULATORI _ _--r
Figure 1: Conventional acoustic logging equipment: A) tool with single source and two receivers; and B) "compensated" tool with two sources and two receivers.
0 . 9 , - - - ,
1 . 6 , - - - , PHASE SHALE GROUP n=2 I I I I \ \ \ \ SANDSTONE'\\
\ \ \ \ \ n=1 \ \"
\ ..._-~~---"
'
..._---_.
1.4 1.2 0.6 1.0 - - PHASE - - - - GROUP \ \ n=2 \ \ \\
\
\ \ \,'
...
_~~--:===-::::::.=::~==::=== n=10.9
0.7 ~g
...J!Ii
o W N :J""
::;; a: o z 0.6 ' - _ ' - ' - _ - - - - '_ _- l_ _....L_ _-.L_ _- ' 0.0 2.5 5.0 7.5 10.0 12.5 15.0 0.62L-~-'-~--'_~-'--~__'_~__'_~_'_-'-_l4 6 8 10 12 14 16 FREQUENCY (kHz) FREQUENCY (kHz)Figure 2: Phase and group velocities computed for dipole (n=l,m=l) and quadrupole (n=2,m=1) modes for sandstone and shale lithologies.
36 Paillet et al.
SANDSTONE
SHALE
A n=O\
m=O,
, 8 n=1 m=O/v
IV"
,.
C n=2 m=O ~II ..
IVV't
.
A n= 0 m=Ol
~
8 n ' 1 m=OII
\j1
, C n=2 m=O.
\I1
, w o ::::> f-::; Q. ::;«
o w N ::;«
::; a:o
z
0.000 0.001 0.002 0.003 0.004 a 2 3 4 5TIME (sec) TIME (ms)
Figure 3: Computed waveforms for monopole (A), dipole (B), and quadrupole (C) excitation of the fundamental(m=O) mode for sandstone and shale lithologies; arrow denotes shear arrival time.
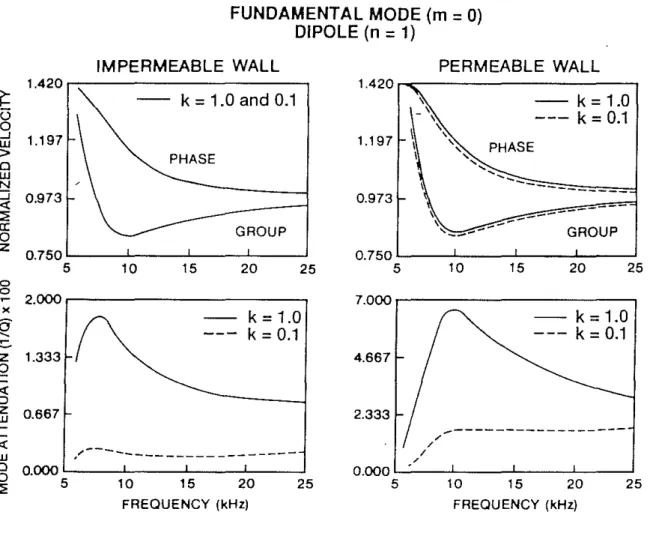
FUNDAMENTAL MODE (m
=
0)DIPOLE (n
=
1)IMPERMEABLE WALL PERMEABLE WALL
1.420 1.420 ~
- -
k = 1.0 and 0.1 - k= 1.0 U - - - k=
0.1 0 ...J 1.197 1.197 w PHASE > PHASE 0 w N---:::i 0.973 0.973
«
---
----::;;
,
---ex: GROUP
,
,
---
GROUP0
---z 0.750 0.750 5 10 15 20 25 5 10 15 20 25 0 0 2.000 7.000 )( k=
1.0 k = 1.0 5'-
~ k = 0.1 k = 0.1 z 1.333 4.667 0 i=«
::J z 0.667 2.333 wI:::
/---
---«
.'---
/ W / / 0 0.000 0.000 0 5 10 15 20 25 5 10 15 20 25 ::;; FREQUENCY (kHz) FREQUENCY (kHz)Figure 4: Example of the effect of permeability on wave mode attenuation given for the fundamental mode of a dipole source for models with and without impermeable barriers at the borehole wall; water saturated sandstone lithology (adapted from results given by Schmitt et a!., 1988a).