HAL Id: hal-02990349
https://hal.umontpellier.fr/hal-02990349
Submitted on 5 Nov 2020
HAL is a multi-disciplinary open access
archive for the deposit and dissemination of
sci-entific research documents, whether they are
pub-lished or not. The documents may come from
teaching and research institutions in France or
abroad, or from public or private research centers.
L’archive ouverte pluridisciplinaire HAL, est
destinée au dépôt et à la diffusion de documents
scientifiques de niveau recherche, publiés ou non,
émanant des établissements d’enseignement et de
recherche français ou étrangers, des laboratoires
publics ou privés.
Distributed under a Creative Commons Attribution| 4.0 International License
THE WAN-TZU-LIAO SAND BARRIER (TAÏWAN)
Lucie Campmas, Frédéric Bouchette, Samuel Meulé, Lise Petitjean, Damien
Sous, Jiing-Yih Liou, Romain Leroux-Mallouf, François Sabatier,
Hwung-Hweng Hwung
To cite this version:
Lucie Campmas, Frédéric Bouchette, Samuel Meulé, Lise Petitjean, Damien Sous, et al.. TYPHOONS
DRIVEN MORPHODYNAMICS OF THE WAN-TZU-LIAO SAND BARRIER (TAÏWAN). Coastal
Engineering, Elsevier, 2014, Proceedings of 34th Conference on Coastal Engineering, Seoul, Korea,
2014, 34, pp.sediment.50. �10.9753/icce.v34.sediment.50�. �hal-02990349�
Campmas Lucie1, Bouchette Frédéric1, Meulé Samuel2, Petitjean Lise1 3, Sous Damien3, Liou Jiing-Yih4,
Leroux-Mallouf Romain1, Sabatier Francois2, Hwung-Hweng Hwung4
This study focuses on the dynamics of the Wan-Tzu-Liao sand barrier when it is struck by one typhoon, a group of typhoons or the whole season of typhoons and monsoon. In the framework of the KUN-SHEN project, 7 months of monitoring (2011-2012) provided 20 topobathymetric surveys (within a 200 m long segment of the barrier from the subtidal zone to the back-barrier) and acquisitions of offshore, nearshore and shallow water hydrodynamics including velocity profiling, free surface measurement and absolute pressure. Offshore waves were extracted at Cigu buoy (18 m of water depth). Nearshore waves were acquired from the current profiler deployed 400 m off the coast in 4 m of water depth and water level on the subaerial beach were acquired from two pressure sensors deployed in the lower part of the subtidal zone and the dune crest. Morphologic changes of the emerged beach were monitored using D-GPS each week during winter monsoon season and just before and after each event during summer typhoons season. Amongst the eight studied typhoons, TALIM is the most energetic event observed. Offshore wave height reached Hs= 10.34
m (Tp= 14.6 s) at Cigu buoy and Hs= 2.3 m (Tp= 13.4 s) at the profiler. Surface waves dynamics throughout surf
and swash zones are progressively dominated by infragravity motions. A part of the dune is surged at the storm apex. Morphological changes include 6.7 m of dunefoot retreat and a sand transfer from a dune breach to wash-over deposits in the lagoon. More surprisingly, the foreshore was nourished (2261 m3+/- 268 m3) as well as the whole sand barrier
(+1920 m3+/- 1071 m3). The sand input is concomitant to the redistribution of sand from the intertidal sandbars
interpreted as the ultimate stage of the subtidal bars landward migration. Although winter are erosive season (-4995 m3+/- 1071 m3), the summer results in an accretion period (3556 m3+/-1071 m3) with a shoreline seaward shift about
10.4 m. Over the annual time period, the sand barrier recorded 18.4 m of retreat coupled with a small sand loss (-1439 m3+/- 1071 m3) without any significant abrasion of the dune-top.
Keywords: typhoon; moderate/extreme storm-impact; morphodynamics
INTRODUCTION
Beach morphodynamics have received an increasing interest during past decades, see e.g. (Komar, 1998; Short, 1999; Dean and Walton, 2006; Dronkers, 2005). Over a wide spectrum of time scales, the sed-imentary beach dynamic is controlled by several factors including meteorologic and hydrodynamic forc-ings (wind, atmospheric pressure, wave, instantaneous sea level and tide), sand size/composition, initial morphologies, geological settings and mean sea-level history (Coco et al., 2014). Ruggiero et al. (2005) highlighted the importance of improving our understanding of beach behaviour associated with storms on several time-scales, including the interaction between environmental forcing and coastal morphology occurring over a wide range of time (from second to decades) and space scales (from centimeter to kilome-ters). However, interactions and feedback between the maximum excursion of waves on the beach (run-up) and emerged beach changes have been shown to play a great role in the beach response to storms. Four conceptual model regimes have been proposed by Sallenger (2000). The swash regime driven by mildest conditions results in a moderate setup at the shore and morphologic changes of the berm. In this case, the sand eroded is generally moved offshore. The collision regime occurs during more severe wave conditions and induces foreshore and dune-front erosion by scarping. The dune surge process displays the overwash regimeresulting from severe elevation of the sea level under heavy energetic conditions induced a landward sand transport. Inundation is the final and most extreme regime and occurs when the beach and dunes are completely and continually under water, leading to dune erosion and/or island breaching. Based on these models, several studies helped to detail the relationships between sea level and morphologic responses of the beach when the system is forced by paroxysmal wind and waves conditions (hurricane in U.S coasts or typhoon in the Western Pacific) (Stone et al., 1993; Morton et al., 1995; Stone et al., 2004; Donnelly et al., 2004; Houser et al., 2008; Qi et al., 2010; Stockdon et al., 2007; Plant and Stockdon, 2012; Masselink and Heteren, 2013; Roberts et al., 2013).
In this context, our study aims at investigating the interactions between wave, water level and mor-phology of a sand barrier driven by paroxysmal conditions over time scales ranging from event to seasons. The main part of the paper presents field hydro-morphodynamical data from a single typhoon to the entire
1Géosciences Montpellier, Montpellier University, France 2CEREGE, Aix-Marseille University, France
3Toulon-Var University, France
typhoon and monsoon seasons. In the discussion, we propose a new conceptual model of beach morphody-namics subjected to monsoon and typhoons conditions.
SETTINGS
Geodynamics context
In taïwan, the seismic activity, the rapid rates of convergence, the deformation and erosion reveal a highly active tectonic setting, driving severe geological hazards such as landslides or earthquakes (Suppe, 1984; Lallemand et al., 2013).
Regarding morphology of the island, strong discrepancies occur between East facing the Pacific Ocean and West along the Taïwan Strait. The East coasts consists of rocks and gravel and high mountains (many of them are more than 3000 m high) plunging down into the sea with a steep slope (slope in order of 1 in 10; (Ou et al., 2002)), resulting in 4000 m of water depth less than 50 km off the coast. Conversely, the western coastal plains, which are our areas of interest, consist of finer sand with a very mild slope (slope in order of 1 in 200 to 500; (Ou et al., 2002)) due to the occurrence of the Taïwan strait. Taïwan straight is 350-400 km long, 180-200 km large and less than 60 m deep continental shelf between Taïwan and mainland China (Lin et al., 2005; Liao et al., 2008; Zhang et al., 2013).
Hydro-morphodynamics context
Taïwan Island is exposed both to geological tectonic hazards (landslides and earthquakes) and extreme meteorological events. The wind and wave climates are governed by the alternating monsoon and typhoons seasons (Jan et al., 2002). We focus here on the hydro-morphodynamic context of the south-western coast of Taïwan. The monsoon season (from October to March) drives a roughly constant North wind of 5-6 m/s inducing southward alongshore drift. Significant wave height (Hs) ranges from 1 to 1.5 m and wave
period ranges between 6 and 8 s (Liao et al., 2008; Chen and Kuo, 2008). Summer typhoons season (from May to September) is a mix between long fair weather periods and short but highly energetic conditions during typhoons and tropical storms. The former are associated to small waves (Hs < 1 m, 4 < Tp < 7s)
(Zhang et al., 2013) while the six to eight typhoons crossing or passing close to the island each year (Lin, 2013; Zhang et al., 2013) drive extreme winds, waves (32 m during the typhoon Krosa in 2007 (Liu et al., 2008)) and rain falls (2777 mm of water measured during the Morakot typhoon in 2009 (Ge et al., 2010)). Typhoons are mainly generated in either the South China Sea or the North-West Pacific Ocean East of the Philippine islands (Ou et al., 2002). From April to May, the spring winds correspond to a transitional period between monsoon and summer regimes.
Forced by the wind regimes described above, the hydrodynamics of the Taïwan strait (Jan et al., 2002) is strongly enhanced by the shallowness. The mean current is mainly southward during winter and northward during summer (reaching 1.7 m/s during the Haitan typhoon in 2005) (Chang et al., 2010, 2014). Typhoons have been observed to occasionally reverse the direction (Wu and Hsin, 2005; Zhang et al., 2013). Along the southwestern coast of Taïwan studied here, the tide is semi-diurnal and ranges about 2.68 m (Chen and Kuo, 2008).
Chen and Kuo (2008) prove the eroding context of the region working on the Waisanding sand barrier 40 km northern the study area. Due to coastal structures interrupting sand supply from the major river Choushi (and others smaller rivers), the Waisanding sand barrier migrates south-westernward about 70-90 m/yr since 1986 coupled with erosion about 65 to 80 m/yr.
The study area
The Cigu lagoon is one of the most attractive oyster-farming site along the south-western coasts of Taïwan. The lagoon is 3 km wide, 9 km long and 5 m of maximum water depth. The sediment is mainly sand transported within the lagoon by inlet currents and dune surge processes during storms. The lagoon shores are strongly anthropized. By contrast, the Wan-Tzu-Liao sand barrier which separates the lagoon from the open sea remains mainly a natural site (except extreme north and south parts where roads attach the barrier to the land (Campmas et al., 2014)).
The Wan-Tzu-Liao sand barrier is 9 km long. The width of the emerged barrier ranges between 100 m and 600 m with dune height between 1 and 10 m above the mean sea level (MSL). Occurrence of several wash-over fans and inlets in the historical archives gives evidence of constant dynamics of the barrier island through time. The long-term shoreline changes since 1993 suggest cross-shore sediments transfers in the north part. The elongated spit in the south area evidences a more important and regular
longshore transport of sediments driven by northern wind of monsoon reshaping the barrier southward. The randomized distribution of the inlets in the north suggests a weaker longshore drift in this zone with respect to the crosshore processes. The study area is defined in the north part of the barrier (middle island, in the vicinity of a tidal inlet formed in 2008) where cross-shore processes are dominant during typhoons performing a major control of the short and long-term shoreline changes (Campmas et al., 2014). Studied area is 200 m long × 300 m width with 2 to 3 m of dune height above MSL covered by vegetation. The grain size is almost homogeneous with d50about 0.19 mm composed by 97.64 % of sand and 2.36 % of silt.
Figure 1: Location of the study area. a) Taïwan in the North-western Pacific and b) the study area along the Wan-Tzu-Liao sand barrier system.
METHODOLOGY
In the framework of the KUN-SHEN project, 7 months of monitoring (from November 2011 to Septem-ber 2012) provided offshore wind and wave, tide and surf to swash free surfaces measurements as well as topographic data of the emerged beach.
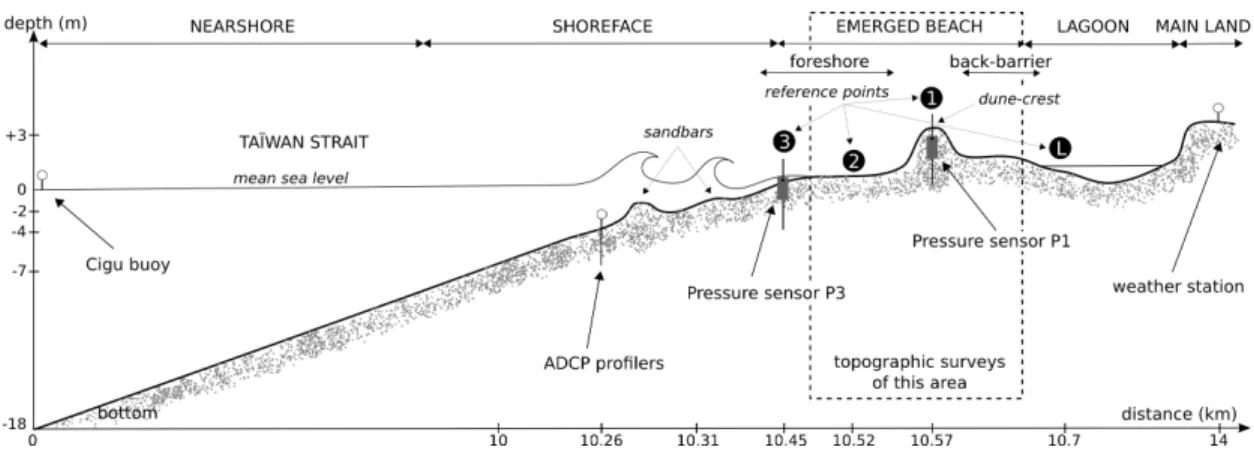
Offshore wind and wave conditions were obtained from the Cigu buoy (from Taiwanese Central Weather Bureau) located in 18 m of water depth. Wave conditions from surf zone to the swash zone were respectively acquired from one RDI current profiler (2Hz acquisition frequency) deployed in 4 m of water depth and pressure sensors (5Hz of measure frequency) deployed in the subtidal zone (P3) and buried in the dune crest (P1). Each instrument is fixed to a stainless steel frame (6 m long, 10 cm of diameter and 3 mm of thickness) deeply buried vertically in the sand (figure 2). In the lagoon, tide and inland wind conditions were respectively obtained from tidal gauge located northern in the Chung-Chin Harbor (figure 1b) and from inland weather station in the east coast (figure 2a).
Additionally, 20 topographic surveys of the emerged beach (i.e from the subtidal zone to the back-barrier) were conduced to provide Digital Elevation Models (DEM) of the beach, crosshore and longshore alti-bathymetric profiles and description of grain size distribution/ composition. Surveys were performed each week in winter and just before and after each storm during summer. Using a kinematic RTK D-GPS (Trimble R8;+/- 5 cm in elevation and +/- 2 cm in X and Y.), profiles are measured at the same cross-shore location for each survey while measurements of whole study area follow a grid at the accuracy of several points per m2. Spatial resolution is maximal for areas of interest and breaking slopes (dune, cliff, sand bar,
crescentic dune, washover fan).
Figure 2: Schematic crosshore profile of the study area coupled with instruments location and typology used.
All the DEMs (figure 3b or c), profiles (figure 3h) and sand volume changes (DEMs differential; figure 3d) maps were performed using Bash script and Generic Mapping Tools (GMT, (Wessel and Smith, 1998)). We use the Akima interpolation (based on spline functions providing smoother and much more natural curvatures, (Akima, 1970)) to build the DEMs. Isobaths and reference points (points number 1, 2, 3 and L) are plotted in order to improve the reading. Isobaths Z= 0 m and 1 m above MSL are boundaries of subtidal (below 0 m of elevation), intertidal and supratidal (above 1 m of elevation) zones. Because of the lack of continuous morphological marker along the barrier (like dune-foot, dune-crest or berm), we defined a shoreline at the exact location of the isobath Z= 1 m. On the sand volume changes maps, the solid and dashed lines display respectively isobaths at the first and last dates and the blank in the legend masks the morphological changes include into the margin of error.
Analysis of the morphodynamic changes driven by the Talim typhoon is based on two surveys : June 16thand June 22th; and seasonal morphodynamic changes are based on three surveys : October 21th, 2011,
May 3th, 2012 and August 21th, 2012.
The empirical Bagnold equation (Bagnold, 1941) is used to estimate the potential aeolian sediment transport driven by strong wind of monsoon:
where q is the sand transport rate (the sand flux per unit time and per unit width, in kg/m/s), the coefficient C is 1.8, d is the grain diameter (m), D is a standard grain size diameter (0.00025 m), U∗is the shear velocity
(m/s), ρ is the air density (1.22 kg/m3) and g is the gravitational force (9.81 m/s2).
RESULTS
Hydro-morphodynamics patterns driven by Talim tropical storm
Amongst the eight typhoons recorded, Talim is the most energetic observed. The storm, generated on June 18th in the east of China sea, travelled north-eastward to cross the study area on June 19-20th. The
depression finally weakens on the Japan coasts on June 21th. We defined the storm apex at the maximum
offshore wave height on June 20thbetween 7 and 9 am. At the storm apex, significant wave height reached
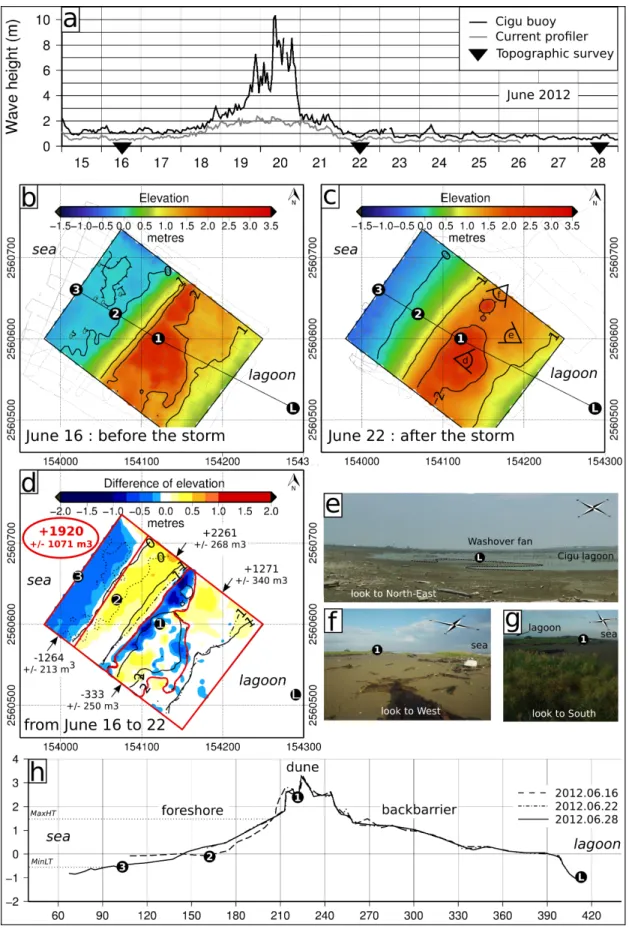
10.34 m offshore (Tp= 14.6 s) and 2.3 m (period reaches 13.4 s) in the surf zone (figure 3 a). Wave periods
measured in the surf zone are longer during the rising storm (16 s on June 19th4 pm and 15.5 s on June
20th 2 am) than the apex or falling storm. At the shore, the wave set-up remains weak and most of the
incoming energy is transferred into infragravity frequency band (Sous et al., 2013). The dune crest is not submerged on the studied transect even at the wave peak but morphological evidences of overtopping have been observed where the dune crest is lower (elevation about 2 m above MSL). At the storm apex, the wind is about 17.5 m.s−1offshore and 12 m.s−1inland (wind gusts about 20 m.s−1).
Regarding morphology, Talim tropical storm caused both expected and more unusual changes on the emerged beach. The expected changes include a 6.7 m dune-foot retreat (dune erosion about -333 m3 +/-250 m3) and 20 m long breach at the weakness point of the dune elevation (only 2.2 m above MSL). The sand transferred from the dune-breach to the back-barrier associated to wash-over deposit in the lagoon. These changes display a well-known morphodynamic responses to moderate storms but, more surprisingly, Talim drove also a significant nourishment of the upper-foreshore (+2261 m3 +/- 268 m3) as well as the
whole sand barrier (+1920 m3+/- 1071 m3) (figure 3 d). This sand input on the emerged beach results in 8
Figure 3: Hydro-morphodynamics driven by Talim tropical storm. a) Offshore and surf zone waves con-ditions during the storm. DEMs on b) June 16thand c) June 22th, used to characterize the d) morphologic
changes of the emerged beach driven by the typhoon. The black line displays the crosshore profile plotted on h). Orientation of camera pictures e, f and g) are display on map b).
Hydro-morphodynamics patterns driven the typhoons and the monsoon seasons
During fair-weather periods separating each typhoon of the summer season, offshore wave conditions remain calm, with Hs < 1 m and Tp < 5 s. During typhoons, waves ranges from 1 < Hs ≤ 10 m with
5 < Tp ≤ 14 s offshore. Strong wave dissipation and spectral energy transfers occurs over an expectedly
very wide surf zone, as indicated by the smaller wave height range 1 < Hs ≤ 2.3 m measured by the
profiler. During winter, regular moderate storms induced by Asia wind of monsoon reaches occasionally 3 m of significant offshore waves. The period remains below 7 s (6.4 s in average). The constant North wind velocity is about 7.6 m/s in average resulting in a significant aeolian sand transport on the emerged beach. Order of magnitude of the potential sand transport computed with classic Bagnold equation is about 0.23 m3/h along the season.
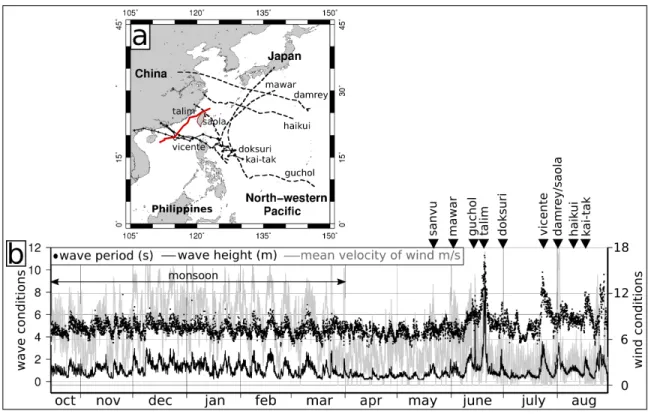
Figure 4: Wind and wave conditions along the year 2011/2012. a) Tracks of typhoons monitored. b) Offshore wind and waves along the monsoon and typhoons seasons. Wind from June 21thto August were
extracted from the inland weather station (figure 1 c and 2).
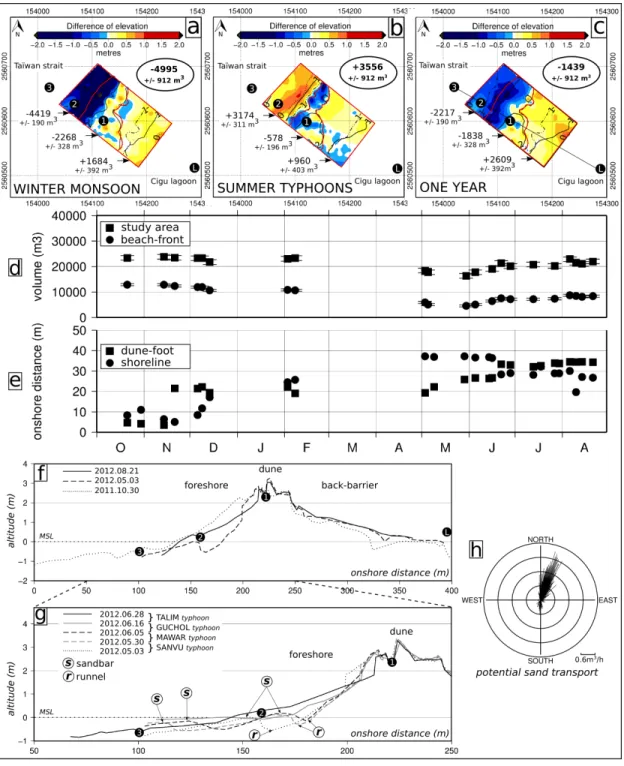
Surprisingly, the summer results in an accretion period with a sand input about+3556 m3+/- 912 m3
mainly transferred to the foreshore inducing a 10.44 m shoreline seaward shift (figure 5 b,f). The sand balance evidences a sand transport probably from the surf zone and/or the shoreface. Along the season, energetic conditions during moderate typhoons (offshore significant wave below 3 m) drove the sandbars to aggrade upward from the subtidal to the supratidal zone (figure 5g). Extreme energetic event (offshore significant wave above 5 m) like Guchol (from 5thto 16thJune) or Talim induces the sandbars destruction
and the sand-stock redistribution over the foreshore (see the landward migration of sandbars from May 3th
to the Talim event on the figure 5).
The dune is eroded (-578 m3+/- 196 m3) and retreats landward (15.06 m). The back-barrier nourish-ment (+960 m3+/- 403 m3) is allocated to the cross-shore processes because heavy rain prevents aeolian sand transport during typhoon events.
Conversely, winter are erosive season with negative sand balance about -4995 m3+/- 912 m3(figure 5 a,f). The regular collision regime (Sallenger, 2000) driven by moderate storms induces foreshore erosion about -4419 m3+/- 912 m3resulting in 28.9 m of shoreline retreat, dune scarp (erosion about -2268 m3
(figure 5 h) but no significant surge process of the dune occurs during this season.
Over the year, the sand barrier recorded 18.5 m of landward shift coupled with dune erosion (-1838 m3 +/- 328 m3) and dune-foot landward retreat (29.6 m) without crest abrasion (figure 5 c,f). The back-barrier
nourishment (+2609 m3+/- 392 m3) is a mix between aeolian sand input during North wind of winter and sand transport from beach-front during typhoons. The negative sand balance about -1439 m3 +/- 912 m3 suggests a sand transfer outside the study area.
Figure 5: Morphodynamic patterns driven by the monsoon and typhoons seasons. DEMs on October 30th
2011, May 3thand August 21th2012 are used to build sand volume changes maps of the a) monsoon and b)
typhoons seasons as well as c) the whole year. Solid and dashed lines display respectively isobaths at the youngest and oldest dates and the sand balances correspond to the respective red frames. The straight black line displays the crosshore profile plotted on f and g). The sand volume changes of the study area/beach-front and location changes of the shoreline/dune-foot along the year are plotted respectively on graphs d) and e). h) Rose of the potential aeolian sand transport during the monsoon season
DISCUSSION
TALIM tropical storm drives a foreshore nourishment
Only few researches have demonstrated a subaerial beach accretion after an extreme storm passage. Tapia et al. (2014) present in the ICCE conference 2014 (The 34th International Conference on Coastal
Engineering) a subaerial beach accretion in Puerto Morelos (Mexico) after the Wilma hurricane in October 2005. Roberts et al. (2013) also measured 0.7 m of thick layer of sand on the berm crest prograding the beach seaward driven by the hurricane Bill in 2009, Florida. Stone et al. (2004) also showed that barrier islands can conserve mass during catastrophic cyclones, and that less severe cyclones and tropical storms can promote rapid dune aggradation and can distribute sediment to the entire barrier system.
In our case, we measure an unexpected nourishment of the whole emerged beach during Talim tropi-cal storm which is more classitropi-cally observed in the literature under beach recovery process conducted by fairweather conditions (Komar, 1998; Larson and Kraus, 1994; Ruggiero et al., 2005) or inter-hurricanes periods (Roberts et al., 2013). Because the beach-front appears mainly controlled by cross-shore processes during summer, the emerged beach nourishment probably results from a landward shift of sand coming from the shoreface.
The beach recovery during typhoon season is related to the landward migration of the intertidal sandbars.
Quite surprisingly, the sand balance displays an accretive period of beach-front recovery and shoreline seaward shift during summer. The sand input appears occurring through a landward migration and up-ward aggrading sandbars in the intertidal zone that served as the sediment path-way for the emerged beach reconstruction driven by energetic conditions during typhoons.
Similar observations of intertidal sandbar destruction during storm were reported by Aagaard et al. (1998). Masselink et al. (2011) suggest that the intertidal sandbar represents a small-scale version of a transgressive barrier system occurring through the four regimes described by Sallenger (2000) for the be-haviour of barrier islands during hurricanes (swash, collision, overwash and inundation). In our case, we observed a landward migration of the intertidal sandbar driven by energetic, but non-destructive typhoons (offshore significant wave below 3 m), until destruction and sand redistribution over the foreshore driven by paroxysmal events (offshore significant wave above 5 m) like Guchol or Talim. In addition to the hy-drodynamic conditions, the feedback with morphology can play a significant role in the sandbar dynamics. Current meter records obtained by Masselink et al. (2011) suggested that the onshore migration of an inter-tidal bar was driven by onshore-directed near-bed mean currents which persisted for as long as a runnel was present landward of the bar. When this runnel infilled, the mean current across the bar changed direction, becoming an offshore-directed bed return flow that destroyed the bar. This behaviour corresponds to our measures. The sandbars migrate landward until the runnel filling during Guchol event and the complete destruction during Talim event flattening the beach profile. But, the sandbar volume cannot explains the entire positive sand balance, that suggests a concomitant sand supply from the shoreface. Indeed, during paroxysmal events, the positive sand balance results from a mix between the sand redistribution from the intertidal sandbars and a direct shift of sand from the shoreface.
The major role of the monsoon season in the beach-front erosion process
The major agent of beach-front erosion are the moderate storms series during the monsoon season. Roberts et al. (2010) under hurricanes climate, and many others under moderate storms (Short, 1999), assigned a major role to the inter-storm periods in the reconstruction process of the emerged beach. Working on model along the Portuguese west coasts, Ferreira (2005) proved that storm groups with relatively small return periods induce average erosion volumes as significant as a single storm with a much longer return period. In this study, 20 moderate storms above 2 m of offshore significant wave height (i.e. an average of 3.3 storms per month) completely inhibit the inter-storms reconstruction process which induces an overall beach-front erosion. Because the alongshore drift is present during the monsoon, a part of the sand taken from the beach-front is probably lost in the drift when the major part should be deposited seaward across the shoreface.
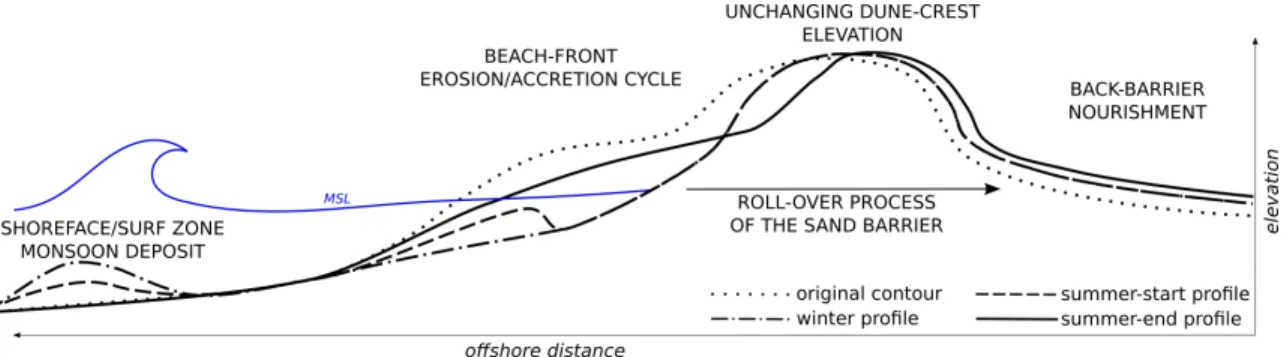
One conceptual model to display the yearly beach behaviour
Yearly, the volume of sand transported in the shoreface during monsoon will be in average returned to the emerged beach driven by energetic conditions of typhoons. Consequently, the major importance of typhoons on the roll-over processes is to transport the sand landward to the foreshore and the back-barrier through dune surge processes (overwash and inundation regimes). Indeed, we propose a conceptual model to display the sand barrier morphodynamics driven by monsoon and typhoons conditions along one year (figure 6).
Figure 6: Conceptual model of the sand patterns along one year and successive monsoon and typhoons seasons.
Decadal tendency
However, the 18 m of sand barrier landward shift measured in 2011/2012 is lesser than expected when studying the decadal shoreline changes along the Wan-Tzu-Liao sand barrier (Campmas et al., 2014). The shoreline changes measured in this study are about 25 m/yr from 1999 to 2004 and 48 m/yr from 2004 to 2009. Likewise, the small loss of sand in 2011/12 (-1439 m3+/- 912 m3) compared to the rapid decrease of the sand barrier area observed since 2004 (Campmas et al., 2014) tends to categorize the 2011/2012 studied period as a rather rare year with an unusual frequency of events like Talim driven accretive morphologic patterns.
If typhoons with accretive morphologic patterns are the major agent of reducing shoreline retreat, the occurrence of events like Talim can play a major role in the long-term barrier dynamics and seems to be variable from one year to another resulting an irregular historic shoreline changes.
CONCLUSION
This study focuses on the Wan-tzu-liao sand barrier morphodynamics at different time scales ranging from the typhoon event to entire typhoons and monsoon seasons. The three main objectives were, (i), to provide detailed description and quantification of hydro-morphodynamic changes under a single typhoon and a typhoons/monsoon seasons, (ii), to better understand relationships between extreme forcings and sand barrier dynamics and, (iii), to discuss these in light of existing conceptual models mainly developed from moderate storms data.
Seven months of field work provided a robust dataset of hydrodynamics conditions from offshore to the swash zone coupled with a high frequency surveys of the emerged beach. Based on this dataset, we ob-served an accretive morphological pattern of typhoon (Talim tropical storm) and typhoons season (2012). Inversely during monsoon, the increased storm occurrence frequency inhibits the reconstruction beach pro-cess resulting in beach-front erosion. A new conceptual model of sand barrier yearly morphodynamics is proposed. It combines a seaward transfer of sand taken from the beach-front during monsoon and a landward return of sand in the foreshore and the back-barrier during summer. However, compared to the decadal analysis of the sand barrier landward migration showed by Campmas et al. (2014) study, the shore-line changes measured in 2011/12 should be considered as a rather rare year with an unusual occurrence of Talim storm-like events with beach-front recovery pattern.
ACKNOWLEDGEMENTS
This work was funded by the KUN-SHEN-ANR project between French and Taïwanese laboratories (SIMI6-2011) and the GLADYS (www.gladys-littoral.org)/ SO LTC (www.soltc.org) research groups. We are grateful to the Taïwanese field team of Tainan Hydraulics Laboratory for their contribution to the field work.
References
Aagaard, T., Nielsen, J., and Greenwood, B. (1998). Suspended sediment transport and nearshore bar formation on a shallow intermediate-state beach. Marine Geology, 148(3-4):203 – 225.
Akima (1970). Interpolation and smooth curve fitting based on local procedures. Communications of the ACM (AssociationforComputingMachinery), 15:914–918.
Bagnold, R. (1941). The physics of blown sand and desert dunes. london: Methuen. page 265.
Campmas, L., Sabatier, F., Meulé, S., Liou, J. l., Petitjean, L., Boudin, F., Leroux-mallouf, R., Sous, D., and Bouchette, F. (2014). Multi-scale morphodynamics of sand barrier driven by monsoon/typhoon conditions. Paralia, 7:273–280. MIO:14-021 MIO:14-021.
Chang, Y.-C., Chu, P. C., Centurioni, L. R., and Tseng, R.-S. (2014). Observed near-surface currents under four super typhoons. Journal of Marine Systems.
Chang, Y.-C., Tseng, R.-S., and Centurioni, L. (2010). Typhoon-induced strong surface flows in the taiwan strait and pacific. Journal of Oceanography, 66(2):175–182.
Chen, W.-J. and Kuo, C.-T. (2008). Study on the evolution of sand barriers in taiwan coast. In River, Coastal and Estuarine Morphodynamics: RCEM 2007, Two Volume Set, pages 85–91–. Taylor & Francis. Coco, G., Senechal, N., Rejas, A., Bryan, K., Capo, S., Parisot, J., Brown, J., and MacMahan, J. (2014).
Beach response to a sequence of extreme storms. Geomorphology, 204:493 – 501.
Dean, R. and Walton, T. (2006). HANDBOOK OF COASTAL AND OCEAN ENGINEERING , Chapter1 Wave Setup. World Scientific, Co. Pte. Ltd.
Donnelly, J. P., Butler, J., Roll, S., Wengren, M., and III, T. W. (2004). A backbarrier overwash record of intense storms from brigantine, new jersey. Marine Geology, 210(1-4):107–121.
Dronkers, J. (2005). Dynamics of coastal systems. World Scientific.
Ferreira, (2005). Storm groups versus extreme single storms: Predicted erosion and management conse-quences. Journal of Coastal Research, pages pp. 221–227.
Ge, X., Li, T., Zhang, S., and Peng, M. (2010). What causes the extremely heavy rainfall in taiwan during typhoon morakot (2009) ? Atmospheric science letters, pages 46–50.
Houser, C., Hapke, C., and Hamilton, S. (2008). Controls on coastal dune morphology, shoreline erosion and barrier island response to extreme storms. Geomorphology, 100(3–4):223–240.
Jan, S., Wang, J., Chern, C.-S., and Chao, S.-Y. (2002). Seasonal variation of the circulation in the taiwan strait. Journal of Marine Systems, 35(3-4):249–268.
Komar, P. (1998). Beach Processes and Sedimentation. Prentice-Hall, London, UK.
Lallemand, S., Theunissen, T., Schnurle, P., Lee, C.-S., Liu, C.-S., and Font, Y. (2013). Indentation of the philippine sea plate by the eurasia plate in taiwan: Details from recent marine seismological experiments. Tectonophysics, 594:60–79.
Larson, M. and Kraus, N. C. (1994). Temporal and spatial scales of beach profile change, duck, north carolina. Marine Geology, 117(1–4):75 – 94.
Liao, H.-R., Yu, H.-S., and Su, C.-C. (2008). Morphology and sedimentation of sand bodies in the tidal shelf sea of eastern taiwan strait. Marine Geology, 248(3-4):161–178.
Lin, J.-W. (2013). An empirical correlation between the occurrence of earthquakes and typhoons in taiwan: a statistical multivariate approach. Natural Hazards, 65(1):605–634.
Lin, S., Tang, T., Jan, S., and Chen, C.-J. (2005). Taiwan strait current in winter. Continental Shelf Research, 25(9):1023 – 1042.
Liu, P., Chen, H., Doong, D., Kao, C., and Hsu, Y. (2008). Monstruous ocean waves during typhoon krosa. Annales Geophysicae, 26:1327–1329.
Masselink, G., Aagaard, T., and Kroon, A. (2011). Destruction of intertidal bar morphology during a summer storm surge event: Example of positive morphodynamic feedback. Journal of Coastal Research, 64:105–109.
Masselink, G. and Heteren, S. (2013). Response of wave-dominated and mixed-energy barriers to storms. Marine Geology.
Morton, R., Gibeaut, J., and Paine, J. (1995). Meso-scale tranfert of sand during and after storms : impli-cations for prediction of shoreline movement. Marine geology, 126:161–179.
Ou, S.-H., Liau, J.-M., Hsu, T.-W., and Tzang, S.-Y. (2002). Simulating typhoon waves by {SWAN} wave model in coastal waters of taiwan. Ocean Engineering, 29(8):947 – 971.
Plant, N. and Stockdon, H. (2012). Probabilistic prediction of barrier-island response to hurricanes. Journal of Geophysical Research, 117.
Qi, H., Cai, F., Lei, G., Cao, H., and Shi, F. (2010). The response of three main beach types to tropical storms in south china. Marine Geology, 275(1-4):244–254.
Roberts, T. M., Wang, P., and Kraus, N. C. (2010). Limits of wave runup and corresponding beach-profile change from large-scale laboratory data. Journal of Coastal Research, 26(1):pp. 184–198.
Roberts, T. M., Wang, P., and Puleo, J. A. (2013). Storm-driven cyclic beach morphodynamics of a mixed sand and gravel beach along the mid-atlantic coast, usa. Marine Geology, 346:403–421.
Ruggiero, P., Kaminsky, G., Gelfenbaum, G., and Voigt, B. (2005). Seasonal to interannual morphodynam-ics along a high-energy dissipative littoral cell. Journal of Coastal Research, 21(3):553–578.
Sallenger, A. (2000). Storm impact scale for barrier islands. J. Coast.Res, 16 (3):890–895. Short, A. (1999). handbook of beach and shoreface morpholodynamics. John wiley & sons, LTD.
Sous, D., Campmas, L., Meulé, S., Bouchette, F., and Liou, J-Y, R. V. T. J. (2013). Wave setup and wa-tertable overheight in the cigu sand barrier (taiwan) during the talim tropical storm. In Coastal Dynamics 2013, Arcachon, France, pages 1517–1526.
Stockdon, H., Sallenger, J., Asbury, H., Holman, R., and Howd, P. (2007). A simple model for the spatially-variable coastal response to hurricanes. Marine Geology, 238:1–20.
Stone, G., Grymes, J., Steyer, K., Underwood, S., Robbins, K., and Muller, R. (1993). A chronologic overview of climatological and hydrological aspects associated with hurricane andrew and its morpho-logical effects along the louisiana coast, usa. Shore and Beach, 61 (2):2–12.
Stone, G. W., Liu, B., Pepper, D. A., and Wang, P. (2004). The importance of extratropical and tropical cyclones on the short-term evolution of barrier islands along the northern gulf of mexico, usa. Marine Geology, 210(1-4):63–78.
Suppe, J. (1984). Kinematics of arc-continent collision, flipping of subduction, and back-arc spreading near taiwan. Memoir of the geological society of China, 6:21–33.
Tapia, M., Casarin, S., Ortiz, E., Balwin, M., Mancera, E., and Rentaria, F. (2014). Comparative morphody-namics and circulation patterns between a beach exposed to hurricane conditions and a beach protected by coral reefs. In 34th International Conference on Coastal Engineering, June 15-20, Seoul, Korea. Wessel, P. and Smith, W. H. F. (1998). New, improved version of generic mapping tools released. Eos,
Transactions American Geophysical Union, 79(47):579–579.
Wu, C. and Hsin, Y. (2005). Volume transport through the taiwan strait: a numerical study,. Terrestrial, Atmospheric and Oceanic Sciences, 16 (2):377–391.
Zhang, W., Hong, H., and Yan, X. (2013). Typhoons enhancing northward transport through the taiwan strait. Continental Shelf Research, 56.