HAL Id: halshs-00849075
https://halshs.archives-ouvertes.fr/halshs-00849075
Preprint submitted on 30 Jul 2013
HAL is a multi-disciplinary open access archive for the deposit and dissemination of sci-entific research documents, whether they are pub-lished or not. The documents may come from teaching and research institutions in France or abroad, or from public or private research centers.
L’archive ouverte pluridisciplinaire HAL, est destinée au dépôt et à la diffusion de documents scientifiques de niveau recherche, publiés ou non, émanant des établissements d’enseignement et de recherche français ou étrangers, des laboratoires publics ou privés.
Evaluating the law of one price using micro panel data
Laurent Gobillon, François Charles Wolff, Patrice Guillotreau
To cite this version:
Laurent Gobillon, François Charles Wolff, Patrice Guillotreau. Evaluating the law of one price using micro panel data. 2013. �halshs-00849075�
WORKING PAPER N° 2013 – 27
Evaluating the law of one price using micro panel data
Laurent Gobillon François-Charles Wolff
Patrice Guillotreau
JEL Codes: L11, Q22, R32
Keywords: Fish, Commodity price, Local markets, Panel data
PARIS
-
JOURDAN SCIENCES ECONOMIQUES 48, BD JOURDAN – E.N.S. – 75014 PARISTÉL. : 33(0) 1 43 13 63 00 – FAX : 33 (0) 1 43 13 63 10
www.pse.ens.fr
CENTRE NATIONAL DE LA RECHERCHE SCIENTIFIQUE – ECOLE DES HAUTES ETUDES EN SCIENCES SOCIALES
Evaluating the law of one price
using micro panel data
1
Laurent Gobillon
*, François-Charles Wolff
**, Patrice Guillotreau
***July 2013
Abstract
This paper investigates spatial variations in product prices using an exhaustive micro dataset on fish transactions. The data record all transactions between vessels and wholesalers that occur on local fish markets in France during the year 2007. Spatial disparities in fish prices are sizable, even after fish quality, time, seller and buyer unobserved heterogeneity have been taken into account. The price difference between local fish markets can be explained to some extent by distance, but mostly by a coast effect (analogous to a border effect in the literature on the law of one price) related to separate location on the Atlantic and Mediterranean coasts. In particular, fish and crustacean prices are 34% higher on the Mediterranean coast. The law of one price is verified for almost all species when considering only local fish markets on the Atlantic coast.
Keywords: fish, commodity price, local markets, panel data JEL Classification: L11, Q22, R32
1
We thank conference and seminar participants for their useful comments and suggestions. We are also grateful to Jérémie Turpin and Christine Lamberts (CNRS-LETG-Nantes-UMR 6554) for constructing the map representing fish markets in France.
* Corresponding author. INED, 133 Boulevard Davout, 75980 Paris Cedex 20, France, PSE, CEPR and IZA.
E-mail: [email protected] http://laurent.gobillon.free.fr/
** LEMNA, Université de Nantes, BP 52231, Chemin de la Censive du Tertre, 44322 Nantes Cedex, France and
INED, Paris, France. E-mail: [email protected] http://www.sc-eco.univ-nantes.fr/~fcwolff
*** LEMNA and FR CNRS 3473-IUML, Université de Nantes, BP 52231, Chemin de la Censive du Tertre,
1
1. Introduction
A long-standing question in economics is the validity of the law of one price (LOP) which states that in an efficient market, all identical goods must have a unique price. This law has been investigated by studies assessing whether prices in several cities or countries converge to a common value using co-integration techniques (Asche et al., 1996; Parsley and Wei, 1996; Goldberg and Verboven, 2005; Fan and Wei, 2006). It has also been evaluated by articles assessing whether prices significantly differ for distant areas or when crossing an international border. The analysis has been carried out using either aggregate price indexes (Engel and Rogers, 1996) or, more recently, micro data on prices for identical products identified by their barcode (Broda and Weinstein, 2008).
In this paper, we investigate the validity of the law of one price over space for transactions in a microeconomic perspective using panel data techniques. In contrast to the existing literature, we are able to control for spatial differences in buyers' preferences and in the production costs which may influence spatial differences in prices by modelling the unobserved heterogeneity of agents.
We focus on the French fish market for which we have an original exhaustive dataset of first-hand transactions. We assess whether significant spatial variations in fish prices can still be observed once the effects of observable fish characteristics and unobserved heterogeneity among agents have been netted out. As we compare the level of local prices, we are interested in testing the “absolute” LOP.2 We also examine whether the net difference in prices between two fish markets is linked to distance and a coast effect (analogous to a border effect) related to separate location on the Atlantic and Mediterranean coasts.
An originality of our work is that fish market prices can be considered as production prices, while other papers have focused rather on consumption prices for commodities sold in shops or supermarkets. Contrary to other studies, we are thus able to avoid the influence of marketing costs on prices – costs that are usually quite high and vary over space (Handbury and Weinstein, 2011).
Interestingly, there is no inventory in fish markets and prices are set daily depending on the catches of the day. This limits issues related to inter-temporal decisions of buyers who may purchase large quantities infrequently to avoid shipping costs (Miljkovic 1999, Chiang et al., 2001). Moreover, fish markets are spot markets and most buyers on a local market have information on all products sold locally, but also potentially on other markets through Internet
2 This is in contrast with papers comparing the evolution of local prices which rather test the “relative” LOP. See
2
protocols (remote bidding) or simply by phone with distant representatives. But buyers still have to choose a fish market on the territory where they buy fish and incur transportation costs in case of a purchase. Because of these spatial frictions, the LOP is not guaranteed. In our estimations, we use exhaustive data on the whole national territory in contrast with other studies which consider unique locations. In particular, early studies on fish prices mostly used data collected in specific fish markets such as the Marseilles wholesale fish market in France (Härdle and Kirman, 1995; Vignes and Etienne, 2011), the Fulton fish Market in the USA (Graddy, 1995) or the Ancona fish market in Italy (Gallegati et al., 2011).
Our work builds on recent advances in economic geography that focus on spatial wage disparities and estimate wage equations including both local fixed effects and individual fixed effects to take worker heterogeneity into account (Combes et al., 2008). This paper itself draws inspiration from the labor economics literature in which wage equations with both firm and worker fixed effects are estimated (Abowd et al., 1999). In the present article, we estimate some fish price equations that include three series of fixed effects related, respectively, to local markets, sellers and buyers.
The model is estimated on a sample of one million transactions for seven fish and crustacean species in 2007. We first present some results for one species –monkfish – the species with the largest market share in our dataset, and then compare these results with those obtained for the six other species that differ from or are substitutes to monkfish.
For our preferred specification for monkfish, we find that space matters, as local market effects explain around 14% of price variations. This result suggests that there is not a unique price on the fish market. In comparison, variables characterizing fish observable heterogeneity explain as much as 40% of price variations, while unobserved heterogeneity among vessels and buyers explain only a small share (6% and 3.5%, respectively). In particular, the heterogeneity among vessels captures the unobserved differences in fish quality related to differences in fishing techniques. As this heterogeneity only plays a minor role, it suggests that fish products are quite homogenously defined by their observable characteristics (size, presentation, quality grade) in our dataset.
When replicating our approach for some other species, we find that results vary greatly across species. In particular, for hake, local market effects explain 41% of price variations. For squid, the corresponding figure is 27.5%, whereas fish explanatory characteristics explain only 4.3% of price variations. Overall, this suggests that results for a given product cannot be generalized to others, and products should always be considered separately in the analysis of prices.
3
We also regress the absolute price difference net of composition effects between two local fish markets on the logarithm of distance, a dummy capturing the location on the two different coasts, as well as species dummies. Whereas distance only has a small effect, the coast effect is important. In fact, prices are 34% higher on the Mediterranean coast than on the Atlantic coast. The market segmentation between the two coasts can be explained by the prohibitive costs for boats of moving from one coast to the other, which can be done only by going around Spain and through the Straits of Gibraltar. Results by species show that prices are much higher on the Mediterranean coast for five out of our seven selected species.
We also define groups of local fish markets such that, within each group, fish markets are well interconnected by mobile buyers and sellers. We consider that a group is well interconnected if, when restricting the estimation to transactions occurring within their group, three series of fixed effects (buyers, sellers and local markets) introduced in the price equation are all identified. We show that, for every species, there is a main group that includes most local fish markets on the Atlantic coast. For this group, the law of one price is verified for every species except hake and squid, for which it is close to being verified. Overall, this suggests that fish markets on the Atlantic coast are integrated.
The rest of the paper is organized as follows. Section 2 presents our dataset along with some descriptive statistics on our sample. Section 3 explains our econometric approach and Section 4 comments the results. Finally, Section 5 concludes.
2. Data and descriptive statistics
We assess the validity of the law of one price using transaction data from fish markets which are organized as follows. After landing, fish is weighed, sorted by presentation (whole, gutted, cut into pieces), size and quality, either by the crew itself onboard or by the harbor staff, and rated by decreasing order of quality. As emphasized by Kirman (2001, p. 157), the trading organization “varies from location to location, for little obvious reason”. Most of the fish is auctioned in trading rooms to which the fish is transported, or around the fish boxes in the fish hall with a mobile electronic auction clock mounted on a battery-powered vehicle.3 Only buyers and the auctioneer are present in the trading room – the fishermen return to sea or go home.
In 2007, the year considered in our empirical analysis, 238,194 tons of fish valued at 705.5 million euros were landed and traded in 40 local fish markets scattered along the French
3 For a full description of the electronic auction systems on fish markets in France, see for instance Guillotreau
4
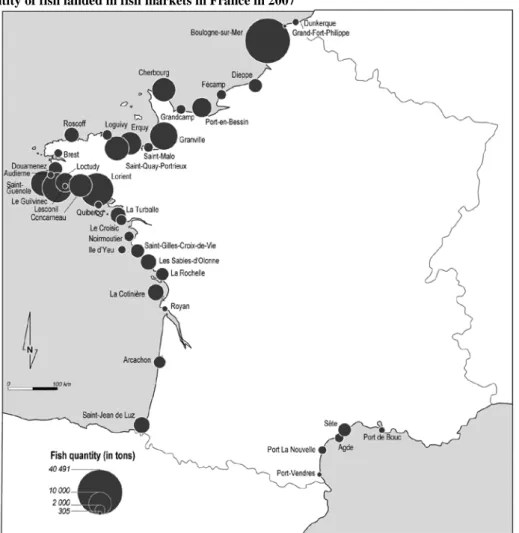
coastline.4 Figure 1 shows that most local fish markets are located along the Atlantic coast (including the Channel), and only a few of them along the Mediterranean. The three largest markets (Boulogne-sur-Mer along the Channel, Le Guilvinec and Lorient in Brittany) account for around one-third of total sales value. In fact, most of the large fish markets are located on the north-west coast. By contrast, all the fish markets along the Mediterranean are small. Our study of fish prices relies on a unique exhaustive dataset of transactions on the French fish market during the year 2007. In France, fish price data on every transaction are collected daily by the national bureau of seafood products (France Agrimer) from all fish markets and processed in a data system called RIC (Réseau Inter-Criées). The dataset comprises only a few variables, but they provide an accurate description of each transaction.
The data include information on the fish market where every transaction takes place, as well as on the vessel and the buyer involved in the transaction. There are three distinct identifiers associated, respectively, with the local fish market, the vessel and the buyer. For the latter, the dataset includes the buyer’s license code, which is a market-specific account identifier. A buyer can have several accounts on one or more fish markets. To identify the buyers associated with the accounts, we rely on a complementary survey conducted in 2008 by France Agrimer which contains information on the official firm identifier for each account.5 When matching this information with our dataset, we are able to identify the buyers for 85.3% of the accounts.
Some information is also given for every transaction. We know the total price paid by the buyer along with the purchased quantity, from which we deduce the price per kilo. The dataset includes the month of the transaction but not the exact day, so the daily local fish supply cannot be considered in our analysis. We also know the type of trading system used for the transaction (auction or direct sales). Some additional details are given on the characteristics of fish exchanged during the transaction, such as the fish species, size, presentation (whole, gutted, in pieces, etc.) and quality (ranging from “extra” –the best quality– to low).
The dataset includes 3,194,659 transactions when considering all species and all local fish markets. We restrict our sample as follows. Firstly, we only consider transactions corresponding to direct auctions between vessels and buyers on local fish markets. This
4 See http://www.criees-france.com/index.php?id_site=1&id_page=47 for further details. To the reported amount
should be added extra fish directly exported to foreign countries or sold through domestic contracts (which represent more than 20% of sales).
5 This is a nine-figure identifier attributed to each legal unit called the SIREN number. Each buyer is
characterized by a unique SIREN number. The aim of the survey by France Agrimer was to match the SIREN numbers with the accounts registered on the fish markets.
5
eliminates 230,725 observations corresponding to direct sales to processors whose price is bargained very differently across time and space. Secondly, we remove 14,970 observations because the account identifier is missing. Thirdly, we focus on species characterized by a large number of transactions to avoid fish and crustaceans whose trade is limited to specific seasons or occurs only on a few local niche markets. More precisely, we restrict our analysis to the seven following species: monkfish (Lophius piscatorius), sole (Solea vulgaris), langoustine (Nephrops norvegicus), sea bass (Dicentrarchus labrax), hake (Merluccius
merluccius), John Dory (Zeus faber), and squid (Loligo vulgaris). 6 These selected species are involved in 1,009,788 transactions and represent about one-half of the total sales value.7 On average, our selected species represent high-valued products.
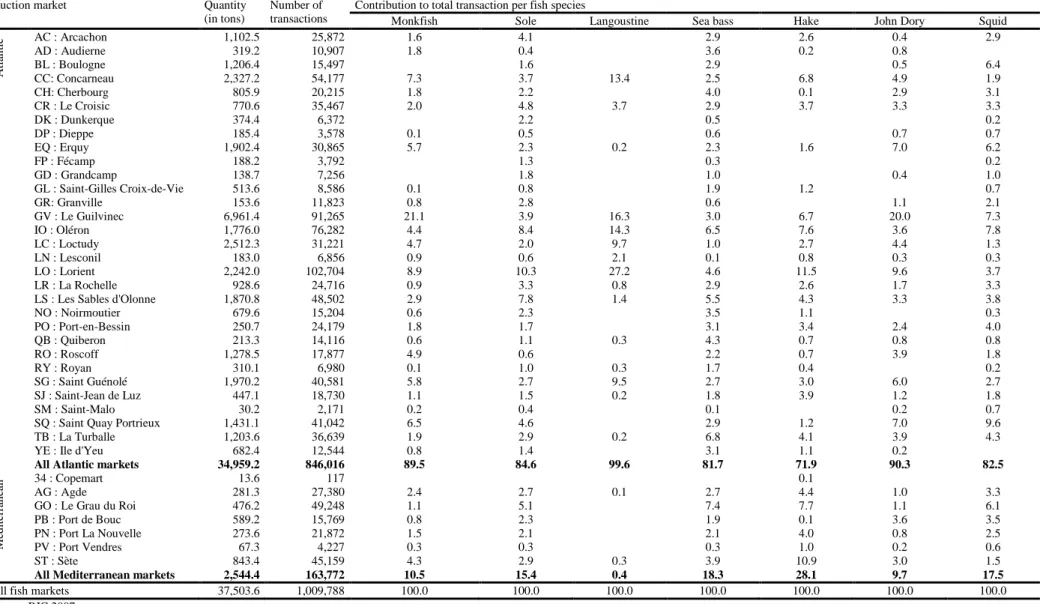
We now present some descriptive statistics on fish prices, fish characteristics and local markets for the seven selected species. The average fish price per kilo varies considerably across species, as shown in column 2 of Table 1. It is highest for sole (14 euros per kilo), and it ranges between 10 and 12 euros per kilo for John Dory, langoustine and sea bass. The lowest values are found for hake and monkfish (between 5 and 6 euros per kilo). Differences in average price between species reflect consumer tastes. Fish species like sea bass, John Dory and sole are considered to be high-quality products and they are bought by high-quality restaurants or consumers with high purchasing power.
[ Insert Table 1 here ]
For a given species, column 3 further indicates that the variation in transaction prices can be quite large. This variation is expected to be strongly related to differences in size, quality and presentation. The coefficient of variation is highest for hake and squid, with a value around .5. It is lowest for sole and John Dory, with a value around .35.
As shown in column 4, fish species are all traded on more than 30 local markets (with a maximum of 37 markets for sole and sea bass), except for langoustine. This crustacean is only found in 17 local markets because only a limited number of trawlers, located mostly near Lorient, Le Guilvinec, Oleron and Concarneau, target langoustine under a specific license. By contrast, monkfish is caught all along the Atlantic and Mediterranean coasts by trawlers,
6
For the seven selected species, we exclude the transactions with missing information on size, presentation or quality (3,533 observations deleted). We further drop the .1% upper and lower values of the price distribution (2,002 observations deleted) and exclude, species by species, local fish markets with fewer than 100 transactions in 2007 (696 observations deleted). The number of local fish markets thus varies across species in our empirical analysis.
7 Markets values are, in decreasing order, 69.1 million euro (M€) for monkfish (144,436 transactions), 68.6 M€
for sole (245,987 transactions), 44.8 M€ for langoustine (91,888 transactions), 46.4 M€ for sea bass (182,885 transactions), 20.4 M€ for hake (196,950 transactions), 14.1 M€ for John Dory (54,113 transactions), and 29.2 M€ for squid (93,529 transactions).
6
dredgers and gillnetters targeting other species as well. As shown in Appendix Table A1, only .4% of transactions occur on the Mediterranean coast for langoustine, compared to 10.5% for monkfish. The proportion of transactions on that coast is the highest for hake, at 28.1%. The average price varies considerably across local markets (column 5). The ratio between maximum and minimum local prices is highest for monkfish, with a value around three as shown in columns 6 and 7 (prices ranging from 4.3 to 13.4 euros). This ratio is the lowest for sole and hake (less than 2).
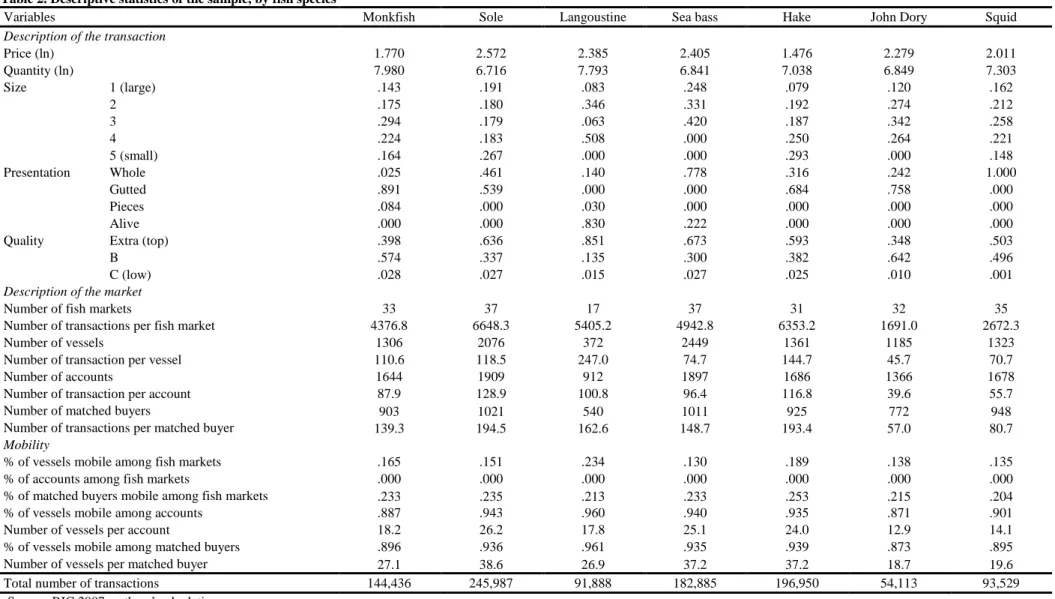
Table 2 gives some descriptive statistics on fish characteristics whose coding varies across species. For instance, there are five size categories for monkfish, but only three for sea bass. Concerning the presentation, all squid are traded as whole and langoustine are mostly sold alive (in 83% of transactions). Most monkfish transactions involve gutted fish, but monkfish is also sold as a whole or in pieces. Substantial differences in quality are observed across species. Most langoustine and, to a lesser extent, sea bass and sole, are characterized by the highest quality grade (Extra grade), while most monkfish and John Dory are of medium quality (B-grade). By definition, variations in any fish characteristic may potentially explain the variation in fish prices as long as the dispersion of fish across categories is large enough.
[ Insert Table 2 here ]
Table 2 further describes market conditions on local fish markets. The yearly average number of transactions per local market ranges from 1,691 for the scarce John Dory to 6,648 for the more common sole. There is substantial variation in the number of landing vessels, with more than 2,400 vessels for sea bass, but fewer than 400 vessels for langoustine.
There are also differences in the numbers of accounts and matched buyers (i.e. the buyers that we are able to match to at least one account). However, these differences are smaller than for vessels. The average numbers of accounts and matched buyers are lowest for langoustine (912 accounts and 538 matched buyers), this product being sold in only a few fish markets. The figures are larger for sole and sea bass with 1,900 accounts and 1,000 matched buyers per local market. The average number of transactions per buyer (ranging from 57 for John Dory to 195 for sole) is much higher than the number of transactions per account (respectively 40 for John Dory and 129 for sole).
Overall, our descriptive statistics suggest that there are large variations in fish prices across local fish markets and that many factors may influence price setting on these markets. We now propose an econometric approach to assess whether fish prices are mostly affected by fish characteristics, location of transactions, or unobserved heterogeneity among buyers and sellers.
7
3. Empirical strategy
3.1. Estimating local price indices
For each fish species, we want to explain the log of the price per kilo, or unit price, of a fish quantity purchased by a buyer 𝑗 and sold by a vessel 𝑘 during a transaction 𝑖 in a local fish market 𝑐 occurring at month 𝑡. In that setting, the unit price of a transaction 𝑖 could be expressed as 𝑃𝑖𝑗𝑘𝑐𝑡 to refer to the different dimensions. However, the buyer, vessel, local fish market and date can all be indexed by the transaction, so instead we use the notation 𝑃𝑖 for the log of unit price.
We first try to explain prices with a set of observable fish characteristics 𝑋𝑖, time fixed effects 𝜗𝑡, and fixed effects 𝜓𝑐 corresponding to the local fish markets where transactions take place.
This specification allows to test for spatial variations in prices when holding constant the fish characteristics and fishing period. We consider that the absolute law of one price is verified if the dispersion of local market fixed effects is very small. We define a dispersion indicator as the ratio between the standard error of local market fixed effects (weighted by the number of transactions) and the average log-price. This indicator is much like a coefficient of variation. We consider that the law of one price is verified if our indicator takes a value lower than .05, which is usually considered to be a very small value for a coefficient of variation. Observable fish characteristics include size, presentation (whole, gutted, in pieces, frozen, etc.) and quality (freshness). These characteristics are expected to be strongly correlated with prices. We first consider the following specification for fish prices:
𝑃𝑖 = 𝑋𝑖𝛽 + 𝜓𝑐(𝑖)+ 𝜗𝑡(𝑖)+ 𝜀𝑖 (1)
where 𝑐(𝑖) is the local fish market where transaction 𝑖 takes place and 𝑡(𝑖) is the month in which the transaction occurs. This simple specification is estimated by Ordinary Least Squares, and local fish market dummies and time dummies are introduced to recover, respectively, the local market fixed effects and time fixed effects.
A limit of this approach is that it does not take into account the heterogeneity among buyers and sellers and this heterogeneity is captured by the error term. Estimation results are biased if there is a correlation between explanatory variables and unobserved heterogeneity.
Biases related to buyer unobserved heterogeneity can occur because processors supplying high-quality restaurants need high-valued seafood products and may be ready to pay more than the average customer. Conversely, buyers working for secondary processing plants mostly purchase low-valued fish and may bargain harder on prices than other customers.
8
Moreover, some sorting of wholesale buyers may occur across local fish markets according to their willingness to pay because of specific local downstream markets.
Biases related to vessel unobserved heterogeneity can occur because small vessels operating through short fishing trips essentially sell fresh fish in small lots at high prices. The largest trawlers spending one week or more at sea land frozen fish and may make discounts on large lots. There may also be some sorting of vessels across local fish markets according to production costs and fish quality because fishing gear used by vessels varies over space. In order to avoid biases due to these correlations, we add seller-specific terms 𝛾𝑗 and buyer-specific terms 𝛿𝑘 to our price equation. Treating these terms as random effects would not allow to capture their correlation with observable fish characteristics and local market fixed effects. We therefore treat buyer and seller specific terms as fixed effects. Our price specification becomes:
𝑃𝑖 = 𝑋𝑖𝛽 + 𝜓𝑐(𝑖)+ 𝛾𝑗(𝑖)+ 𝛿𝑘(𝑖) + 𝜗𝑡(𝑖)+ 𝜀𝑖 (2)
where 𝑗(𝑖) is the seller (the vessel in our context) involved in transaction 𝑖, and 𝑘(𝑖) is the buyer. We assume that the error term 𝜀𝑖 is not correlated with the observables and the various fixed effects.
It is important to note that this specification includes non-nested terms as there may be some mobility of buyers and vessels across local fish markets. While small vessels are always expected to land their catches in the same market, it is likely that some of the largest vessels sell their catches in various places depending on their fishing location. Similarly, some fish buyers may purchase in only one fish market while others may purchase in several.
We need an approach to estimate our model which includes four sets of fixed effects. As there are only 12 months in a year, and at most 37 local fish markets where the selected species are traded, time and local fixed effects can easily be taken into account with month dummies and local market dummies. We are left with two series of buyers’ and sellers’ fixed effects whose number is larger than a thousand for most species (see Table 2). Some methods to obtain the least square estimator of two non-nested very large sets of fixed effects were first developed by Abowd et al. (1999) and Abowd et al. (2002) in a labor study using linked employer-employee data. They are based on specific algorithms used to solve the first order conditions obtained when minimizing the sum of squared errors. Our number of fixed effects is not as large as theirs and we thus use more standard methods to estimate the model under alternative identifying assumptions, as explained below.
9
A particular emphasis is put in the literature on the necessary condition to separately identify the two sets of fixed effects. In labor studies, the condition is that there is enough mobility of workers between firms so that all firms are interconnected by mobile workers (Abowd et al., 2008, Andrews et al., 2006). In our study, vessels are considered instead of firms and they are interconnected through customers purchasing fish from different sellers. Descriptive statistics show that the interconnection of vessels is good for all fish species. For instance, for monkfish which is our reference species, each account (resp. buyer) is involved in transactions with an average number of 18.2 vessels (resp. 27.2 vessels) during the year, as shown in Table 2. An additional difficulty in our study is that the specification also includes local market fixed effects that we want to identify separately from buyer and seller fixed effects. Without additional assumptions, some mobility of both sellers and buyers across local fish markets is necessary for identification. We can track buyers, but not accounts across local fish markets. This implies that additional assumptions are needed to identify the local market fixed effects when using accounts. We now discuss these additional identification assumptions. The details of the estimation approach are given in the appendix.
The no-mobility case
We first ignore the mobility of agents across local fish markets, assuming no mobility at all. This benchmark case will be useful to assess the importance of mobility in identifying the different sets of fixed effects. In this case, a vessel selling on 𝐿 local fish markets is treated as 𝐿 different vessels.8
The account number is used as the buyer identifier on a given local fish market and this number is not tracked across local fish markets.
In this setting, additional assumptions are needed to identify the local market effects. From specification (2), the local market fixed effect 𝜓𝑐 can be expressed as the average transaction price on that market net of the fish, buyer, seller and time effects:
𝜓𝑐 = 𝐸[𝑃𝑖 − 𝑋𝑖𝛽 − 𝛾𝑗(𝑖)− 𝛿𝑘(𝑖)− 𝜗𝑡(𝑖)|𝑖 ∈ 𝑐] (3)
This expression can be rewritten as:
𝜓𝑐 + 𝐸[𝛾𝑗(𝑖)+ 𝛿𝑘(𝑖)|𝑖 ∈ 𝑐] = 𝐸[𝑃𝑖 − 𝑋𝑖𝛽 − 𝜗𝑡(𝑖)|𝑖 ∈ 𝑐] (4)
As the mobility of agents across local fish markets is ignored, the average sum of the buyer and seller fixed effects on a local market cannot be separately identified from the local market fixed effect as shown by the left-hand side of equation (4). To guarantee the identification of
8 In practice, this amounts to consider the couple (local fish market, vessel) as the identifier for sellers instead of
10
the model, we assume that the average sum of the buyer and seller fixed effects on each local market is zero.
A1. 𝐸[𝛾𝑗(𝑖)+ 𝛿𝑘(𝑖)|𝑖 ∈ 𝑐] = 0 for each local fish market 𝑐.
As the sum of the two fixed effects can be interpreted as a match between a buyer and a seller of a specific form, our assumption states that the average match on every local market is the same (and normalized to zero). This implies that the fixed effect of a given local fish market is the average transaction price on that market net of fish and time effects as shown by equation (4). The identification condition A1 is quite restrictive, but the model remains more attractive than specification (1) as it allows for a correlation between fish characteristics and buyer/seller fixed effects. In specification (1), the two sets of fixed effects enter the residual and OLS results are biased if their correlation with fish characteristics is different from zero. We need one identifying restriction on seller fixed effects and one identifying restriction on buyer fixed effects for each group of interconnected sellers and buyers. As the mobility of agents across markets is ignored, agents on different markets are not interconnected. One identifying restriction is thus needed for each set of fixed effects on each local fish market.9 Once the seller and buyer fixed effects have been estimated (see Appendix), we center them with respect to their local market average. This makes the fixed effects comparable across local fish markets (Abowd et al., 2002). It also implies in our variance analysis that the variance of seller fixed effects and the variance of buyer fixed effects will be the intra local fish market variance.
Mobility of sellers only
We now take into account the fact that some vessels land fish in several fish markets. This may occur if vessels believe that some buyers are more willing to pay for specific products in some places, or if skippers have several fishing zones and land their catches in the nearest fish market to reduce transportation costs. In the case of monkfish, the percentage of vessels selling fish on at least two markets during the year is around 16.5%, which is significant but not large. This percentage has the same order of magnitude for other species, as it varies from 13% to 24%. It is then useful to rewrite equation (4) as:
𝜓𝑐 + 𝐸[𝛿𝑘(𝑖)|𝑖 ∈ 𝑐] = 𝐸[𝑃𝑖 − 𝑋𝑖𝛽 − 𝜗𝑡(𝑖)− 𝛾𝑗(𝑖)|𝑖 ∈ 𝑐] (5)
9 In practice, it sometimes happens that some sellers are not interconnected to others on a given fish market. In
that case, one has to consider an identification restriction for each group of well-interconnected sellers. The same comment applies to buyers.
11
As there is no mobility of buyers across local fish markets, the average buyer fixed effects on a local market cannot be separately identified from the local market fixed effect as shown by the left-hand side of equation (5). To grant the identification of the model, we now assume that the mean of buyer fixed effects on each local market is zero.
A2. 𝐸[𝛿𝑘(𝑖)|𝑖 ∈ 𝑐] = 0 for each local fish market 𝑐.
Our assumption states that the average composition of buyers is the same on every local market (and normalized to zero). It implies that the fixed effect of a given local fish market is the average transaction price on that market net of fish, seller and time effects as shown by the right-hand side of equation (5).
Mobility of both sellers and buyers
In our previous estimations, accounts (specific to fish markets) were used to determine who purchases fish. We now rather consider buyers as they can be tracked across markets thanks to their identifier. Some fish markets will be considered as well interconnected if, when restricting the sample to transactions occurring on these fish markets, Assumptions A1 and A2 are not needed for identification when estimating equation (2). Put differently, some fish markets are well interconnected if there is enough mobility of sellers and buyers across fish markets for seller, buyer and local market fixed effects to be all identified (provided one fixed effect of each series is fixed to zero as normalization). For a group of well interconnected fish markets, it is possible to test the absolute law of one price while taking into account the unobserved heterogeneity of buyers and sellers without any restriction on sorting across local markets. The determination of groups of well interconnected fish markets is detailed in Appendix.
3.2. The role of spatial frictions in explaining spatial variations in prices
As a final step, we assess to what extent spatial frictions explain differences in local price fixed effects. For that purpose, we consider the following bilateral framework. Let 𝜓𝑐,𝑠 denote the fixed effect for local market 𝑐 of species 𝑠 (where subscript 𝑠 has been reintroduced). Following Broda and Weinstein (2008), we want to explain the absolute price difference �∆𝜓𝑐𝑐′,𝑠� with ∆𝜓𝑐𝑐′,𝑠 = 𝜓𝑐,𝑠− 𝜓𝑐′,𝑠 as a function of distance between local markets and a
parameter capturing the fact that two markets are located on two different coasts, i.e. the Atlantic and the Mediterranean. Indeed, the Atlantic and the Mediterranean are two disconnected areas for the French fishing fleet, since the only maritime passage between them
12
is via the Straits of Gibraltar. In our sample, while as many as 32 local markets are located along the Atlantic coast, only 7 of them are located along the Mediterranean.
We consider the following linear model:
�∆𝜓𝑐𝑐′,𝑠� = 𝛼 + 𝛽 ln 𝑑𝑐𝑐′+ 𝜔𝐵𝑐𝑐′+ 𝜇𝑠+ 𝜀𝑐𝑐′ (6)
where 𝑑𝑐𝑐′ is the distance in kilometers between fish markets 𝑐 and 𝑐′, 𝛽 is the elasticity of price difference with respect to distance, 𝐵𝑐𝑐′ is a dummy equal to one when one of the local markets 𝑐 or 𝑐′ is located along the Atlantic coast and the other is located along the Mediterranean (zero otherwise), 𝜔 is a parameter measuring the magnitude of the coast effect, 𝛼 is a constant, 𝜇𝑠 is a species fixed effect, and 𝜀𝑐𝑐′ is an error term.10 As we consider the
transaction to be the unit of analysis, model (6) is estimated by weighted least squares where the weight is given by 𝑁𝑐𝑁𝑐′/𝑁2 with 𝑁𝑐 and 𝑁𝑐′ the numbers of transactions occurring in fish markets 𝑐 and 𝑐′ respectively, and 𝑁 the total number of transactions. As a robustness check, we also estimate regressions where the dependent variable is the squared difference in fish market fixed effects �∆𝜓𝑐𝑐′,𝑠�2 instead of the absolute difference.
4. Empirical results
We now assess whether price differences exist between local fish markets once the heterogeneity among fish, sellers, buyers and months is netted out. We focus on the monkfish species which is ranked first in terms of sales value in France in 2007 and present the results for the specifications developed in the previous section. Results obtained when considering other species are discussed at the end of this section.11
4.1. Spatial variations in prices for monkfish
We first regress fish prices on local market fixed effects only. Results are reported in column 1 of Table 3. They show large spatial variations in prices. The R² measuring the explanatory power of local fixed effects is large, with a value of 46%. We then assess to what extent these spatial variations in prices are due to spatial differences in fish characteristics.
For that purpose, we add fish characteristics to our specification, as well as time fixed effects as controls, which leads us to equation (1). Inclusion of these additional terms divides the
10
Note that our specification is symmetric in 𝑐 and 𝑐′, which means that the difference between 𝑐′ and 𝑐 is redundant with the difference between 𝑐 and 𝑐′. As a consequence, we only consider differences for pairs (𝑐, 𝑐′) such that 𝑐 < 𝑐′. Also, we do not include additive local market fixed effects in specification (6) such as Imbs et al. (2010) because i) it is not consistent with a specification of price differences and ii) our goal is to evaluate differences across local markets and not to control for them in the right-hand side of (6).
11
13
variance of estimated local market fixed effects by more than three, from .053 (column 1) to .015 (column 2). An explanation of this decrease is the positive correlation between fish quality effects and local market fixed effects, which is equal to .36 for monkfish, indicating that high-quality products are most often sold on the most expensive markets.
There are also variations in quality within local fish markets as the R² increases substantially up to 74%. The estimated coefficients of fish characteristics have the expected sign. Fish with the lowest quality is much cheaper with a price per kilo approximately 60% lower than fish with the highest quality. Also, fish sold in pieces (with cut-off heads) is significantly more expensive than whole fish as raw inedible parts have been removed. We add the fish quantity sold during the transaction in column 3. This additional covariate does not affect our previous results and does not improve the fit of the model.12 The estimated parameter of quantity has the expected negative sign: larger quantities are, on average, sold for a cheaper price per kilo.
[ Insert Table 3 here ]
Next, we introduce account and seller fixed effects following equation (2). Results assuming no seller mobility are reported in column 4 of Table 3, and results taking seller mobility into account in column 5. We obtain results very similar to those reported previously, in particular for the variance of local market fixed effects.13 This suggests that the fish market where vessels choose to land catches does not depend on the expected local price. It may rather depend on the location of the fishing zone, as landing fish close to this zone reduces transport costs. At the same time, the introduction of buyer and seller fixed effects leads to a significant increase of the R² value, from .74 to .80.
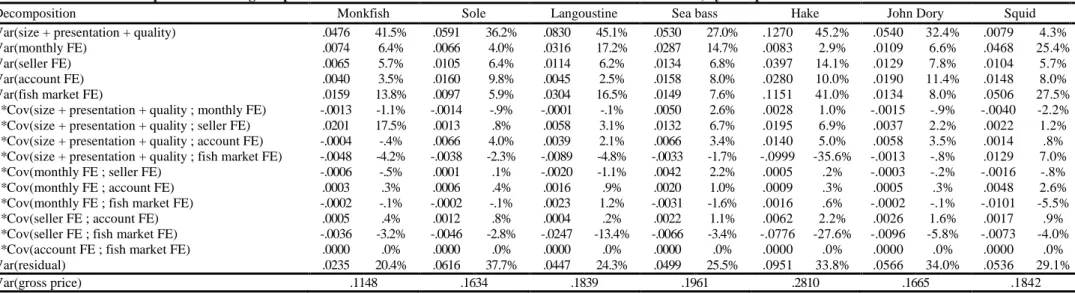
To assess the importance of factors in explaining fish price variations, we perform a variance decomposition for equation (2) when taking seller mobility into account in the estimations. Results are reported in Table 4.14 For monkfish, space plays an important role as the variance of estimated local market fixed effects accounts for 13.8% of price variations. This shows that there is not a unique price on the fish market for monkfish and spatial frictions may occur.
12 For these reasons, as well as the potential endogeneity of quantity due to a missing variable problem (since
fish availability can influence both its price and the size of fish lots), we choose to exclude quantity from our other specifications.
13 It should be mentioned, however, that there are slight variations in the values and ranking of estimated local
market fixed effects. The correlation between local effects obtained from specification (1) and specification (2) assuming no mobility (respectively taking into account vessel mobility) is .983 (respectively .855).
14 We rely on the estimates obtained for the scenario with seller mobility to perform the variance decomposition.
We prefer not to include quantity in the list of explanatory variables as this covariate is likely to be endogenous. Additional results (not reported) show that introducing quantity in the regressions has no effect at all on the variance decomposition.
14
The most important determinants of price variations remain fish characteristics. Size, presentation and quality account for 41.5% of price variations.
Time, seller and account fixed effects play a lesser role, explaining, respectively, 6.4%, 5.7% and 3.5% of price variations. In particular, vessel unobserved heterogeneity does not matter much although it captures to some extent unobserved fish quality related to fishing gear and onboard fish storage. This suggests that conditionally on observable characteristics, monkfish is a rather homogenous product.15
[ Insert Table 4 here ]
4.2. Spatial variations in prices for other species
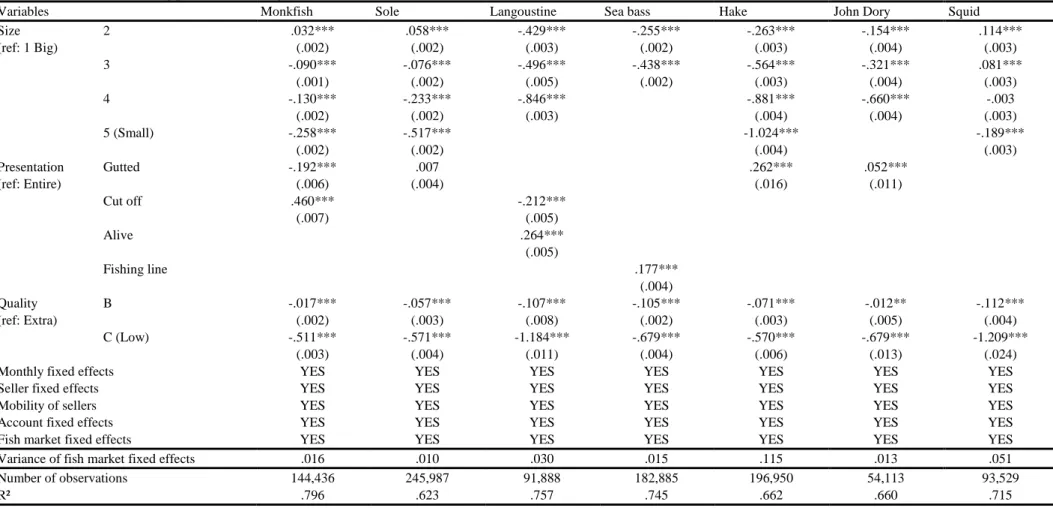
We also conduct a variance decomposition of prices for each fish species.16 Results reported in Table 4 confirm that local markets play a major role for some species. In particular, space is a major determinant of prices for hake as local market fixed effects explain as much as 41% of price variations. The corresponding figure is also large for squid, with a value of 27.5%. By contrast, local markets play a minor role for sole, sea bass, and John Dory as they explain less than 10% of price variations (5.9%, 7.6% and 8% respectively).
Fish characteristics play an important role, except for squid, for which they explain only 4.3% of price variations. This is not really surprising as there is not much variation in presentation or size for this species. Among fish characteristics, size is always an important determinant of the price per kilo. A lower price is usually associated with a smaller fish, although there are exceptions. For species like monkfish and sole, fish in the second largest size category is more expensive than fish in the first size category because it better fits certain market requirements (the size of portions). Whereas monkfish is more expensive in pieces than whole as the non-edible raw material has been discarded, this is not the case for langoustine, for which cut-off pieces are mostly frozen tails whose value is lower than that of a whole live langoustine. The importance of time effects also varies a lot across species, mainly because some species are seasonal whereas others are not. Month fixed effects account for as much as 25.4% of price variations for squid, with catches varying a lot over the year and being largest in October and January. Time effects also have a large explanatory power for langoustine as they explain around 17.2% of price variations. The price is low between May and July when
15
We also find a large positive weight (17.5%) for the covariance between seller fixed effects and the effect of fish characteristics. A possible explanation is that seller fixed effects capture unobservable fish quality, and that observable fish characteristics are correlated with unobservable ones.
16 Estimation results of the price equation when vessel mobility is taken into account is reported in Table A2 in
15
langoustine are abundant, but it increases sharply in December as langoustine are more scarce and demand rises sharply at Christmas and New Year.
Finally, vessel and buyer unobserved heterogeneity explain a sizable share of price variations, but their explanatory power is never very large. Seller fixed effects account for 14.1% of price variations for hake, but the corresponding value is lower for other species and never exceeds 8%.17 Buyer fixed effects account for 11.4% of price variations for John Dory, but the corresponding value is 10% at most for other species, and even below 4% for monkfish and langoustine.
4.3. The role of distance and coast effects
We now assess to what extent spatial differences in fish prices net of composition effects are related to distances between local markets and the location on the Atlantic or Mediterranean coast.
We regress the absolute price difference between estimated local fixed effects on the logarithm of distance between the corresponding markets.18 Data for species are pooled and results are reported in column 1 of Table 5. The effect of distance is found to be positive and significant. Adding a dummy indicating whether markets are located on different coasts (column 2) substantially decreases the marginal effect of distance, but it remains positive and significant. The effect of the coast dummy is also found to be positive and significant, suggesting that markets on the two coasts are not integrated. Adding species dummies to control for differences in price magnitude between species does not affect the results, as shown in columns 3 and 4.
[ Insert Table 5 here ]
When only distance is introduced in the specification (in addition to fish dummies), its coefficient is .067, which suggests that adding one standard deviation (258 kilometers) to the average distance between two fish markets (371 kilometers) leads to a variation in the price ratio between fish markets of 3.6%.19 This effect is sizable, but not large. Furthermore, it decreases significantly when the coast dummy is introduced in the regression since the
17
Hake can be targeted by vessels as different as trawlers, gillnetters and hand-liners, or harvested as by-catch by vessels targeting langoustine on bottom ground. Fish quality varies according to the type of fishing gear. Price variations of hake may thus be explained by seller fixed effects as unobserved heterogeneity in fish quality is captured by seller fixed effects.
18
Results obtained when using squared differences of local fixed effects instead of absolute differences are reported in columns 5-8 of Table 6 for the full sample and in panel B of Table 7 for the various species. They are qualitatively similar and are thus not commented in the text.
19 Descriptive statistics on the average and standard deviation of distances are given in Table A3 in Appendix.
16
coefficient of distance falls to .027. In that case, adding one standard deviation to the average distance between fish markets leads to a variation in the price ratio between fish markets of just 1.4%.
In fact, the coast effect itself is very large, at .177, which corresponds to a variation in the price ratio as large as 19.4%. Price differences between coasts can also be assessed by running a descriptive regression of the local fixed effects on a Mediterranean coast dummy and species dummies. As shown in Appendix Table A4, we obtain a coefficient of .294 for the coast effect and prices are thus 34% higher on the Mediterranean coast than on the Atlantic. This difference can be explained by the geographic separation of the Atlantic and Mediterranean coasts for vessels. Indeed, vessels wishing to move from one coast to the other could only do so by going around Spain and through the Straits of Gibraltar. In practice, vessels based in a port on one coast never make a trip to the other coast because costs are far too high.
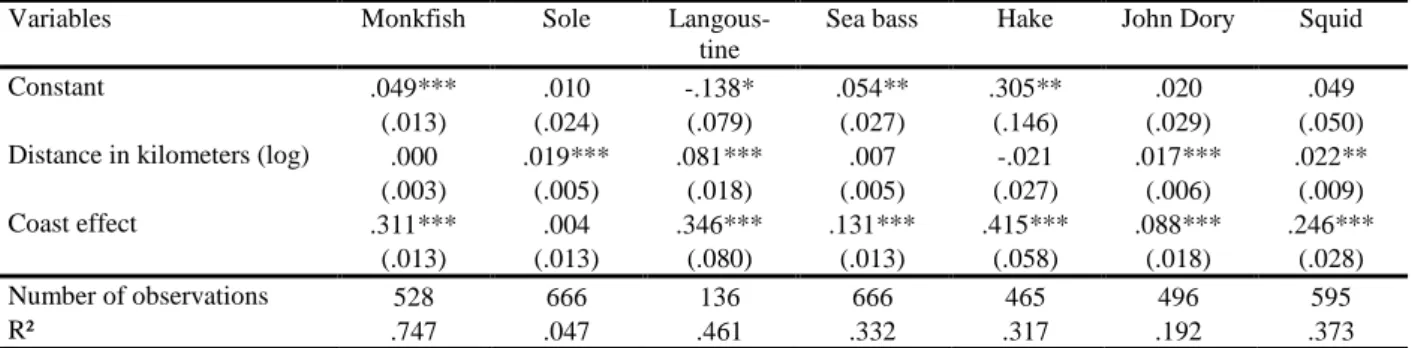
We report in Table 6 the results obtained by species for a specification including distance and a coast dummy. Results differ across species with the distance coefficient varying from a non-significant value of -.021 for hake to a non-significant value of .081 for langoustine. However, even for langoustine, adding one standard deviation (237 kilometers) to the average distance between two fish markets (297 kilometers) leads to a variation in the price ratio between fish markets of only 5.1%. This suggests that distance effects are small.
[ Insert Table 6 here ]
We also find substantial differences for the coast effect, which varies from a non-significant value of .004 for sole to a significant value of .415 for hake. In fact, the coast effect is important for four species which are, in decreasing order of effect size: hake, langoustine, monkfish and squid.
4.4. The determination and characterization of integrated markets
We finally assess to what extent local fish markets are integrated. We determine the main group of local fish markets that are well interconnected by flows not only of sellers, but also of buyers, who are now tracked across fish markets using the buyer identifier instead of the account identifier. For this main group, we test the absolute law of one price.
For monkfish, we are able to identify the buyer for 87.1% of the 144,436 transactions. The remaining observations are dropped from our sample. As shown in Table 2, each identifier is related to an average of 27.1 vessels during the year, which is larger than for accounts, for which the average is 18.2 vessels. This comes from the aggregation of several accounts for a
17
given identifier, with an average of 1.8 accounts per identifier. Note that this leads to a mechanical decrease in the number of buyer fixed effects. The percentage of mobile buyers purchasing monkfish on at least two local markets reaches 23.4%, which is higher than the percentage of vessels (16.5%).
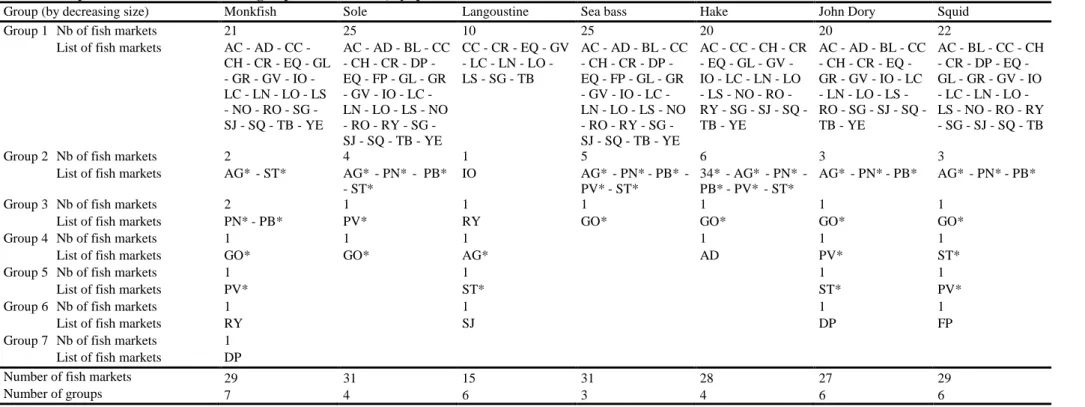
Table 7 shows for various species that there are several groups of well interconnected fish markets. For monkfish, there are exactly seven groups (column 1). The largest group, defined as the group where the largest number of transactions takes place, includes 21 fish markets, compared with 33 fish markets for monkfish in the full sample. Interestingly, most fish markets on the Atlantic coast are in this group, while fish markets on the Mediterranean coast are all in other groups. This reinforces our claim that Mediterranean markets and Atlantic markets are separated.
[ Insert Table 7 here ]
We then assess to what extent the absolute law of one price is verified. For that purpose, we assess whether our dispersion indicator defined as the ratio between the standard error of local market fixed effects (weighted by the number of transactions) and the average log-price takes a value lower than .05.
As shown in Column 1 of Table 8, the values of the indicator obtained from estimates of equation (2) under assumption A2when using all transactions (model A) and when using only transactions from all matched buyers (model B) are close (.071 and .069). Our indicator for monkfish decreases sharply to just .027 (model C) when restricting the sample of transactions to those in the main group of well interconnected fish markets. 20 Relaxing assumption A2 does not change the results very much, as our indicator decreases to .025 (model D). This value is very small and suggests that the absolute law of one price is verified for monkfish when considering the main group of well interconnected fish markets, which includes most of the markets on the Atlantic coast.
[ Insert Table 8 here ]
Next, we repeat the analysis for the other species. Interestingly, Table 7 shows that the main group of well interconnected fish markets always mainly comprises markets located on the Atlantic coast. It does not include any market on the Mediterranean coast and this suggests, once again, that the two coasts are not integrated. As shown in Table 8, most transactions occur in the main group for every species. Our indicator computed under Assumption A2 decreases when considering the main group for all species. The decrease is by far the largest
20 The sample restricted to the largest group comprises 110,642 transactions representing 88.2% of transactions
18
for hake (from .246 to .094) for which the Atlantic and Mediterranean coasts are not separated, in line with the regression results reported in Table 6.
When relaxing Assumption A2, our indicator is quite stable for every species. The absolute law of one price is verified for most species. Indeed, our indicator is below .05 for monkfish, sole, langoustine, sea bass and John Dory. Even for squid and hake, it remains quite small, as it takes respectively the values .068 and .100, suggesting that the law of one price is nearly verified.
5. Conclusion
In this paper, we test the absolute law of one price for several fish species using a unique exhaustive dataset on fish transactions occurring on the French fish market in 2007. An originality of our work is that we are able to take into account spatial differences in buyers’ willingness to pay and in sellers’ production costs by modeling the unobserved heterogeneity of agents. We estimate a price equation including observable fish characteristics as well as seller, buyer, time and local market fixed effects. Spatial variations in prices net of composition effects are captured by the variations of local market fixed effects.
Our main conclusion is that the absolute law of one price does not hold for most of the selected fish and crustacean species when considering all local fish markets. A key reason is that fish markets in France are located on two separate coasts, the Atlantic and the Mediterranean. Vessels cannot easily move from one coast to the other as this requires going around Spain and through the Straits of Gibraltar. This trip is never made to land fish as moving costs are prohibitive. When restricting the analysis to the main group of well interconnected fish markets which always comprises markets located along the Atlantic coast, the absolute law of one price is verified for nearly all species.
19
References
Abowd J., Kramarz F., Margolis D., (1999), “High wage workers and high wage firms”, Econometrica, vol. 67, pp. 251-233.
Abowd J., Creecy R., Kramarz F., (2002), “Computing person and firm effects using linked longitudinal employer-employee data”, mimeo, Cornell University.
Abowd J., Kramarz F., Woodcock S., (2008), “Econometric analyses of linked employer-employee data”, in Matyas L., Sevestre P., (eds), The Econometrics of Panel Data, Kluwer Academic Publishers, pp. 727-760.
Andrews M., Schank T., Upward R., (2006), “Practical fixed-effects estimation methods for the three-way error-components model”, Stata Journal, vol. 6, pp. 461-481.
Asche F., Gordon D.V., Hannesson R., (1996), “Tests for market integration and the Law of One Price: the market for whitefish in France”, Marine Resource Economics, vol. 19, pp. 195-210.
Broda C., Weinstein D., (2008), “Understanding international price differences using barcode data”, NBER Working Paper, n°14017.
Chiang F.-S., Jonq-Ying L., Brown M.G., (2001), “The impact of inventory on tuna prices: An application of scaling in the Rotterdam inverse demand system”, Journal of Agricultural
and Applied Economics, vol. 33, pp. 403-411.
Combes P.-P., Duranton G., Gobillon L., (2008), “Spatial wage disparities: Sorting matters!”,
Journal of Urban Economics, vol. 63, pp. 723-742.
Engel C., Rogers J., (1996), “How wide is the border?”, American Economic Review, vol. 86, pp. 1112-1125.
Fan C., Wei X., (2006), “The Law of One Price: Evidence from the transitional economy of China”, Review of Economics and Statistics, vol. 88, pp. 682-697.
Gallegati M., Giulioni G., Kirman A., Palestrini A., (2011), “What’s that got to do with the price of fish ? Buyers behavior on the Ancona fish market”, Journal of Economic Behavior
and Organization, vol. 80, pp. 20-33.
Goldberg P.K., Verboven F., (2005), “Market integration and convergence to the Law of One Price: evidence from the European car market”, Journal of International Economics, vol. 65, pp. 49-73.
Graddy K., (1995), “Testing for imperfect competition at the Fulton fish market”, Rand
Journal of Economics, vol. 26, pp. 75-92.
Guillotreau P., Jiménez-Toribio R., (2006), “The impact of electronic clock auction systems on shellfish prices: Econometric evidence from a structural change model”, Journal of
Agricultural Economics, vol. 57, pp. 523-546.
Guillotreau P., Jiménez-Toribio R., (2011), “The price effect of expanding fish markets”,
Journal of Economic Behavior and Organization, vol. 79, p. 211-225.
Handbury J., Weinstein D., (2011), “Is New Economic Geography right? Evidence from price data”, NBER Working Paper n°17067.
Härdle W., Kirman A.P., (1995), “Nonclassical demand: A model-free examination of price quantity relations in the Marseille fish market”, Journal of Econometrics, vol. 67, pp. 527-557.
20
Imbs J., Mumtaz H., Ravn M., Rey H., (2010), “One TV, one price?”, Scandinavian Journal
of Economics, vol. 112, pp. 753-781.
Kirman A.P., (2001), “Market organization and individual behavior: Evidence from fish markets”, in Rauch J.E., Casella A., (Eds), Networks and Markets, London, Russell Sage Foundation, pp. 155-195.
Miljkovic D., (1999), “The law of one price in international trade: A critical review”, Review
of Agricultural Economics, vol. 21, pp. 126-139.
Parsley D., Wei S.J., (1996), “Convergence of the Law of One Price without trade barriers or currency fluctuations”, Quarterly Journal of Economics, vol. 111, pp. 1211-1236.
Vignes A., Etienne J.-M., (2011), “Price formation on the Marseille fish market: evidence from a network analysis”, Journal of Economic Behaviour and Organization, vol. 80, pp. 50-67.
21
APPENDIX: ESTIMATION OF LOCAL MARKET FIXED EFFECTS
We explain in this Appendix how to estimate equation (2) under alternative identification assumptions.
The no-mobility case
To estimate specification (2) under the empirical counterpart of assumption A1, we first center the observations with respect to their local market average. This transformation makes the local market fixed effects disappear, and we obtain:21
Δ𝑃𝑖 = Δ𝑋𝑖𝛽 + Δ𝜗𝑡(𝑖)+ 𝛾𝑗(𝑖)+ 𝛿𝑘(𝑖)+ Δ𝜀𝑖 (A1)
where Δ denotes the operator centering variables with respect to their local market average. Interestingly, equation (A1) corresponds to the error component model described in Abowd et al. (1999).
In practice, the simplest procedure to estimate (A1) consists in including seller and buyer dummies in (1) and estimating the model by OLS, one seller dummy and one buyer dummy being dropped on each local market for identification purposes. However, due to the large number of fixed effects, this procedure cannot be implemented because of computation limits. We therefore apply a within-account transformation to equation (A1) to make the buyer fixed effects 𝛿𝑘 disappear and estimate the resulting equation by OLS.
Denote by 𝛽̂ the estimated coefficients of fish variables, 𝜗̂𝑡 the estimated time fixed effects and 𝛾�𝑗 the estimated seller fixed effects. The estimated fixed effect of buyer 𝑘 can be recovered as the average of Δ𝑃𝑖− Δ𝑋𝑖𝛽̂ − Δ𝜗̂𝑡(𝑖)− 𝛾�𝑗(𝑖) computed on the subset of transactions involving the buyer. The local market fixed effects are recovered as the empirical counterpart of the right-hand side of equation (4).
Mobility of sellers only
To estimate specification (2) under the empirical counterpart of assumption A2, we again center the observations with respect to their local market average. This transformation makes the local market fixed effects disappear, and we obtain:
Δ𝑃𝑖 = Δ𝑋𝑖𝛽 + Δ𝜗𝑡(𝑖)+ Δ𝛾𝑗(𝑖)+ 𝛿𝑘(𝑖)+ Δ𝜀𝑖 (A2)
We use the same estimation procedure as in the no-mobility case. The only difference in the specification to be estimated is that dummies for vessels should now be centered with respect
21 The empirical counterpart of the expectation involved in assumption A1 is the empirical average computed
22
to their local market average. The model is first projected in the within-buyer dimension and estimated using OLS. This step allows to estimate the effect of fish characteristics as well as seller and time fixed effects. The fixed effect of any given buyer 𝑘 can then be recovered as the average of Δ𝑃𝑖− Δ𝑋𝑖𝛽̂ − Δ𝜗̂𝑡(𝑖)− Δ𝛾�𝑗(𝑖) computed on the subset of transactions involving the buyer. The local market fixed effects are finally recovered as the empirical counterpart of the right-hand side of equation (5).
Mobility of both sellers and buyers
Equation (2) can be considered directly in the estimation using local market dummies to recover local market fixed effects since the number of fish markets is small. Some identification restrictions are needed as fish markets are not all properly interconnected with buyers and vessels.
We now explain how we introduce identification restrictions. First consider buyers and sellers. We define a group as a set of buyers and sellers including all the buyers having purchased fish at least once from a vessel of that group and all the vessels having sold fish at least once to a buyer of that group. A second group is introduced when there are buyers and sellers such that no buyer in the first group has ever purchased fish from a vessel of the second group and no vessel in the first group has ever sold fish to a buyer of the second group. Drawing on graph theory, Abowd et al. (2002) propose a simple algorithm to identify mutually exclusive groups. We implement this algorithm using the procedure developed by Andrews et al. (2006).
Now consider our three series of fixed effects (buyers, sellers and local markets). We identify three different types of groups: groups of connected buyers and vessels, groups of connected buyers and local markets, and groups of connected vessels and local markets. We then combine these groups to define groups of interconnected buyers, vessels and local markets. Each tri-dimensional group is defined by a unique combination of seller group, buyer-local market group and seller-buyer-local market group. For the various species, we find that there is one group which includes most of the transactions. The proportion of fish transactions in the main group is 87.9% for monkfish, 83.3% for sole, 84.2% for langoustine, 78.2% for sea bass, 68.1% for hake, 90.0% for John Dory, and 79.8% for squid.
For each tri-dimensional group, one local market fixed effect is normalized to zero. Otherwise the estimation procedure is very similar to the one when the mobility of buyers is not considered.
23
The model is first projected in the within-buyer dimension and estimated using ordinary least squares. This step allows to estimate not only the effect of fish variables, and seller and time fixed effects, but also local market fixed effects. We then center the estimated local market fixed effects with respect to their mean in the tri-dimensional group such that centered local market fixed effects are comparable across groups. The fixed effect of any given buyer 𝑘 can then be recovered as the average of 𝑃𝑖− 𝑋𝑖𝛽̂ − 𝜓�𝑐(𝑖)− 𝜗̂𝑡(𝑖)− 𝛾�𝑗(𝑖) computed on the subset of transactions involving the buyer.
24
Figure 1: quantity of fish landed in fish markets in France in 2007
Source: Association des Directeurs et Responsables des Halles à Marée de France, 2007.
Note: map constructed by Jérémie Turpin and Christine Lamberts (CNRS-LETG-Nantes-UMR 6554). Data are available online at the address: http://www.criees-france.com/index.php?id_site=1&id_page=49.
25
Table 1. Prices on local fish markets
Fish species All fish markets Per fish market 𝑐
𝑁 𝑃� 𝜎(𝑃) 𝑁𝑐 𝜎(𝑃�𝑐) max(𝑃�𝑐) min(𝑃�𝑐) Monkfish 144,436 6.248 2.485 33 2.559 13.390 4.337 Sole 245,987 14.079 4.956 37 1.971 19.642 10.801 Langoustine 91,888 11.852 5.015 17 3.486 21.126 7.477 Sea bass 182,885 12.172 5.306 37 2.266 19.439 8.461 Hake 196,950 5.002 2.563 31 .754 7.377 3.787 John Dory 54,113 10.484 3.621 32 1.819 14.034 5.382 Squid 93,529 8.251 4.193 35 2.363 14.156 5.121
Source: RIC 2007, authors’ calculations.
Note: for a given fish species, 𝑃� is the mean price of all transactions, 𝜎(𝑃) the standard deviation and 𝑁 the total number of transactions. 𝑃�𝑐 corresponds to the mean price of all transactions for the fish market 𝑐, max(𝑃�𝑐) and min(𝑃�𝑐) are respectively the maximum and the minimum of 𝑃�𝑐, 𝜎(𝑃�𝑐) is the standard deviation of these mean prices per fish market. 𝑁𝑐 is the number of fish markets under consideration. For each fish species, fish markets with less than 100 transactions are dropped from the sample.
26
Table 2. Descriptive statistics of the sample, by fish species
Variables Monkfish Sole Langoustine Sea bass Hake John Dory Squid
Description of the transaction
Price (ln) 1.770 2.572 2.385 2.405 1.476 2.279 2.011 Quantity (ln) 7.980 6.716 7.793 6.841 7.038 6.849 7.303 Size 1 (large) .143 .191 .083 .248 .079 .120 .162 2 .175 .180 .346 .331 .192 .274 .212 3 .294 .179 .063 .420 .187 .342 .258 4 .224 .183 .508 .000 .250 .264 .221 5 (small) .164 .267 .000 .000 .293 .000 .148 Presentation Whole .025 .461 .140 .778 .316 .242 1.000 Gutted .891 .539 .000 .000 .684 .758 .000 Pieces .084 .000 .030 .000 .000 .000 .000 Alive .000 .000 .830 .222 .000 .000 .000
Quality Extra (top) .398 .636 .851 .673 .593 .348 .503
B .574 .337 .135 .300 .382 .642 .496
C (low) .028 .027 .015 .027 .025 .010 .001
Description of the market
Number of fish markets 33 37 17 37 31 32 35
Number of transactions per fish market 4376.8 6648.3 5405.2 4942.8 6353.2 1691.0 2672.3
Number of vessels 1306 2076 372 2449 1361 1185 1323
Number of transaction per vessel 110.6 118.5 247.0 74.7 144.7 45.7 70.7
Number of accounts 1644 1909 912 1897 1686 1366 1678
Number of transaction per account 87.9 128.9 100.8 96.4 116.8 39.6 55.7
Number of matched buyers 903 1021 540 1011 925 772 948
Number of transactions per matched buyer 139.3 194.5 162.6 148.7 193.4 57.0 80.7
Mobility
% of vessels mobile among fish markets .165 .151 .234 .130 .189 .138 .135
% of accounts among fish markets .000 .000 .000 .000 .000 .000 .000
% of matched buyers mobile among fish markets .233 .235 .213 .233 .253 .215 .204
% of vessels mobile among accounts .887 .943 .960 .940 .935 .871 .901
Number of vessels per account 18.2 26.2 17.8 25.1 24.0 12.9 14.1
% of vessels mobile among matched buyers .896 .936 .961 .935 .939 .873 .895
Number of vessels per matched buyer 27.1 38.6 26.9 37.2 37.2 18.7 19.6
Total number of transactions 144,436 245,987 91,888 182,885 196,950 54,113 93,529
Source: RIC 2007, authors’ calculations.
27
Table 3. Estimates of the log price of monkfish
Variables (1) (2) (3) (4) (5) Size 2 .037*** .037*** .032*** .032*** (ref: 1 Large) (.002) (.002) (.002) (.002) 3 -.088*** -.086*** -.090*** -.090*** (.001) (.001) (.001) (.001) 4 -.122*** -.122*** -.130*** -.130*** (.002) (.002) (.002) (.002) 5 (Small) -.240*** -.241*** -.257*** -.258*** (.002) (.002) (.002) (.002) Presentation Gutted -.143*** -.142*** -.192*** -.192*** (ref: Whole) (.006) (.006) (.006) (.006) Pieces .590*** .583*** .454*** .460*** (.007) (.007) (.007) (.007) Quality B -.044*** -.035*** -.018*** -.017*** (ref: Extra) (.001) (.002) (.002) (.002) C (Low) -.550*** -.550*** -.512*** -.511*** (.003) (.003) (.003) (.003) Quantity (ln) -.006*** (.000)
Monthly fixed effects NO YES YES YES YES
Seller fixed effects NO NO NO YES YES
Mobility of sellers NO NO NO NO YES
Account fixed effects NO NO NO YES YES
Fish market fixed effects YES YES YES YES YES
Variance of fish market fixed effects .053 .015 .015 .017 .016 Correlation of fish market fixed effects 1.000 .671*** .668*** .773*** .400***
1.000 .999*** .984*** .908*** 1.000 .983*** .912*** 1.000 .855*** 1.000 Number of observations 144,436 144,436 144,436 144,436 144,436 R² .458 .743 .743 .798 .796
Source: RIC 2007, authors’ calculations.
Note: (1), (2) and (3) are estimates from OLS models, (4) and (5) are estimates from fixed effect models. Standard errors are in parentheses, significance levels being respectively 1% (***), 5% (**) and 10% (*). The variance of fish market fixed effects is computed weighting by the number of transactions.