HAL Id: hal-02282339
https://hal.archives-ouvertes.fr/hal-02282339
Submitted on 9 Sep 2019HAL is a multi-disciplinary open access archive for the deposit and dissemination of sci-entific research documents, whether they are pub-lished or not. The documents may come from teaching and research institutions in France or abroad, or from public or private research centers.
L’archive ouverte pluridisciplinaire HAL, est destinée au dépôt et à la diffusion de documents scientifiques de niveau recherche, publiés ou non, émanant des établissements d’enseignement et de recherche français ou étrangers, des laboratoires publics ou privés.
Assessment of individual and mixed toxicity of
bromoform, tribromoacetic-acid and 2,4,6
tribromophenol, on the embryo-larval development of
Paracentrotus lividus sea urchin
Karine Lebaron, Lilia Mechiri, Simone Richard, Annabelle Austruy, Jean-Luc
Boudenne, Stéphane Coupé
To cite this version:
Karine Lebaron, Lilia Mechiri, Simone Richard, Annabelle Austruy, Jean-Luc Boudenne, et al.. As-sessment of individual and mixed toxicity of bromoform, tribromoacetic-acid and 2,4,6 tribromophenol, on the embryo-larval development of Paracentrotus lividus sea urchin. Environmental Science and Pollution Research, Springer Verlag, 2019, 26 (20), pp.20573-20580. �10.1007/s11356-019-05279-8�. �hal-02282339�
Assessment of individual and mixture toxicity of bromoform, tribromoacetic-acid and 2,4,6
1
tribromophenol, on the embryo-larval development of Paracentrotus lividus sea urchin.
2 3
Karine Lebaron1,2, Lilia Mechiri1, Simone Richard1, Annabelle Austruy3, Jean-Luc Boudenne2,
4
Stéphane Coupé1
5
1 Université Toulon, CNRS/INSU, IRD, MIO UM 110, Mediterranean Institute of Oceanography, La
6
Garde, France.
7
2 Aix-Marseille-Université, CNRS, LCE UMR7476, 13331 Marseille, France
8
3 Institut Ecocitoyen pour la Connaissance des Pollutions, Centre de vie, La Fossette, 13270
Fos-9
sur-Mer, France
10 11
Keywords: Bromoform, Tribromoacetic acid, Tribromophenol, Disinfection by-products, Sea
12
urchin, Paracentrotus lividus, Ecotoxicology, Genotoxicity.
13 14
Abstract
15
Water chlorination is the most widely used technique to avoid microbial contamination and
16
biofouling. Adding chlorine in bromide-rich waters leads to the rapid oxidation of bromide ions and
17
leads to the formation of brominated disinfection by products (bromo-DBPs) that exert adverse
18
effects on various biological models. Bromo-DBPs are regularly encountered within industrialized
19
embayments, potentially impacting marine organisms. Of these, bromoform, tribromoacetic acid
20
and tribromophenol are among the most prevalent. In the present study, we tested the potential
21
toxicity and genotoxicity of these disinfection by-products, using sea urchin, Paracentrotus lividus,
22
embryos. We highlighted that tribromophenol showed higher toxicity compared to bromoform
23
and tribromoacetic acid. Furthermore, a synergistic effect was detected when tested in
24
combination. Pluteus cells exposed for 1h to mixtures of DPBs at several concentrations
25
demonstrated significant DNA damage. Finally, when compared to a non-exposed population, sea
26
urchins living in a bromo-DPB-polluted area produced more resistant progenies, as if they were
27
locally adapted. This hypothesis remains to be tested in order to better understand the obvious
28
impact of bromo-DBPs environments on marine wildlife.
29 30 31
Introduction
32
Chlorination has been used worldwide, for decades, and is one of the most effective treatment for
33
water disinfection in treatment plants for the production of tap water. Chlorination is also
34
employed in the management and upkeep of industrial installations, where water is often used for
35
cooling or heating purposes, as well as to prevent and control biofouling and corrosion of pipelines.
36
Hence, in some industrialized embayment areas, huge volumes of coastal seawater are
37
continuously being pumped and chlorinated before being re-released into the original embayment
38
(Allonier et al. 1999; Boudjellaba et al. 2016; Manasfi et al. 2018). As chlorine is very reactive in the
39
presence of natural organic matter, seawater chlorination generates a complex set of brominated
40
and chloro-brominated disinfection-by-products (DBPs). Finally, benthic organism, resident in the
41
embayment, are exposed to these DBPs (Singer 1999; Westerhoff et al. 2004; Halpern et al. 2008).
42
Although the diversity and occurrence of brominated DBPs in contaminated coastal seawater is
43
relatively undocumented (Richardson et al. 2007; Manasfi et al. 2017), bromoform (halomethane),
44
tribromoacetic acid (haloacetic acid) and tribromophenol (halophenol) are among the most
45
prevalent molecules, often measured at relatively high concentrations (i.e. µg/L) (Manasfi et al.
46
2018).
47
Most of the DBPs so far tested have been found to be toxic and genotoxic in diverse model systems,
48
such as bacteria, mammalian cells or zebrafish embryos. Furthermore, brominated DBPs have
49
generally been shown to be more toxic than their chlorinated analogues (Richardson et al. 2007,
50
2010; Yang and Zhang 2013; Hanigan et al. 2017). It is worth noting that at the single molecule
51
level, visible effects have always been following exposure to high concentrations of DBPs,
52
suggesting that toxic and genotoxic risks are limited (Teixidó et al. 2015). Nevertheless, recent
53
epidemiological research has suggested that lifetime exposure to DBPs, mainly through ingestion,
54
would significantly increase the risk of bladder cancer in humans (Villanueva et al. 2004, 2006).
55
Hence, there are great concerns about the level of human exposure, causing health and sanitary
56
surveillance agencies to enact maximum concentration limits (MCL). For instance, the US EPA
57
recommends MCLs for total halomethane and haloacetic acid of 80 µM and 60 µM, respectively,
58
in safe drinking water. It is notable that these values are relatively consistent with the maximum
concentrations measured in the effluents of water treatment plants from the USA, Canada or
60
France (CAREX Canada 2009; Mouly et al. 2009).
61
There are currently no MCLs for environmental waters that harbor functional ecosystems, and
62
which are potentially chronically exposed to DBPs. Studies that assess the toxicity of DBPs in
63
aquatic animals remain scarce and to our knowledge, only two have tested brominated DBPs in
64
recent years, using a zebrafish embryo model (Teixidó et al. 2015; Hanigan et al. 2017). These two
65
studies tested a total of 11 brominated DBPs, including bromoform (BMF) and tribromoacetic acid
66
(TBAA). Most of the brominated DBPs that were compared, proved toxic for larval development,
67
though only at high concentration (i.e. >100 µM). Moreover, short-term exposure to chlorinated
68
wastewater did not have any significant toxic effect. Finally, a genotoxic effect was only detected
69
for chlorodibromomethane and sodium borate at their EC50 levels, 160 µM and 0.049 µM,
70
respectively.
71
In this study, we were interested in broadening the understanding of the toxicological impact of
72
DBPs on coastal marine organisms, using the sea urchin, Paracentrotus lividus, as a proxy for the
73
echinoderm class. Paracentrotus lividus lives in the first few meters of coastal areas. The species is
74
widely distributed along the north-eastern Atlantic coast and on all Mediterranean coasts.
75
Furthermore, they can be encountered in numerous contrasted habitats that include differences
76
in temperature, salinity and chemical contamination (Bellas et al. 2008). While adults are benthic
77
and relatively sedentary, the larvae produced at each reproductive event are pelagic for up to 4
78
weeks, thus ensuring species dispersion. The sea urchin is a relevant model organism to assess the
79
effect of potentially harmful molecules. It is more closely related to human than the mussel (Tu et
80
al. 2006), with two species having been fully sequenced. Reproduction is easily performed in vitro,
81
resulting in high numbers of translucid larvae. Sea urchin larvae have been extensively used to
82
assess the embryo-toxicity and embryo genotoxicity of molecules (Hose 1985; McGibbon and
83
Moldan 1986; Gharred et al. 2016; Morroni et al. 2016; Trifuoggi et al., 2017; Neves et al., 2018;
84
Messinetti et al., 2018; Periera et al., 2018; Dorey et al., 2018).
85
In this study, our objective was to generate additional data in a model marine organism, of the
86
toxic influence of three major brominated contaminants found in coastal seawater that is
87
subjected to massive anthropogenic disturbance. With this aim in mind, we used sea urchin
embryos to assess the toxicity and genotoxic potential of bromoform (halomethane),
89
tribromoacetic acid (haloacetic acid) and tribromophenol (halophenol), tested either alone or in
90
combination, on two populations of P. lividus, either chronically exposed or unexposed.
91 92
Materiel and methods
93
Sea urchins
94
Adult Paracentrotus lividus sea urchins were harvested by scuba diving, on the morning of each
95
experiment, at a non-polluted site (NPS) near the Toulon (Var, France) embayment (Garonne Bay:
96
43.098503-6.018430)and at a polluted site (PS) where sweater is chronically chlorinated (Manasfi
97
et al., 2018). P. lividus were induced to spawn by gentle shaking.
98
Sperms and eggs were individually collected, respectively dried with a micropipette and kept on
99
ice and in 100mL of filtered seawater (FSW). Eggs were microscopically observed to verify maturity
100
before adding dry sperm.
101
Ten independent (i.e. unrelated) larval populations were produced by arbitrarily mixing one sperm
102
with one egg suspension, in 50mL of FSW at 20°C at a concentration of 500 eggs/mL, under
103
agitation for 45 min, then the fertilization rates were assessed.
104
Observed fertilization rates were 100% in every experiment.
105 106
Chemicals
107
Bromoform (CAS 75-25-2), tribromoacetic acid (CAS 75-96-7) and tribromophenol (CAS 118-79-16)
108
were purchased from SimgaAldrich. Stock solutions of bromoform and tribromoacetic acid were
109
prepared by direct dissolution in filtered sea water (FSW). Tribromophenol was first dissolved in
110
dimethylsulfoxide solvent (DMSO) to compensate for its very low water solubility, then it was
111
dissolved in FSW, with a final DMSO concentration of 0.1%.
112 113 Experimental design 114 Toxicological assessments 115
Ten unrelated larval populations were used and tested in triplicates, as follows: in 24-wells
116
microplates, suspensions of 500 fertilized eggs in 2 mL FSW were exposed for 48 hours to 7
concentrations of each chemical (Table 1). At the end of the exposure time, larvae were fixed by
118
adding ethanol at 15% final concentration and kept at 4°C until microscopic observations wre
119
carried out. Normal and abnormal (i.e. delayed growth, developmental anomalies) Pluteus larvae
120
were recorded.
121
Percentages of normal Pluteus larvae were plotted against chemical concentrations. We then
122
determined the dose-response curves using R software and deduced the half maximal effective
123
concentrations, EC50, here considered as the concentration of chemical at which we could observe
124
only 50% of normal and viable larvae among the pool. The no and lowest observed effective
125
concentrations (respectively NOEC and LOEC) were deduced from the chemical concentrations
126
used in the experiments.
127
We then assessed the toxicity of the chemicals combined in ten other independent experiments.
128
Specifically, we tested three mixtures named mix NOECs, mix LOECs and mix EC50, that is each
129
chemical within a mixture is at its specific endpoints (NOEC, LOEC or EC50). Depending on the
130
chemical tested, controls were either exposed to FSW alone or FSW containing 0.1% DMSO.
131 132
Genotoxicity test
133
The genotoxicity of the mix NOECs, mix LOECs and twice mix LOECs was assessed using the comet
134
assays, based on the Tice et al. (2000) procedure.
135
Five thousand, 48-h, Pluteus were exposed as described above for 1 h to the mixtures. After
136
exposure, larvae were collected by centrifugation at 1500g for 10 min at 4°C. The pellet was
137
resuspended in 1mL of FSW, then gently mixed with 1 mL of glycine 1M and incubated on ice for 5
138
min to allow for complete dissociation of cells. Fifty thousand cells were then collected and placed
139
in 1 mL of phosphate buffer saline (PBS) 1× then centrifuged at 3000g for 5 min at 4°C. Pelleted
140
cells were then collected and gently mixed with 50 µL of low melting point agarose at 37°C, then
141
plated onto a pre-coated laboratory microscope slide (Tice et al. 2000).
142
Once prepared, slides were immersed in a lysis buffer (2.5 M NaCl, 100 mM Na2EDTA,2H2O, 10
143
mM Tris pH10, 10 g N-Lauroylsarcosine, 10% DMSO and 1% Triton X100) for 90 min at 4°C. Slides
144
were then placed in an electrophoresis tank containing an alkaline solution (200 mM Na2EDTA
145
2H2O, 10 N NaOH) for 20 min at room temperature, to allow DNA to denature. This was followed
by electrophoresis which was conducted for 20 min at 25V and 350mA. Thereafter, slides were
147
plunged in a neutralization buffer (0.4 M Tris-HCl pH 7.5) for 20 min. Finally, slides were fixed with
148
100% methanol and dried at room temperature overnight.
149
DNA was stained with a solution of SyberGreen (Sigma-Aldrich) deposited onto each slide and left
150
to stand for 20 min in the dark. Slides were then read using an epifluorescence microscope
151
equipped with a digital camera and dedicated software. Whole cells and comets observed within
152
several randomly selected microscopic fields were captured, irrespective of the length and the
153
shape of the comet (Gyori et al. 2014). Pictures were then analysed using Open Comet v1.3.1
154
(cometbio.org) implemented in ImageJ (SciJava) program (Gyori et al. 2014).
155
DNA damage was assessed considering the olive tail moment (OTM) that consider both the length
156
and the distribution of DNA within the comet’s tail (Olive et al. 1991).
157
The control experiment consisted in larval suspensions exposed to FSW containing 700µM of H202.
158
This concentration has been chosen after a preliminary experiment in which we tested the
159
genotoxicity of H202 for a range of concentrations (R² = 0.9967), as previously described (Nahon et
160
al. 2008).
161
DNA damage was assessed via the olive tail moment (OTM), which takes into consideration both
162
the length and the distribution of DNA within the comet’s tail (Olive et al;, 1991).
163
The positive control experiment consisted of larval suspensions to FSW containing 500 µM of H2O2.
164
This concentration was chosen after a preliminary experiment in which we tested the genotoxicity
165
of H2O2 for a range of concentrations (R=0.9983), as previously performed (Nahon et al., 2008).
166 167
Statistical analysis
168
Statistics were performed with Rstudio (version 1.1.442) and XLSTAT (Addinsoft, 2017).
Dose-169
response curves were produced using regression models. Effective concentrations (i.e. EC10, EC50
170
and EC90) values were generated with the “estimating effective doses” (ED.drc) from R package.
171
Prior to Kruskal-Wallis test, ecotoxicological and comet assay data were tested for normality. The
172
Mann-Whitney U test was proceeded to compare data from non-polluted site (NPS) to polluted
173
site (PS). Differences between each condition were considered significant when p-value < 0.05,
174
data were expressed as mean ±S.E.M (standard error of the mean).
Results and discussion
176
Assessment of BMF, TBAA and TBP toxicity on early embryo development
177
In this study, embryos were exposed to a range of bromoform (BMF), tribromoacetic acid (TBAA)
178
and tribromophenol (TBP) concentrations for 48 h (Table 1), from fertilization to the Pluteus stage.
179
The control with 0.1% DMSO was not toxic for larvae, and we found typical dose-response curves,
180
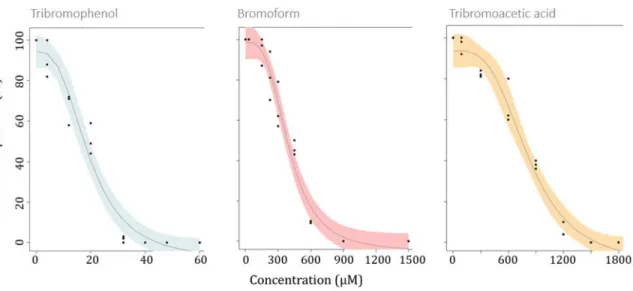
from which EC50 and EC90 were extrapolated (Figure 1 and Table 2).
181
182
Figure 1: Effect of tribromophenol, bromoform and tribromoacetic acid singly, on the percentage 183
of normal pluteus growth after 48h 184
185
TBP (halophenol) was by far the more toxic molecule compared to BMF (halomethane) and TBAA
186
(haloacetic acid) (Table 2). BMF was found more toxic than TBAA. This order of toxicity has regularly
187
been reported in several aquatic organisms living in fresh or marine water (Yoshioka et al. 1985;
188
Yang and Zhang 2013; Liu and Zhang 2014; Teixidó et al. 2015; Hanigan et al. 2017).
189
Table 1: Different endpoints (µM) for three DBPs, tribromophenol, bromoform and tribromoacetic 190
acid obtain on pluteus larva after 48 hours of exposure 191
Like other aquatic organisms (Yoshioka et al. 1985; Delacroix et al. 2013; Liu and Zhang 2014;
193
Teixidó et al. 2015; Hanigan et al. 2017), P. lividus embryos were sensitive to relatively high
194
concentrations of the tested molecules. The EC50 was 14.5 µM for TBP, 526.31 µM for BMF and
195
923.5 µM for TBAA, and the lowest LOEC was 3 µM withTBP (Table 2). Except for bromoform, P.
196
lividus appears to be more sensitive to TBP and TBAA, than the embryos of the marine polychaete,
197
Platynereis dumerilii (Yang and Zhang 2013), or the phytoplanktonic green algae, Tetraselmis
198
marina (Liu and Zhang 2014). Indeed, according to the three previous studies, the EC50 for
199
bromoformin P.lividus is situated between the EC50 in zebrafish (200 µM (Teixidó et al. 2015)) and
200
the EC50 inpolychaete embryos (730 µM (Yang and Zhang 2013)). With regard to TBP and TBAA,
201
our model seems 4 to 14 times more sensitive to TBP and 4 to 6 times more sensitive to TBAA,
202
when compared with other, different, biological systems (Yang and Zhang 2013; Liu and Zhang
203
2014; Teixidó et al. 2015).
204
The first observable effect (LOEC) of the three chemicals in our model was the abnormal
205
development of a fraction of Plutei. At higher concentrations, we observed both abnormal and
206
delayed development, mostly between the morula and gastrula stages, although in different
207
relative proportion, depending upon the molecule and the concentration. Of the developmental
208
anomalies triggered by all three chemicals, we mainly observed crossed spicules, which are among
209
the most regularly reported malformations in sea urchin larvae (Gharred et al. 2016). Interestingly,
210
TBAA-induced mortality was detected early, since we observed a black-coloured dead eggs
211
(unpublished data).
212
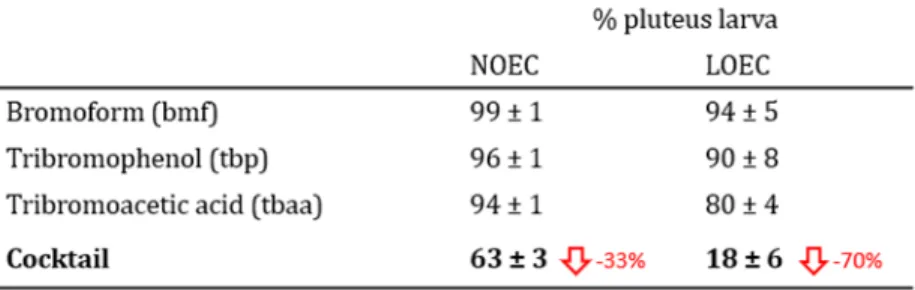
Table 2: Percentage of normal pluteus larva growth when exposed to NOEC and LOEC of 213
bromoform, tribromophenol and tribromoacetic acid singly and combined 214
215
Exposure for 48h to mix NOECs and mix LOECs critically reduced the proportion of normal Pluteus,
216
to 63% ± 2 and 18% ±1, respectively, while none survived exposure to mix EC50 condition,
217
demonstrating the combined effect of these chemicals (Table 2). The results obtained with a
mixture of chemicals were entirely expected. However, in zebrafish embryos, the influence of
219
chlorinated water had no detectable phenotypic impact after 5 days of exposure, suggesting that
220
a complex water environment, containing a wide diversity of DBPs at much lower concentrations
221
than those tested, may not be deleterious for the population (Hanigan et al. 2017). Nevertheless,
222
chronic exposure of adult fish to 0.9 nM of TBP could potentiallyhave a significant effect over a
223
number of generations, on survival, larval development and the malformation rate (Deng et al.
224
2010).
225
Table 2: Percentage of normal pluteus larva growth when exposed to NOEC and LOEC of 226
bromoform, tribromophenol and tribromoacetic acid singly and combined 227
228 229
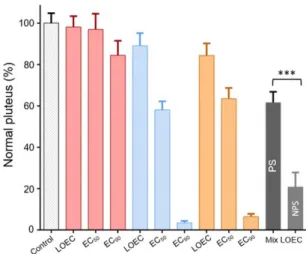
We further tested the impact of embryo exposure at polluted site (PS), with embryos generated
230
by P. lividus adults chronically exposed to chlorinated sea water. These PS embryos were exposed
231
to TBP, BMF and TBAA at their respective LOEC, EC50 and EC90, and to mix LOECs condition. They
232
were found slighly less sensitive to TBP and TBAA than NPS embryos, while very resistant to BMF,
233
which is the most prevalent molecule found in seawater where genitors were harvested (Figure 2)
234
(Manasfi et al. 2018). Moreover, exposure to mix LOECs reduced the proportion of normal Pluteus
235
by 40% instead of 80% for the NPS embryos. This increased PS embryo resistance could be
236
explained by either natural selection of larva, with higher fitness for the polluted site, or a parental
237
effect (Ross et al., 2016).
239
Figure 2: Effect of bromoform (pink), tribromophenol (blue), tribromoacetic acid (orange), singly 240
and in combination (grey), on the percentage of normal pluteus larva growth from a polluted site, 241
after 48h of exposure. *** represent statistically significant differences at p < 0.05 from Dunnet’s 242
test, between the combine molecules toxicity on larva from a non-polluted site and from a DBPs 243
polluted site. 244
245
Evaluation of mixtures’ genotoxicity
246
The alkaline comet assay has been widely used to test potential genotoxic effects of environmental
247
pollutants, in several model organisms such as animal embryos and plant roots, as it is an efficient
248
method for detecting single- and double-strand DNA breaks (Yıldız et al. 2009; Liman et al. 2011).
249
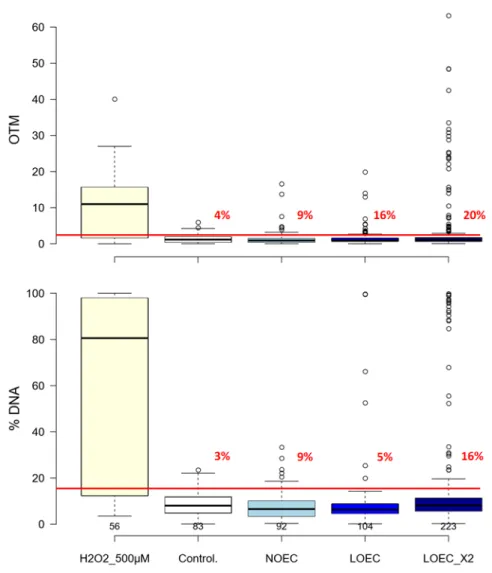
The results obtained from the comet assay are summarized in Figure 3.
251
Figure 3: Distribution of OTM (A) and % of DNA within the comet tail (B) according to the level of 252
exposure of Pluteus larvae to the chemicals’ mixture. Boxplots encompass the 1st and the 3rd 253
quartile. The black line within the boxplot represents the median. Tukey’s whisker extents are 254
presented (defined as 1.5 times the 1st and 3rd quartiles). The red horizontal line indicates the 255
95% percentile of the control condition used as a reference, and the numbers in red indicate the 256
proportion of comets presenting a higher value than the reference 257
258
Here we tested whether 1h exposure to mixtures of TBP, BMF and TBAA, at their respective NOEC,
259
LOEC and twice their LOEC concentrations, could induce DNA strand breakages in Pluteus larvae.
260
It is likely that given the short-term exposures to the mixtures, we observed the obvious potential
261
of our mixtures to induce DNA strand breakages, prior to any activation of DNA repair mechanisms
262
that would counteract the induced DNA damage. The level of genotoxicity was assessed in positive
263
and negative controls and exposed groups according to the OTM and the percentage of DNA
(%DNA) measured in the comet tail. Furthermore, we only assessed the proportion of cells within
265
each group that exceeded a threshold value, corresponding to the 95th percentile of the control
266
group for the OTM and %DNA. Under controlled conditions, the 95th percentile for OTM and %DNA
267
were 2.6 and 16.5%, respectively.
268
For the two parameters considered, we found normal data distributions within the negative
269
control groups Wilk, p=0.1) but not in the tested groups or in the positive control
(Shapiro-270
Wilk, p<0.0001). The non-parametric test did not reveal any influence of exposure level based on
271
the OTM but demonstrated that the group exposed to the mixture at twice the LOEC concentration
272
(mix LOEC_ X 2), had significantly more DNA within the comet tail, compared to all other groups
273
(Kruskal-Wallis, p<0.033). This result would suggest that this last condition only had a genotoxic
274
effect. However, the discrepancy in the results between controls and tested groups for normality
275
of data distribution indicates exposure had an influence on a fraction of the whole cells within each
276
group, as previously reported (Taban et al. 2004). Indeed, the proportion of cells with an OTM
277
higher than 2.6 regularly increases with the concentration and gives higher OTM values than
278
observed in the negative control group (Figure 3, A). This increase of the proportion of cells has
279
also been observed for the %DNA parameter, although it is clearly noticeable at the mix LOEC_X2
280
condition (Figure 3, B). Hence, overall, our results suggest a dose response when taking into
281
consideration both the effect on DNA and the occurrence of responding cells. Similar results have
282
already been reported in short-term exposure experiments, such as those performed on CHO
283
(Chinese hamster ovary) cells exposed to TBA for 4h (Plewa et al. 2008) and occurrence (Taban et
284
al. 2004).
285
It is interesting to note that at the mix LOEC_X2 condition, we found that 7% of the cells were
286
distributed with more than 90 % of their DNA within the comet tail. Among these, a few cells also
287
displayed a high OTM value, which relates to the length of the comet. A similar result was obtained
288
with some cells from the positive control group (Figure 3, B). This could be indicative of ongoing
289
apoptosis (Rı ́os et al. 2003; Collins et al., 2004). Evidence for this has already been demonstrated
290
in other studies. It has been shown that hydrogen peroxide can induce apoptosis, causing cell death
291
in less than 2 h in 293T cells exposed to more than 400 µM of H2O2 (Xiang et al. 2016). A recent
292
study has also suggested that halogenated DBPs might trigger apoptosis at high concentration (Rı ́os
et al. 2003; Collins, 2004). Thus, in our study, the mixtures might have the potential to also trigger
294
apoptosis in a fraction of the larval cells.
295
This distribution pattern is difficult to explain at this stage, and it would be interesting to assess
296
whether a certain cell type would be more sensitive to mixtures than others, or if the external cells
297
are more impacted than those embedded within the larval body, for instance. This has already
298
been reported in zebrafish exposed for a much longer time (i.e. 72 h) to BMF (Teixidó et al. 2015).
299
Finally, we have highlighted with our experimental conditions that a significant genotoxic effect,
300
observed with high doses of a cocktail of DBPs, are generally consistent with previous findings
301
(Teixidó et al. 2015; Hanigan et al. 2017).
302 303
Conclusion
304
This study has furthered our knowledge of the impact of bromoform, tribromophenol and
305
tribromoacetic acid, tested alone and in combination, on sea urchin, Paracentrotus lividus,
306
development. We have revealed that all three molecules could impair embryo development with
307
the order of toxicity TBP>BMF>TBAA. TBP is 10 to 30 times more toxic compared to the two others
308
molecules. The mixture of the three DBPs also significantly impaired development and were proved
309
weakly genotoxic at low doses (i.e. mix NOECs). Increasing the concentration of the mixture to mix
310
LOECs significantly increases cytotoxicity, as well as increasing the level of DNA damage and the
311
proportion of cells affected.
312
In this study, we have highlighted a potential genome by environment interaction, particularly
313
regarding BMF. Further experiments will be required in order to assess the relative influence of a
314
potential parental effect, as well as local genetic adaptation in the observed resistance.
315 316
Acknowledgment
317
This work was co-funded by the French National Research Agency (ANR) within the project
FOS-318
SEA (ANR-16-CE34-0009) and by Conseil regional Provence Alpes Côte d’Azur (Reginal Council
319 SUD). 320 321 References 322
Allonier, A.-S. et al. 1999. Determination of dihaloacetonitriles and halophenols in chlorinated sea
323
water. Talanta
324
Bellas, J. et al. 2008. Integrative assessment of coastal pollution in a Ría coastal system (Galicia,
325
NW Spain): Correspondence between sediment chemistry and toxicity. Chemosphere 72(5), pp.
326
826–835. doi: 10.1016/j.chemosphere.2008.02.039.
327
Boudjellaba, D. et al. 2016. Chlorination by-product concentration levels in seawater and fish of an
328
industrialised bay (Gulf of Fos, France) exposed to multiple chlorinated effluents. Science of The
329
Total Environment 541, pp. 391–399. doi: 10.1016/j.scitotenv.2015.09.046.
330
CAREX Canada 2009. Les sous-produits de chloration. School of Environmental Health University of
331
British Columbia. Available at: https://www.carexcanada.ca/fr/chloration.pdf [Accessed: 12
332
December 2018].
333
Delacroix, S. et al. 2013. Disinfection by-products and ecotoxicity of ballast water after oxidative
334
treatment – Results and experiences from seven years of full-scale testing of ballast water
335
management systems. Marine Pollution Bulletin 73(1), pp. 24–36. doi:
336
10.1016/j.marpolbul.2013.06.014.
337
Deng, J. et al. 2010. Chronic exposure to environmental levels of tribromophenol impairs zebrafish
338
reproduction. Toxicology and Applied Pharmacology 243(1), pp. 87–95. doi:
339
10.1016/j.taap.2009.11.016.
340
Gharred, T. et al. 2016. Assessment of the individual and mixture toxicity of cadmium, copper and
341
oxytetracycline, on the embryo-larval development of the sea urchin Paracentrotus lividus.
342
Environmental Science and Pollution Research 23(18), pp. 18064–18072. doi:
10.1007/s11356-016-343
6988-3.
344
Gyori, B.M. et al. 2014. OpenComet: An automated tool for comet assay image analysis. Redox
345
Biology 2, pp. 457–465. doi: 10.1016/j.redox.2013.12.020.
346
Halpern, B. et al. 2008. A Global Map of Human Impact on Marine Ecosystems. Science 319, pp.
347
948–952. doi: 10.1126/science.1149345.
348
Hanigan, D. et al. 2017. Zebrafish embryo toxicity of 15 chlorinated, brominated, and iodinated
349
disinfection by-products. Journal of Environmental Sciences 58, pp. 302–310. doi:
350
10.1016/j.jes.2017.05.008.
Liman, R. et al. 2011. Determination of genotoxicity of Fenaminosulf by Allium and Comet tests.
352
Pesticide Biochemistry and Physiology 99(1), pp. 61–64. doi: 10.1016/j.pestbp.2010.10.006.
353
Liu, J. and Zhang, X. 2014. Comparative toxicity of new halophenolic DBPs in chlorinated saline
354
wastewater effluents against a marine alga: Halophenolic DBPs are generally more toxic than
355
haloaliphatic ones. Water Research 65, pp. 64–72. doi: 10.1016/j.watres.2014.07.024.
356
Manasfi, T. et al. 2017. Assessing the genotoxicity of two commonly occurring byproducts of water
357
disinfection: Chloral hydrate and bromal hydrate. Mutation Research/Genetic Toxicology and
358
Environmental Mutagenesis 813, pp. 37–44. doi: 10.1016/j.mrgentox.2016.11.009.
359
Manasfi, T. et al. 2018. Characterization of chlorination byproducts in marine waters and sediments
360
in a semi-enclosed bay exposed to multiple industrial chlorinated effluents.
361
Mouly, D. et al. 2009. Les sous-produits de chloration dans l’eau destinée à la consommation
362
humaine en France., p. 76.
363
Nahon, S. et al. 2008. Improved Comet assay for the assessment of UV genotoxicity in
364
Mediterranean sea urchin eggs. Environmental and Molecular Mutagenesis 49(5), pp. 351–359.
365
doi: 10.1002/em.20391.
366
Plewa, M.J. et al. 2008. Comparative Mammalian Cell Toxicity of N-DBPs and C-DBPs. In: Karanfil,
367
T. et al. eds. Disinfection By-Products in Drinking Water. Washington, DC: American Chemical
368
Society, pp. 36–50. Available at: http://pubs.acs.org/doi/abs/10.1021/bk-2008-0995.ch003
369
[Accessed: 7 June 2018].
370
Richardson, S. et al. 2007. Occurrence, genotoxicity, and carcinogenicity of regulated and emerging
371
disinfection by-products in drinking water: A review and roadmap for research. Mutation
372
Research/Reviews in Mutation Research 636(1–3), pp. 178–242. doi:
373
10.1016/j.mrrev.2007.09.001.
374
Richardson, S.D. et al. 2010. What’s in the Pool? A Comprehensive Identification of Disinfection
By-375
products and Assessment of Mutagenicity of Chlorinated and Brominated Swimming Pool Water.
376
Environmental Health Perspectives 118(11), pp. 1523–1530. doi: 10.1289/ehp.1001965.
377
Rı ́os, J.C. et al. 2003. Tribromophenol induces the differentiation of SH-SY5Y human neuroblastoma
378
cells in vitro. Toxicology in Vitro 17(5–6), pp. 635–641. doi: 10.1016/S0887-2333(03)00110-3.
379
Singer, P.. 1999. Humic substances as precursors for potentially harmful disinfection by-products.
380
Water Science and Technology 40(9). Available at: http://wst.iwaponline.com/content/40/9/25
381
[Accessed: 6 June 2018].
382
Some drinking-water disinfectants and contaminants, including arsenic. 2004. Lyon: IARC.
Taban, I.C. et al. 2004. Detection of DNA damage in mussels and sea urchins exposed to crude oil
384
using comet assay. Marine Environmental Research 58(2), pp. 701–705. doi:
385
10.1016/j.marenvres.2004.03.018.
386
Teixidó, E. et al. 2015. Developmental effects and genotoxicity of 10 water disinfection by-products
387
in zebrafish. Journal of Water and Health 13(1), pp. 54–66. doi: 10.2166/wh.2014.006.
388
Tice, R.R. et al. 2000. Single cell gel/comet assay: Guidelines for in vitro and in vivo genetic
389
toxicology testing. Environmental and Molecular Mutagenesis 35(3), pp. 206–221. doi:
390
10.1002/(SICI)1098-2280(2000)35:3<206::AID-EM8>3.0.CO;2-J.
391
Tu, Q. et al. 2006. Sea urchin Forkhead gene family: Phylogeny and embryonic expression.
392
Developmental Biology 300(1), pp. 49–62. doi: 10.1016/j.ydbio.2006.09.031.
393
Villanueva, C.M. et al. 2004. Disinfection Byproducts and Bladder Cancer: A Pooled Analysis.
394
Epidemiology 15(3), pp. 357–367.
395
Villanueva, C.M. et al. 2006. Bladder Cancer and Exposure to Water Disinfection By-Products
396
through Ingestion, Bathing, Showering, and Swimming in Pools. American Journal of Epidemiology
397
165(2), pp. 148–156. doi: 10.1093/aje/kwj364.
398
Westerhoff, P. et al. 2004. Reactivity of natural organic matter with aqueous chlorine and bromine.
399
Water Research 38(6), pp. 1502–1513. doi: 10.1016/j.watres.2003.12.014.
400
Xiang, J. et al. 2016. Is Hydrogen Peroxide a Suitable Apoptosis Inducer for All Cell Types? BioMed
401
Research International 2016, pp. 1–6. doi: 10.1155/2016/7343965.
402
Yang, M. and Zhang, X. 2013. Comparative Developmental Toxicity of New Aromatic Halogenated
403
DBPs in a Chlorinated Saline Sewage Effluent to the Marine Polychaete Platynereis dumerilii.
404
Environmental Science & Technology 47(19), pp. 10868–10876. doi: 10.1021/es401841t.
405
Yıldız, M. et al. 2009. Determination of genotoxic effects of copper sulphate and cobalt chloride in
406
Allium cepa root cells by chromosome aberration and comet assays. Chemosphere 75(7), pp. 934–
407
938. doi: 10.1016/j.chemosphere.2009.01.023.
408
Yoshioka, Y. et al. 1985. Testing for the toxicity of chemicals with Tetrahymena pyriformis. Science
409
of The Total Environment 43(1–2), pp. 149–157. doi: 10.1016/0048-9697(85)90037-3.
410 411