HAL Id: hal-02961359
https://hal.archives-ouvertes.fr/hal-02961359
Submitted on 4 Jan 2021
HAL is a multi-disciplinary open access archive for the deposit and dissemination of sci-entific research documents, whether they are pub-lished or not. The documents may come from teaching and research institutions in France or abroad, or from public or private research centers.
L’archive ouverte pluridisciplinaire HAL, est destinée au dépôt et à la diffusion de documents scientifiques de niveau recherche, publiés ou non, émanant des établissements d’enseignement et de recherche français ou étrangers, des laboratoires publics ou privés.
archipelago, South Pacific
E. Martinez, M. Rodier, M. Pagano, R. Sauzède
To cite this version:
E. Martinez, M. Rodier, M. Pagano, R. Sauzède. Plankton spatial variability within the Mar-quesas archipelago, South Pacific. Journal of Marine Systems, Elsevier, 2020, 212, pp.103432. �10.1016/j.jmarsys.2020.103432�. �hal-02961359�
Plankton spatial variability within the Marquesas archipelago, South Pacific
E. Martinez, M. Rodier, M. Pagano, R. Sauzède
PII: S0924-7963(20)30128-7
DOI: https://doi.org/10.1016/j.jmarsys.2020.103432
Reference: MARSYS 103432
To appear in: Journal of Marine Systems
Received date: 5 December 2019
Revised date: 23 July 2020
Accepted date: 18 August 2020
Please cite this article as: E. Martinez, M. Rodier, M. Pagano, et al., Plankton spatial variability within the Marquesas archipelago, South Pacific, Journal of Marine Systems (2018),https://doi.org/10.1016/j.jmarsys.2020.103432
This is a PDF file of an article that has undergone enhancements after acceptance, such as the addition of a cover page and metadata, and formatting for readability, but it is not yet the definitive version of record. This version will undergo additional copyediting, typesetting and review before it is published in its final form, but we are providing this version to give early visibility of the article. Please note that, during the production process, errors may be discovered which could affect the content, and all legal disclaimers that apply to the journal pertain.
Plankton
spatial
variability
within
the
Marquesas archipelago, South Pacific
E. Martinez1c,2,*, M. Rodier3c,2, M. Pagano3, R. Sauzède4,2
1 Institut de Recherche pour le Développement (IRD), University of Bretagne Occidentale (UBO),
Centre National de la Recherche Scientifique (CNRS), Ifremer, Laboratoire d’Océanographie Physique et Spatiale (LOPS), IUEM, Brest 29280, France
2 IRD, University of French Polynesia (UPF), Institut Louis Malardé (ILM), Ifremer, Écosystèmes
Insulaires Océaniens (EIO), Tahiti, French Polynesia
3 ix arsei e niversité, niversité de ou on, , I , editerranean Institute of
Oceanography (MIO) 13288, Marseille, France
4
Sorbonne Université, CNRS-INSU, Institut de la Mer de Villefranche, 06230 Villefranche-Sur-Mer, France
C Current affiliation
* Corresponding author: [email protected], Phone: +33 (0) 290915586, Fax: +33.(0).2.90.91.55.45
ABSTRACT
The Marquesas Islands, in the central South Pacific, are a place of an outstanding phytoplankton enrichment visible from space and is a hotspot of endemism and biodiversity; however, it has been poorly studied. In situ physical-chemical-biological concomitant observations are almost non-existent and all located close to the main northern island, while ocean dynamics based on satellite observations and numerical modeling show contrasting north/south patterns within the archipelago. Thus, we took the opportunity of the Pakahi I te Moana cruise conducted in 2012 to collect hydrological and plankton
samples and investigate biogeochemical spatial patterns, especially north/south, over the archipelago. These data provide the first description of the spatial and vertical distribution of physical, chemical and plankton characteristics over the entire Marquesas archipelago, and gave a first hint to improve our understanding of this planktonic enrichment. The whole archipelago appeared to be a macronutrient-rich environment. Different patterns in the physical, chemical and biological vertical distributions were observed between the northern vs. southern part of the archipelago, and offshore vs. nearshore stations. Phytoplankton biomasses were higher in the north where stratification was weaker, compared to the south and higher close to the islands than offshore. Phytoplankton all over the archipelago was largely dominated by picophytoplankton; specifically,
Prochlorococcus presented a more widespread distribution than previously thought and
were present over a large range of nutrient concentrations. Copepods were always the most abundant taxa in the archipelago but showed higher mean relative abundances near the islands. The importance of suspension-feeding zooplankton in the northern islands coincided with the highest biomasses of phytoplankton with a predominance of nano- and micro-phytoplankton. This was consistent with a young community responding to nutrient enrichment by an increase of suspension-feeders animals and bottom-up effect on zooplankton. Opposite to this, small copepods were significantly less abundant in the northern offshore region and the dominance of carnivorous forms coincided with low phytoplankton biomass and strong dominance of picoplankton, suggesting a microbial grazing pathway and more mature communities.
Keywords: Island mass effect, Marquesas Islands, South Pacific, oceanographic cruise, plankton distribution
1 Introduction
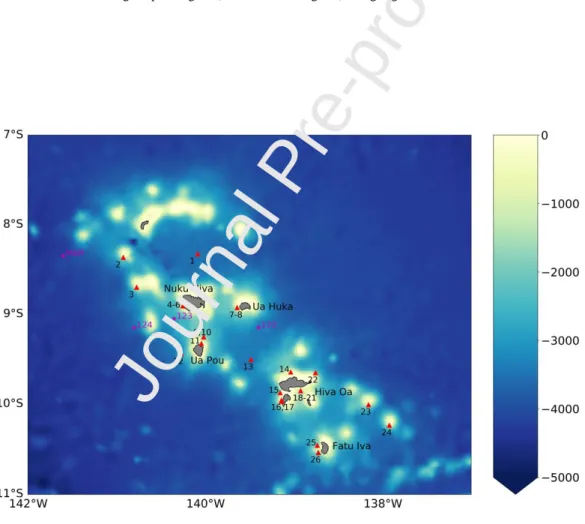
The Marquesas Islands are located in the northeast of French Polynesia, central South Pacific (218°–222°E/8°–11°S; Fig. 1). The archipelago and its dozen of 10 to 25 km wide islands extend over about 350 km from north to south and rises steeply from the abyssal plain at 4000 m. Deep channels between the islands (40 to 100 km wide) divert the southwestward South Equatorial Current (SEC) (Martinez et al. 2009; Raapoto et al. 2018; 2019). The Marquesas Islands are a place of an outstanding phytoplanktonic/biological enhancement, referred to as an island mass effect (IME, Doty and Ogury 1956). This IME is remarkable in many ways. Surface observations of chlorophyll-a concentration (Chla, a proxy of phytoplankton biomass) derived from satellite radiometric observations is higher than 0.2 mg m-3 in the vicinity of the islands throughout the year (Fig. 1) except during El Niño events (Martinez and Maamaatuaiahutapu 2004). Downstream of the islands, the wake can extend up to 600 km (see Plate 4 from Signorini et al. 1999), a huge length scale compared to the radius of the islands. The archipelago is remote and isolated in the central South Pacific and most of the islands are inhabited by only 10,000 inhabitants living on the five main islands. Thus, observations of plankton pattern are expected to be free from anthropogenic impact. A very high endemism level of oceanic species (close to 20%, as found in the Hawaiian archipelago and in the Red Sea) has recently been reported (Galzin et al. 2016). Finally, this is a hotspot for pelagic fisheries which are the main protein resources for French Polynesia inhabitants and a source of income for the country.
Nonetheless, the Marquesas have been poorly studied so far. Part of the studies focusing on this IME are based on satellite observations which allowed characterizing the Chla time variability as well as some physical mechanisms at the regional scale. Chla seasonal variability was observed and correlated with an intensification of the surface currents from 1997 to 2002 (Martinez and Maamaatuaiahutapu, 2004), while a decrease in productivity occurred during the 1997-1998 El Niño event and inversely during La Niña
1998-1999 (Signorini et al. 1999). Advection of upwelled cooler water from the iron-rich Equatorial Under Current toward the Marquesas during La Niña 1998-1999 has been hypothesized (Legeckis et al. 2004), then revisited and mitigated (Martinez et al. 2018). More recently, north/south contrasting patterns on ocean dynamics have been reported based on satellite observations and numerical modeling. A more intense activity, likely related to mesoscale processes, occur in the southern part of the archipelago (Martinez et al. 2018), while surface currents are weaker than in the north (Martinez et al., 2009; Raapoto et al. 2018; 2019).
Few in situ biogeochemical data are currently available around the Marquesas islands and most of them come from two oceanographic cruises where efforts were concentrated nearby Nuku Hiva, the main island in the northern region of the archipelago. First, the Biogeochemistry and Optics South Pacific Experiment (BIOSOPE) cruise conducted at the end of October 2004 (see Special Issue in Biogeosciences 2008) covered a large range of biogeochemical and optical measurements at only three very close stations north-west offshore of Nuku Hiva (hereafter, referred as Station MAR, see Fig. 2). Significant amounts of nitrate associated with the high-nutrient low-chlorophyll (HNLC) waters of the equatorial upwelling region (Fig. 1; Claustre et al. 2008 and references therein; Raimbault et al. 2008), and micronutrient-poor (iron-depleted) waters were
reported (Blain et al. 2008). A nanophytoplankton community predominance was observed (Ras et al. 2008) and zooplankton was barely documented. Second, the
adaptation and acclimation to iron in different groups of phytoplankton were observed during the Tara Oceans expedition in July to August 2011, at four stations also located around Nuku Hiva (see stations 122 to 124 in Fig. 2) (Caputi et al. 2019).
A biogeochemical north/south contrasting patterns or the overall spatial variability in the Marquesas could not be described with previously available in situ data. In February 2012, the Pakaihi I te Moana (“respect of the ocean” in arquesan) cruise took place in
the archipelago with the aim to explore the flora and fauna biodiversity within the framework of its inscription as a Marine Protected Area. Although this cruise (and consequently the sampling strategy) was not dedicated to physical or biogeochemical oceanography, we took this opportunity to collect hydrological and plankton samples all around the archipelago. The objective here was to investigate if some spatial patterns over the archipelago, especially north/south, could also imprint the biogeochemical properties. We also aimed to provide the first description of the spatial and vertical distribution of physical, chemical and plankton characteristics over the whole archipelago, and thus the first hint to improve our understanding of the Marquesan IME.
2 Material and methods
2.1 Field survey and sampling processing
The Pakaihi I te Moana cruise (hereafter referred to as PM-12) was conducted onboard a fishing vessel through the archipelago from February 2 to February 22, 2012 (Table 1). Vertical profiles of temperature, salinity, pressure and fluorescence-derived Chla were obtained at 25 stations (Fig. 2) from casts of a SBE 19 Seabird CTD equipped with a WET Labs ECO-AFL fluorometer. The use of a fishing vessel without its own scientific equipment limited the number and depth of samples. Profiles were performed down to100 m (i.e., the maximum depth allowed by the CTD) on a 0.25 m vertical resolution. Water samples were collected with a Niskin bottle at five depths (5, 30, 40, 60, and 100 m) for nutrients and phytoplankton analyses. Vertical net hauls were performed at all stations for zooplankton biomass and taxonomy and, at only three stations for microphytoplankton microscopy.
In this study, distinctions were made between the northern and the southern regions, and between offshore stations and coastal stations. Stations (St.) 1–3 and 23–24 were referred to as the northern and southern offshore stations (NOff and SOff), respectively. St.
4–12 and 14–22, 25, 26 were referred to as the northern and southern island stations (NIsl
and SIsl), respectively. St. 13 was not associated with any specific acronym as it lies
offshore right in the middle, between the north and the south of the archipelago.
2.1.1 Nutrients
Ammonium (NH4+) was analyzed immediately after sampling by fluorometry using a
Turner trilogy fluorometer (module # 7200-041) as described in Holmes et al (1999). Nitrate (N) and nitrite (Nox), phosphate (PO4) and silicic acid Si(OH)4 (hereafter referred
to as silicates-Si) were analyzed after the cruise on HgCl2-poisoned samples with an
Auto-analyzer AA3 (SEAL Analytical) following the standard colorimetric methods (Aminot and
Kérouel 2007).
2.1.2 Chlorophyll a (total and size fractionated) extraction and analysis
Chla were determined by fluorometry after methanol extraction (Le Bouteiller et al. 1992). Analyses were performed with a Trilogy fluorometer equipped with the Chla extracted-acidification module (# 7200-040) and calibrated with pure Chla standard (Sigma). Total Chla was determined from 0.5 L water samples filtered onto GF/F Whatman filters. Size-fractioned Chla >3µm and >10 µm were determined from 1 L water samples collected onto 3 µm and 10 µm nucleopore membranes, respectively. Size-fractioned Chla <3 µm, between 3 µm and 10 µm, and >10 µm were considered here as proxies of pico-, nano- and micro-phytoplankton biomass respectively. All analyses were performed post-cruise on frozen samples (-80°C).
2.1.3 Pico- and nanophytoplankton analyses by flow cytometry (FCM)
Water samples of 1.2 mL were fixed by adding paraformaldehyde solution (2% final concentration), immediately frozen and stored in liquid nitrogen. Cell counts for pico- and nanophytoplankton were performed with a FACSCalibur flow cytometer (BD Biosciences,
San Jose, CA, USA) at the PRECYM flow cytometry platform at the Mediterranean Institute of Oceanography (MIO, Marseille, France). Data were normalized using both Fluoresbrite® Fluorescent Microspheres (Polysciences Inc. Europe) and TruCountTM beads (BD). More details are given in Van Wambeke et al. (2016).
2.1.4 Microphytoplankton taxonomy
At three stations (St. 3, 5 and 16), samples were collected with a 20 µm mesh size net and vertical hauls from 100 m to the surface, and fixed with a formalin solution (4% final concentration). Counting and identification were carried out using a Nikon Eclipse TE2000-E inverted microscope. Sedimented volume was 50 mL or less, depending on the densities of organisms as well as the presence of detritus. Phytoplankton were identified to the lowest possible taxon.
2.1.5 Mesozooplankton biomass and taxonomy
Zooplankton were collected using a 200 µm mesh-size WP2 net, mostly during the day; sampling during both day and night was performed only at two sites: Nuku Hiva (St. 5 vs. 6) and Ua Huka (St. 7 vs. 8). At each station, two successive vertical hauls were made down to 150 m and 300 m for vertical distribution. Samples were immediately preserved in a 5 % buffered formalin solution. The relative biomass in each sampled layer 0–150 m and 0–300 m was first estimated by the "sedimented volume" technique. For the 0–300 m tow, each sample was then divided into two equal sub-samples. One half-split was used for a dry weight (DW) measurements after desiccation 48h at 60 °C (Lovegrove 1966) and the second half was used for abundance determination and natural isotopes (Hunt et al. 2013). For the 0–150 m tow, taxa identification and enumeration were made on subsamples of the total sample, and the biomass (DW) was estimated from the ratio 0–150 m/0–300 m of sedimented volumes. Zooplankton taxa were identified, using appropriate keys mainly from Tregouboff and Rose (1957), Razouls et al. (2005-2020) and Conway et al. (2003).
2.1.6 Biogeochemical Argo floats
A BioGeoChemical-Argo (BGC-Argo) profiling float (Claustre et al. 2020) was deployed in the wake of Nuku Hiva during the Tara Oceans survey on August 2, 2011. This float collected more than 150 concomitant hydrological and biogeochemical profiles till it stopped communicating in December 2012, approximately 400 km south of the Marquesas Islands. Among its equipment, the float was equipped with a Sea-Bird Electronics SBE41CP CTD and a WET Labs Environmental Characterization Optics triplet puck composed of a Chla fluorometer.
The CTD data were processed following the standard Argo quality control (Wong et al. 2020). The mixed layer depth (MLD) was defined as the depth at which the potential density differs from that at 10 m depth by 0.03 kg m-3(de Boyer Montegut et al. 2004). Each profile of fluorescence was converted into Chla following the standard BGC-Argo protocol (Schmechtig et al. 2014). The daytime non-photochemical quenching issue occurring at high irradiance was here corrected using the method developed by Xing et al. (2012). Additionally, the global bias correction recommended by Roesler et al. (2016) was applied to each profile.
2.2 Satellite observations
To provide a synoptic view of the physical and biological environment within the Marquesas archipelago during PM-12, we considered sea surface temperature (SST), sea surface salinity (SSS) and ocean color derived Chla in February 2012.
The Group for High-Resolution Sea Surface Temperature (GHRSST) Multi-scale Ultra-high Resolution (MUR) SST data were downloaded from the NASA EOSDIS Physical Oceanography Distributed Active Archive Center (PODAAC) at the Jet Propulsion Laboratory, Pasadena, CA (http://dx.doi.org/10.5067/GHGMR-4FJ01). Daily data were extracted on a 1/20° spatial resolution grid.
Sea surface salinity (SSS) was obtained from the Soil Moisture and Ocean Salinity (SMOS) satellite mission. Data were extracted from the 9-day objective analyzed product and on a rectangular grid of 0.25° resolution from the Barcelona Expert Center (www.smos-bec.icm.csic.es), a joint initiative of the Spanish Research Council (CSIC) and the Technical University of Catalonia (UPC), mainly funded by the Spanish National Program on Space.
Daily ocean color data were extracted from the GSM-GlobColour product (Fanton d'Andon et al. 2009; Maritorena et al. 2010). This product is based on a model-based merging approach of four satellite data sources. It produces a coherent Chla product with enhanced global daily coverage and lower uncertainties in the retrieved variables compared to each of the original data source (Maritorena and Siegel 2005). The 4-km horizontal grid product well illustrates the Chla activity around the small Marquesan islands.
2.3 Statistical analyses
Links between plankton and their physical and biogeochemical environment were investigated through one-way ANOVA and associated post-hoc tests. The spatial variability of the zooplankton community compositions in relation to their potential habitats, was investigated through a factorial correspondence analysis (FCA) performed on the percentages of the abundance of zooplankton taxonomic groups, and a principal component analysis (PCA) performed on the environmental variables (temperature, salinity, nutrient concentrations, Chla, and phytoplankton assemblages) using the ADE4 software (Thioulouse et al. 1997). These two data set were transformed (log x+1) to tend towards a normal distribution prior to performing the analyses. Then, FCA and PCA results were associated through a co-inertia analysis (Doledec and Chessel 1994).
To better understand changes in the zooplankton community structure, rank frequency diagrams (RFDs) were constructed by plotting the ranks of all identified species
on the x-axis (in decreasing order of frequency) against their logarithmic frequency value on the y-axis (Frontier 1976).
3 Results
3.1 Environmental characteristics of the Marquesan archipelago
Satellite observations provided a synoptic view of SST, SSS and surface Chla during the PM-12 cruise in February 2012 (austral summer). A time evolution of these three parameters was pointed out between the first week of the cruise when the sampling was dedicated to the northern islands (February 4 to 10, 2012), and the last 10 days (February 12 to 22, 2012) when it was dedicated to the southern islands (Fig. 3).
The archipelago was characterized by SST and SSS latitudinal gradients with colder and fresher waters in the north as the imprint of the equatorial upwelling (Wyrtki 1981). In the south, warmer SST was the south-eastward imprint of the western Pacific warm pool (Yan et al. 1992), while saltier SSS was the surface imprint of the South Pacific Tropical Water (SPTW) advected from the south-east (O’ onnor et a . 2005). This high salinity water mass finds its origin at the sea surface, where evaporation exceeds precipitation from the eastern Polynesian Islands to South America. Consistently, SST was warmer and SSS saltier in the south than in the north during PM-12. This latitudinal gradient of temperature may even have been sharpened by the summer warming of the region during the second part of the cruise (Fig. 3 a, b). Inversely, the freshening as seen on SSS during the second part of the cruise has weakened the north-south salinity gradient. Although some clouds can be seen in the southern region of the archipelago (white pixels in Fig. 3f), almost no rain occurred along the cruise.
Ocean color observations showed a contrasting biological signature between the two periods. A strong surface Chla activity occurred around the islands during the sampling of
the northern region (Fig. 3e). By the time the vessel reached the southern region, Chla activity had weakened over the entire sampling zone (Fig. 3f).
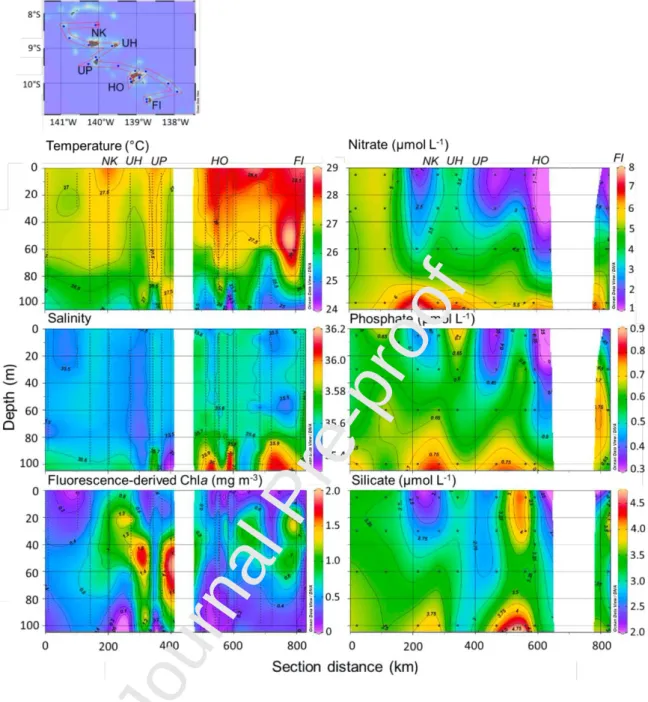
The archipelago latitudinal gradient of temperature and salinity observed by remote-sensing also appeared on the vertical sections of the hydrographic parameters (Fig. 4). Indeed, environmental conditions in the northern region of the archipelago, from Nuku Hiva to Ua Pou islands, were significantly (ANOVA, p <0.001) cooler and fresher with a relatively homogeneous water column down to 100 m than in the south from Hiva Oa to Fatu Iva islands. The tongue of high salinity (>36) deeper than 80 m was the imprint of the highly salted surface core of the SPTW subducted from the south-east. This core became thinner and deeper as it flowed northward through the archipelago. Superimposed onto this general pattern, local particularities were observed, such as a surface warming in the upper 15 m behind Nuku Hiva and Ua Pou islands (km 200 and 380, respectively, in Fig. 4).
Nitrate and phosphate concentrations were quite high all over the Marquesas (>1 and
0.3 mol L-1, respectively, Fig. 4). Significantly higher concentrations and a deeper and homogenous distribution occurred in the north than in the south (ANOVA, p <0.001). This latitudinal contrast, although noticeable, was less pronounced for silicates with surface maxima near the two southernmost stations. Ammonium concentrations reached 0.2 µmol L-1 on average in the 100 m upper layers with subsurface maxima between 60 and 100 m (data not shown). In a broader context, the north-south nutrient decrease reflected the latitudinal gradient from the equatorial mesotrophic area to the subtropical oligotrophic gyre. However, this pattern was disrupted near the islands with superficial enrichments, mainly silicic acid and phosphates, near Hiva Oa and Ua Pou Islands, and conversely, N and PO4 consumption leeward of the Nuku Hiva and Ua Huka Islands. The proximity of
the islands may also change the nutrient limitation. Indeed, the N/Si ratio >1 was reported north of 9° S likely implying a potential Si-limitation for diatom growth (Brzezinski 1985), except close to the Nuku Hiva Island. Such a limitation was not expected in the south,
where the N/Si ratio was <1 in the 0-60 m layer. Anyhow, the N/ PO4 ratio (6.9 ± 2.43)
was largely below the Redfield ratio across the archipelago, disclosing a PO4 excess or N
deficit in the archipelago, which is also a general feature in the South Pacific Ocean down to 250 m excepted in N2 fixation areas (Raimbault et al. 2008).
3.2 Phytoplankton biomass, abundance and composition 3.2.1 Chla distribution
In the northern region, the in vivo Chla distribution appeared to be highly impacted by proximity of islands with surface enrichments leeward of the Nuku Hiva and Ua Huka Islands and strong deep maxima (DCM) between 30-80m with a deepening and intensification of DCM (up to 1.5 mg m-3) around Ua Pou. In the southern region, the Chla distribution around the islands was smoother with shallower DCM (20–40m). At the NOff
and SOff stations the vertical Chla distribution was rather homogeneous following the
thermohaline structure, with no clear DCM. However, two offshore stations were slightly richer, St. 3 in the north and St. 23 in the south, likely due to the proximity of seamounts culminating at 14 m deep below the sea level (Banc Lawson) and 54 m (Guyot Meihano), respectively. Consistently, the 0–100 m integrated Chla (Chla0-100m) were significantly
higher (ANOVA, p-value <0.001) at the NIsl (St. 4–12) with a maximum near the Nuku
Hiva Island compared to the SIsl (St. 14–22, 25–26) (Fig. 5). The more superficial Chla
distribution in the south was confirmed with close values of Chla0-60m and Chla0-100m.
Chla0-100m were also significantly contrasted (ANOVA, p-value <0.001) between NIsl and
NOff where the lowest values were observed.
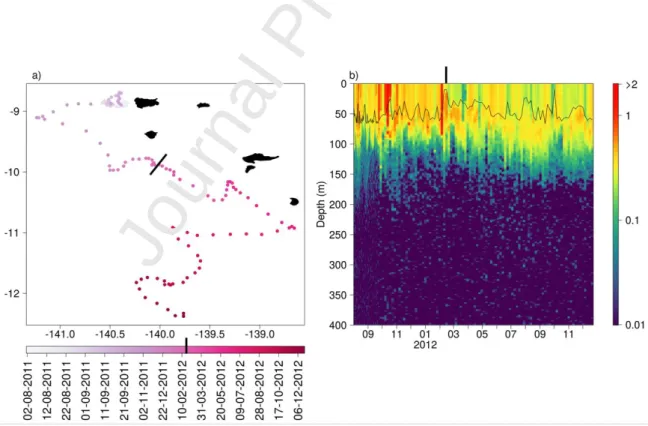
The BGC-Argo float deployed during the Tara Oceans expedition provided a synoptic view of the Chla vertical distribution (Fig. 6). The BGC-Argo float spent approximately 7 months (August 2011 to February 2012) in the northern part of the archipelago and 10 months (March to December 2012) in the southern one. In both
regions, the observed trends remained consistent throughout the months. Chla was on average higher in the north (45.3 ± 17.0 mg m-² Chla0100m) and more homogeneously
distributed within the mixed layer than in the south (Chla0100m = 35.7 ± 5.9 mg m-²) where
a more pronounced DCM-like pattern appeared below the MLD. These observations agreed with the PM-12 north/south observations.
3.2.2 Phytoplankton assemblages
During PM-12, picophytoplankton (size-fractioned Chla <3 µm) dominated the phytoplankton biomass all around the archipelago with 79 ± 6.0% of total Chla, except at the two NIsl, off Nuku Hiva (St. 4) and Ua Huka (St. 7–8) Islands, while
nanophytoplankton only represented 7 ± 8% of abundance only (FCM observations; Figs. 7 and 8). There was no clear north/south pattern, but rather an offshore vs. islands pattern in the picophytoplankton assemblages. Indeed, abundances of Synechococcus increased near the islands (>75% of cell counts), with maxima around Nuku Hiva Island. Although
Prochlorococcus predominated at the more oceanic stations (i.e., NOff and St. 13, the two
SOff stations were not sampled) accounting for more than 65% of picoplanktonic cell
counts, their highest abundances were recorded in surface nearshore Ua Pou (NIsl) and
Fatu Iva (SIsl) Islands where they co-dominated with Synechococcus (40% and 53%,
respectively). Throughout the cruise, picophytoeucaryotes were less abundant than the other picoplanktonic groups, with maxima abundance between 60–100 m where they co-dominated with Prochlorococcus.
The nano- and microphytoplanktonic fraction became dominant only at two NIsl (off
Nuku Hiva and Ua Huka Islands) in the upper 30 m (Chla >3 µm up to 63% of total Chla) and remained relatively abundant at depth (> 30%). The maximum abundance of nanophytoplankton abundance was recorded in the surface layer near Nuku Hiva and in the DCM near Ua Pou (Fig.7), with a high proportion of nanocyanobacteria, (data not shown).
The abundance and composition of microphytoplankton assemblages obtained by microscopic counting at three contrasting stations (St. 3 NOff, St. 5 Nuku Hiva - NIsl and St.
16 Hiva Oa - SIsl) showed a maximum of 15,000 cells L-1 over 0-100 m leeward of the
Nuku Hiva Island, consistently with the highest percentage of size-fractioned Chla > 10 µm observed there (20-38%). At these three stations, diatoms clearly dominated the microphytoplankton assemblages, accounting to more than 80% of total cell counts (up to 96% at St. 5) but the species composition at Nuku Hiva Island differed from the two other stations (Table 2). Indeed, around Nuku Hiva Island T. nitzschioides/frauendfeldii outnumbered the other diatoms, accounting for 82% of diatom counts, followed by two centric forms: Chaetoceros spp. and Bacteriastum spp. In comparison, diatom populations at the NOff and SIsl stations were dominated by three pennate diatoms Pseudo-nitzschia delicatissima spp. and, to a lesser extent, Thalassionema spp. and Cylindrotheca closterium, representing more than 80% of the total abundance. The other abundant genera
were Navicula spp. and Thalassiosira spp. At the three stations dinoflagellates were the second group in abundance with 76–179 cells L-1. Assemblages were rich in autotrophic species of the genus Tripos, mainly T. furca and T. pentagonum, and heterotrophic species such as Protoperidium spp., Phalochromas argus and Podolampas palmipes were also in the top dominant species at the three sampled stations but Gonyaulax spp were abundant only around Hiva Oa Island. Finally, the filamentous cyanobacterium Trichodesmium was present in very low concentrations (< 15 trichomes L-1) and even absent around Nuku Hiva Island. The other taxa were scarce or undetectable at least for the forms >20 µm caught with the plankton net. Overall, it appears that the Nuku Hiva Island stood out from the other islands by its composition of micro- and nano-phytoplanktonic assemblages.
3.3 Zooplankton biomass, abundance and composition
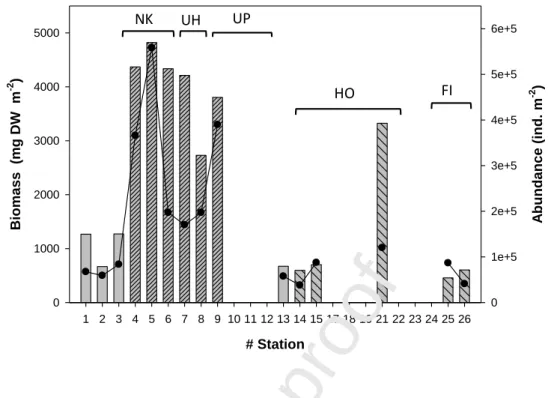
Zooplankton biomass (as dry weight, DW) was mainly distributed in the upper 0–150 m layer (72% ± 12%) while a smaller proportion of the total abundance was present in this
layer (43% ± 15%) (Fig. 9). Biomass and abundance were on average five times higher in NIsl than in NOff and SIsl except for the high biomass at St. 21, close to Hiva Oa Island (Fig.
9), in relation to the high abundance of large copepods of the genera Paraeuchaeta and
Euchaeta (body length around 5 mm). These contrasting north-south and
offshore-nearshore patterns within the archipelago reflected those of the 0–100 m integrated Chla (Fig. 5).
A total of 99 zooplankton taxa were recorded during the PM-12 cruise, including 48 copepod species, 8 other crustaceans, 24 gelatinous taxa and 13 meroplanktonic forms (Table 3). The number of taxa per station ranged from 44 to 61. Copepods were always the most abundant (64 to 92% of total abundance), but their relative abundance was on average higher near the islands (80% at NIsl and 78% at SIsl) than offshore (68% at NOff). Small
copepods were significantly less abundant in the NOff region than in the two other regions
(ANOVA, p <0.001), and the other crustaceans (mostly euphausiids) were rare or almost absent in this region.
The first axis of the Coinertia analysis (50% of the total variance) clearly showed an opposition between (i) the northern (i.e., NOff andNIsl) stations characterized by high Nox
and N/Si ratio as well as high Chla values (with fraction >10 µm) associated to non-copepod crustaceans and (ii) the more oligotrophic southern stations (SIsl) characterized by
pico and nano-phytoplankton and bacteria associated to appendicularians (Fig. 10a-c). On the second axis (36% of the variance) the NIsl stations were opposite to the NOff stations
(Fig. 10d), clearly suggesting a coastal (island)–offshore gradient. NIsl stations were
associated with higher Chla with a high percentage of the >10 µm fraction and small to medium size copepods. On the other hand, pico-phytoplankton at NOff stations were
associated with detritivorous (polychaetes) and carnivorous (chaetognaths) zooplankton. Good correlations between the first and second axes of both environmental and zooplankton systems, as well as the proximity of the stations to the 1:1 regression lines
highlighted a strong link between zooplankton assemblages and environmental conditions either along a north–south (Fig. 10C) or island–offshore gradients (Fig. 10d).
The rank-frequency diagrams (RFDs) also confirmed the regional difference in terms of zooplankton (or copepods) community structure (Fig. 11). The average RFDs for the NIsl region were clearly different from those of NOff, with a more concave shape, whereas
the SIsl area had an intermediate situation. In NIsl, small herbivorous-omnivorous copepods
were the most abundant (Paracalanus/Clausocalanus at rank 1 in Table 4), as also shown in the Coinertia analysis (Fig. 10). In NOff, carnivorous forms (chaetognaths at rank 1) were
prominent, but large herbivorous-omnivorous copepods (Cosmocalanus darwini, at rank 2) and, to a lesser extent, small herbivorous-omnivorous copepods (Oithona spp., Acartia
negligens, and the appendicularians Oipleura spp.; ranks 3, 4 and 5 respectively) were also
abundant.
Finally, microzooplankton, samples collected with the 20 µm net at St. 3, 5 and 16 revealed the presence of numerous Tintinnids. The lowest abundance was observed at the NOff station and the highest one around Hiva Oa Island. Naked ciliates, not considered
here, were probably undersampled since they can be broken during the filtration process.
4 Discussion
Observations from the PM-12 cruise here provide a complementary view at the archipelago scale to the sparse physical, chemical and plankton observations that were collected during the BIOSOPE cruise and Tara Oceans expedition and which were limited to the neighborhood of Nuku Hiva Island. We unveiled north-south differences in the phytoplankton and zooplankton spatial distributions within the archipelago. For instance, surface and integrated Chla values were stronger in the north than in the south, and DCM were stronger and wider around the NIsl than SIsl. While high nitrate and phosphate
concentrations were previously reported at few stations in the northern region from
BIOSOPE and Tara Oceans (Raimbault et al. 2008; Caputi et al. 2019), here we observed
such high concentrations at the archipelago scale, with, however, higher values in the north than in the south. This macro-nutrient latitudinal gradient with decreasing values from the equatorial mesotrophic area toward the subtropical oligotrophic gyre prevents phytoplankton from developing with the same efficiency in the southern region and also likely drive phytoplankton vertical distribution toward a more pronounced DCM-like structure in the south.
Although clear physical and biogeochemical mechanisms at the origin of the Marquesas IME remains undetermined, some clues do exist. For instance, the surface warm wake behind Nuku Hiva (and Ua Pou) Islands refutes the hypothesis of a wind-driven coastal upwelling to uplift nutrients toward the upper lit layer. It rather suggests a wind-sheltered area thanks to the abrupt relief of high islands, which induce calm waters leeward these islands as previously reported from both remote sensing and high-resolution numerical modeling (Raapoto et al. 2018). As the weak wind-driven turbulence is unable to erode the near-surface stratification, the diurnal warming could intensify giving rise to warm wakes (Basterretxea et al. 2002). The interruption of the trade wind systems by the islands also induced wind shear perturbation in the is and’s wake, which in turn could lead to Ekman pumping and eddy generation leeward from the islands (Jimenez et al. 2008), possibly uplifting nutrients and allowing phytoplankton growth (Basterretxea et al. 2002; Hasegawa et al. 2009; Andrade et al. 2014). Consistently, the generation of such eddies has been reported in the wake of the largest Marquesas Islands (such as Nuku Hiva Island) through numerical modeling (Raapoto et al. 2018). However, they were not efficient enough in the model to uplift nutrients and allow phytoplankton blooms (Raapoto et al. 2019), likely due to shallow MLD (Raapoto, pers comm).
On the other hand, these latest simulations showed that iron fertilization by the island sediments was a prerequisite to explain the Marquesan blooms. Indeed, weak dissolved
iron concentrations were reported offshore during BIOSOPE suggesting a possible iron limitation of phytoplankton growth (Blain et al. 2008), as generally accepted in HNLC regions (Boyd et al. 2000; de Baar 2005; Boyd et al. 2007). Thus, land drainage of these volcanic islands could provide iron to the upper lift layer. That being said, the combination of a warm and calm area behind Nuku Hiva Island, associated with an island-driven fertilization would provide favorable conditions for larger cells micro algae to thrive (Glibert 2016) in the island wake, as recently suggested leeward of the island of Tahiti by Sauzède et al. (2020). This agrees with the 0–30 m surface predominance of micro- and nanophytoplankton observed leeward Nuku Hiva island during PM-12. This is also consistent with the highest surface and integrated Chla reported at the NIsl and SIsl stations
rather than offshore.
At three contrasting stations (NOff, NIsl and SIsl) during PM-12, the abundance and
composition of microphytoplankton assemblages collected in the 0–100 m layer with a phytoplankton net revealed a clear dominance of diatoms while the proportion of dinoflagellates never exceeded 20 %. However, differences in the species composition of diatoms appeared between the NIsl (St 5, Nuku Hiva Island again) vs. Noff and SIsl. Diatom
communities were dominated by T. nitzschioides/frauendfeldii behind Nuku Hiva. In 2017, a study (as part of the RETROMAR project) conducted in the Taipivai bay, 3 km away from St. 5, also showed a marked predominance of T. nitzchioides (more than 70 000 cells L-1, > 70% of total diatoms; unpublished data). These observations confirm the neritic character of these algae which seems to be favored under eutrophic conditions. An open question is whether the T. nitzchioides observed at St. 5 were produced in the bay before being advected offshore. In contrast, at the NOff and SIsl stations, Pseudo-nitzschia delicatissima sp. were predominant. It has been shown from the expression of
iron-responsive genes that this genus was genetically more adapted to a low iron environment (Caputi et al. 2019), likely explaining its higher abundance in offshore regions, as observed
here and in the previous studies. The N/Si ratio >1 north of 9°S indicates a possible Si-limitation for diatoms in this region which could reflect the influence of waters advected from the equatorial region (Leynaert et al. 2001) to the northern Marquesas region; This would also explain the weakly silicified diatoms assemblages observed in the north of the archipelago (Gomez et al. 2008), except close to some islands where superficial enrichments from land could temporary disrupt this limitation and lead to changes in the microphytoplankton assemblage. Consistently with this hypothesis, extremely high concentrations of Si were measured at the mouth of two rivers in Nuku Hiva and Hiva Oa Islands during PM-12 (403 µmol L-1 and 120 µmol L-1 respectively; pers. comm.). In contrast, environmental conditions around the southern islands were closer to those of the oligotrophic gyre where other trophic conditions and limitations prevail (Raimbault et al. 2008). Obviously, those observations can not be generalized and definitely deserve to be confirmed, especially additional studies are required to determine factors controlling the composition of diatom (and more generally microphytoplankton) assemblages.
Interestingly, while nano- to microphytoplankton communities were expected in such an IME context, we rather observed a large dominance of picophytoplankton all over the archipelago. Although they predominated at the more oceanic stations, Prochlorococcus appeared to have a more widespread distribution along PM-12 than previously thought and were present over a wide range of nutrient concentrations (Flombaum et al. 2013). They also exhibited a vertical distribution not restricted to the surface layer likely due to the co-existence of two light adapted-ecotypes, high-light (HL) and low-light (LL) ecotypes (Moore et al. 2002). In contrast, Synechococcus were restricted to the surface layer and dominant near the islands, which was consistent with observations during Tara Oceans around Nuku Hiva Island (Caputi et al. 2019, Supp-Inf). These authors reported an increase of Synechococcus abundance towards the coast (their St. 123 vs. 122 and 124), linked to a drastic shift in clade composition related to iron bioavailability. Indeed, under mesotrophic
and even eutrophic conditions as observed around the Marquesas, the macro-nutrient availability is likely not important determinant and other factors might therefore control the distribution or trade-offs between Prochlorococcus and Synechococcus. In accordance with this assumption, the presence of a new clade of Prochlorococcus (named HNLC-HL clade) was reported at St. MAR (West et al. 2011). This clade adapted to high temperature (>27°C), and light conditions were atypical compared to the other HL clades because it showed no negative correlation with nitrate, nitrite and phosphate but significant positive correlations with total Chla, Synechococcus abundance, ammonium uptake and regeneration rates. According to the authors, this HNLC clade is presumably more adapted to nutrient-rich environments than other ecotypes and is more dependent on ammonium availability.
Zooplankton biomass values observed during PM-12 (457 to 4820 mgDW m-2 based on the 0–300 m sampling and 313 to 4465 mgDW m-2 based on the 0–150 m sampling) were globally higher than previous values recorded in the upper 200 m of both oligotrophic (~ 400–600 mgDW m-2) and HNLC (~ 1200–1500 mgDW m-2) regions of the equatorial Pacific (Le Borgne and Rodier 1997; Le Borgne et al. 2002). On the other hand, the NIsl
zooplankton biomass (2700–4800 mgDW m-2 over 0–300 m and 200–4500 mgDW m-2 over 0–150 m) was comparable to the values reported by Caputi et al. (2019) at the three
Tara Oceans stations around Nuku Hiva island over 0 -100 m (1000 to 6000 mgDW m-2
from St. 122 to 124, see their Fig. 8). High zooplankton biomass near the NIsl coincided
with high phytoplankton biomass dominated by nano- and microphytoplankton, while low copepod abundance in the NOff region was associated with lower phytoplankton biomass
dominated by picoplankton. The link between zoo- and phytoplankton was also suggested by a high correlation between zooplankton biomass and integrated Chla (r = 0.80, p = 0.002). The importance of suspension-feeders (small and medium-size copepods) in the NIsl corresponded to a young community’s response to nutrient enrichment, typical of the
initial phase of zooplankton succession, as also shown by the concave shape of the rank-frequency diagram (RFD), with few predominant taxa, a large component of taxa present in low densities, and few rare species (Frontier 1976). At the opposite, the importance of carnivorous forms (chaetognaths) in the NOff region suggested a microbial grazing pathway
and more mature communities also evidenced by the convex shape of the rank-frequency diagram typical of a more advanced stage in succession with several species having similar high abundance (Pinca and Dallot 1997). This evolution of the food chain away from the islands suggests a plankton enrichment originating from the coast with communities becoming more mature as long as they are advected offshore (Caputi et al. 2019; Raapoto et al. 2019).
The three cruises (BIOSOPE, Tara Oceans and PM-12) have improved our knowledge of the physical and biogeochemical characteristics of the Marquesas waters and their spatial structure. The homogeneous vertical distribution in Chla and thermohaline structure over the 100 m upper layer at the northern offshore stations (St. 1 and 2, ~30 mg m-2) was consistent with previous observations during Tara Oceans (from 27.6 to 33.6 mg m-² over 0–100 m at St. 122–124; Caputi et al. 2019) and BIOSOPE (30.2 ± 2.8 mg m-² mean over 0–65 m, Grob et al. 2007; Claustre et al. 2008; Ras et al. 2008) revealing a relative temporal ecosystem stability at the NOff stations. However, the north-south Chla
variability as shown on satellite and BGC-Argo observations was indicative of quick changes in the environmental variables, especially in the south. Such changes might be related to the stronger ocean dynamics in the south highlighted on Finite Size Lyapunov Exponent satellite observations (Martinez et al. 2018), and likely associated with mesoscale activity flowing from the south-east (Cassianides et al. in rev). Consequently, different datasets with different environmental conditions may lead to tricky comparisons. Comparisons between the three cruises was also weakened by several shortcoming linked to heterogeneous sampling strategies and methodologies. Some differences have emerged
and are not explained such as the nanophytoplankton (i.e. 2–20 μm in size) community predominance reported during BIOSOPE (Ras et al. 2008) vs. a dominance of organism <3 μm in size during PM-12. These differences among others can be induced by differences of
the filter and net sizes, the seasonal variability (austral winter during BIOSOPE and Tara
Oceans vs. summer here), or shorter-term variability as explained above. On its side, Tara Oceans in the Marquesas attempted to assess the impact of iron availability on plankton
communities, by exploring bio‐oceanographic and bio‐omics data sets. They identified
subcommunities covarying with iron. However, some limitations arise from the part of their analysis based on iron distribution which was derived from two advanced biogeochemical models rather than discrete measurements, which are absolutely necessary to understand the specific functioning of this ecosystem.
5 Conclusion
During the PM-12 cruise in February 2012, we had the opportunity to collect hydrological and plankton samples all around the archipelago. Although this cruise (and therefore the sampling strategy) was not dedicated to physical or biogeochemical oceanography, it provided the first view of physical-biogeochemical observations all over the archipelago and emphasize a north/south as well as an island vs. offshore gradient. In this HNLC environment, phytoplankton and zooplankton biomass were higher in the north where stratification was weaker than in the south and also higher close to the islands than offshore. Picophytoplankton and copepods dominated throughout the archipelago, except in the wake of the NIsl where the importance of suspension-feeding coincided with the
highest biomass of phyto- and zooplankton and with the predominance of nano- and microphytoplankton. This corresponds to a young community’s response to nutrient enrichment through an increase of herbivorous animals highlighting a bottom-up effect on zooplankton. Contrastingly, small copepods were significantly less abundant in the NOff
region and the predominance of carnivorous forms coincided with low Chla and strong dominance of picoplankton, suggesting a microbial grazing pathway and more mature communities.
The BIOSOPE, Tara Oceans and Pakaihi I te Moana cruises have improved our knowledge of the biogeochemical characteristics of the Marquesas waters, further studies are needed to understand i) the niche partitioning between the different phytoplankton (especially the nanophytoplankton fraction) and zooplankton taxa and ii) how dynamical and chemical factors (particularly iron) control their repartition taking into account north/south, nearshore/offshore and leeward/windward variability.
Acknowledgements
We thank captain and crew of the fishing vessel Braveheart, as well as the head of mission M. Taquet, and the AAMP founding. The authors wish to thank Philippe Gérard (US IMAGO, New Caledonia) for providing nutrient data and Véronique Cornet-Barthaux for phytoplankton microscopic determinations. We also thank Antoine Nowaczyk for the zooplankton counting and microscopic determinations. We thank ACRI-ST France for the development, validation, and distribution of the GlobColour product (http://globcolour.info). We would like to warmly thank the two anonymous reviewers for their valuable comments and suggestions which helped to deeply improved this manuscript.
References
Aminot A, Kérouel R (2007). Dosage automatique des nutriments dans les eaux marines: méthodes en flux continu. Editions Quae
Andrade I, Sangrá P, Hormazabal S, Correa-Ramirez M (2014). Island mass effect in the Juan Fernandez Archipelago (33°S), Southeastern Pacific. Deep Sea Research, Part I,84, 86–99. https://doi.org/10.1016/j.dsr.2013.10.009
Basterretxea G, Barton ED, Tett P et al (2002). Eddy and deep chlorophyll maximum response to wind-shear in the lee of Gran Canaria. Deep Sea Research Part I: Oceanographic Research Papers, 49(6), 1087-1101
Blain S, Bonnet S, Guieu C (2008). Dissolved iron distribution in the tropical and subtropical South Eastern Pacific. Biogeosciences 5:269-280
Boyd PW, Jickells T, Law CS et al. (2007). Mesoscale iron enrichment experiments 1993– 2005: Synthesis and future directions. Science, 315(5812), 612–617. https://doi.org/10.1126/science.1131669
Boyd PW, Watson AJ, Law CS et al. (2000). A mesoscale phytoplankton bloom in the polar Southern Ocean stimulated by iron fertilization. Nature, 407(6805), 695–702. https://doi.org/10.1038/35037500
Brzezinski MA (1985). The Si: C: N ratio of marine diatoms: Interspecific variability and the effect of some environmental variables. Journal of Phycology, 21(3), 347-357 Caputi L, Carradec Q, Eveillard D et al (2019). Community‐Level Responses to Iron
Availability in Open Ocean Planktonic Ecosystems. Glob Biogeochem Cyc. doi.org/10.1029/2018GB006022
Cassianides A, Martinez E, Maes C et al. (in rev). Influence of mesoscale dynamics on phytoplankton plumes in the Marquesas Islands. Remote Sensing.
Claustre H, Sciandra A, Vaulot D (2008). Introduction to the special section bio-optical and biogeochemical conditions in the South East Pacific in late 2004: the BIOSOPE program. Biogeosciences 5, 679-691
Claustre H, Johnson KS, Takeshita Y (2020). Observing the Global Ocean with Biogeochemical-Argo. Annual review of marine science, 12, 23–48. https://doi.org/10.1146/annurev-marine-010419-010956
Conway DVP, White RG, Hugues-Dit-Ciles J et al (2003). Guide to the coastal and surface zooplankton of the South-Western Indian Ocean. DEFRA Darwin Initiative Zooplankton Programme, Version 1. Marine Biological Association of the United Kingdom Occasional Publications, Plymouth
de Baar, HJW (2005). Synthesis of iron fertilization experiments: From the iron age in the age of enlightenment. Journal of Geophysical Research, 110, C09S16. https://doi.org/10.1029/2004JC002601
De Boyer Montegut C, Madec G, Fischer AS et al (2004). Mixed layer depth over the global ocean: An examination of profile data and a profile-based climatology, J Geophys Res. 109, C12003, doi:10.1029/2004JC002378
Dolédec S, Chessel D (1994). Co-inertia analysis: an alternative method for studying species-environment relationships. Freshwater Biology 31: 277-294
Doty MS, Oguri M (1956). “ he is and mass effect”. J. Cons. Int. Explor. Mer 22: 33-37 Fanton d'Andon O, Mangin A, Lavender S et al (2009). “G ob o our - the European
ervice for Ocean o our”. In Proceedings of the 2009 IEEE International
Geoscience & Remote Sensing Symposium, Cape Town, South Africa, July 12-17 Flombaum P, Gallegos JL, Gordillo RA et al (2013). Present and future global distributions
of the marine Cyanobacteria Prochlorococcus and Synechococcus. Proc Natl Acad Sci 110(24), 9824-9829
Frontier S (1976). Utilisation des diagrammes rang-fréquence dans l'analyse des écosystèmes. Journal de Recherche Océanographique, 1(3), 35-48
Galzin R, Duron S-D, Meyer J-Y (eds.) (2016). Biodiversité terrestre et marine des îles arquises, Po ynésie française, Paris: ociété Française d’Ichtyo ogie: 526 pp
Glibert, P. M. (2016). Margalef revisited: a new phytoplankton mandala incorporating twelve dimensions, including nutritional physiology. Harmful Algae, 55, 25-30 Gómez F, Claustre H, Raimbault P, Souissi S (2007). Two High-Nutrient Low-Chlorophyll
phytoplankton assemblages: the tropical central Pacific and the offshore Peru-Chîle Current. Biogeosciences 4: 1101-1113
Grob C, Ulloa O, Claustre H et al (2007). Contribution of picoplankton to the total particulate organic carbon concentration in the eastern South Pacific. Biogeosciences 4: 837-852
Hasegawa D, Lewis MR, Gangopadhyay A (2009). How islands cause phytoplankton to bloom in their wakes. Geophysical ResearchLetters, 36, L20605. https://doi.org/10.1029/2009GL039743
Hernández-León S, Gómez M, Pagazaurtundua M et al (2001). Vertical distribution of zooplankton in Canary Island waters: implications for export flux. Deep Sea Res Part I, 48: 1071-1092
Holmes RM, Aminot A, Kérouel R et al (1999). A simple and precise method for measuring ammonium in marine and freshwater ecosystems. Canadian Journal of Fisheries and Aquatic Sciences 56, 1801–1808
Hunt B and collaborators (2013). Isotope ratios of plankton size spectra as a tool for investigating pelagic trophic dynamics, CLIOTOP meeting, Nouméa (Nouvelle-Calédonie), 11-15 février 2013
Jimenez B, Sangrá P, Mason E (2008). A numerical study of the relative importance of wind and topographic forcing on oceanic eddy-shedding by tall, deep water islands. Ocean Modelling,22(3–4), 146–157. https://doi.org/10.1016/j.ocemod.2008.02.004 Le Borgne R, Rodier M (1997). Net zooplankton and the biological pump: a comparison
between the oligotrophic and mesotrophic equatorial Pacific. Deep Sea Res Part II, 44(9), 2003-2023
Le Borgne R, Barber RT, Delcroix T et al (2002). Pacific warm pool and divergence: temporal and zonal variations on the equator and their effects on the Biological Pump. Deep Sea Res Part II, 49, 2471-2512
Le Bouteiller A, Blanchot J, Rodier M (1992). Size distribution patterns of phytoplankton in the western Pacific: towards a generalization for the tropical open ocean. Deep Sea Res Part I, 39, 805–823
Legeckis R, Brown CW, Bonjean F, Johnson ES (2004). The influence of tropical instability waves on phytoplankton blooms in the wake of the Marquesas Islands during 1998 and on the currents observed during the drift of the Kon‐Tiki in 1947.
Geophys Res Lett 31 (23)
Leynaert A, Treguer P, Lancelot C, Rodier M (2001). Silicon limitation of biogenic silica production in the equatorial Pacific, Deep Sea Res, Part I, 48, 639 – 660
Lovegrove T (1966). The determination of the dry weight of plankton and the effect of various factors on the values obtained. Pages 407-420 in Barnes H, ed. Some contemporary studies in Marine Science. London: Allens and Unwin Ltd.
Maritorena S, Siegel DA (2005). Consistent merging of satellite ocean color data sets using a bio-optical model. Remote Sens Environ 94(4), 429-440
Maritorena S, Fanton d'Andon OHF, Mangin A, Siegel DA (2010). Merged satellite ocean color data products using a bio-optical model: Characteristics, benefits and issues. Remote Sens Environ 114(8), 1791-1804
Martinez E, Maamaatuaiahutapu K (2004). Island mass effect in Marquesas islands: time variations. Geophys Res Lett 31, L18307. doi:10.1029/2004GL020682
Martinez E, Ganachaud A, Lefevre J, Maamaatuaiahutapu K (2009). Central South Pacific thermocline water circulation from a high‐resolution ocean model validated against
satellite data: Seasonal variability and El Niño 1997–1998 influence. J Geophys Res. 114(C5)
Martinez E, Raapoto H, Maes C, Maamaatuaiahutapu K (2018). Influence of Tropical Instability Waves on Phytoplankton Biomass near the Marquesas Islands. Remote Sens, 10(4), 640, https://doi.org/10.3390/rs1004064
Moore LR, Post AF, Rocap G, Chisholm SW (2002). Utilization of different nitrogen sources by the marine cyanobacteria Prochlorococcus and Synechococcus. Limnol Oceanogr 47(4), 989-996
O’ onnor B , Fine RA, Olson DB (2005). A global comparison of subtropical
underwater formation rates. Deep Sea Res Part I 52(9), 1569–1590, doi:10.1016/j.dsr.2005.01.011
Pinca S, Dallot S (1997). Zooplankton community structure in the Western Mediterranean Sea related to mesoscle hydrodynamics. Hydrobiologia, 356 (1-3), 127-142
Raimbault P, Garcia N, Cerutti F (2008). Distribution of inorganic and organic nutrients in the South Pacific Ocean – evidence for long-term accumulation of organic matter in nitrogen-depleted waters. Biogeosciences, 5:281-298
Raapoto H, Martinez E, Petrenko A et al (2018). Modeling the wake of the Marquesas archipelago. J Geophys Res. 123(2), 1213-1228
Raapoto H, Martinez E, Petrenko A et al (2019). Role of iron in the Marquesas island mass effect. J Geophys Res. In press
Ras J, Claustre H, Uitz J (2008). Spatial variability of phytoplankton pigment distributions in the subtropical South Pacific Ocean: comparison between in situ and predicted data. Biogeosciences, 5: 353-369
Razouls C, de Bovée F, Kouwenberg J, Desreumaux N (2005-2020.) Diversité et répartition géographique chez les Copépodes planctoniques marins. Accessed at http://copepodes.obs-banyuls.fr.
Roesler C, Uitz J, Claustre H et al (2106). Recommendations for obtaining unbiased chlorophyll estimates from in situ chlorophyll fluorometers: A global analysis of
WET Labs ECO sensors. Limnol Oceanogr Methods, 15(6), 572–585, doi:10.1002/lom3.10185, 2017
Sauzède R, Martinez E, Maes C et al (2020). Enhancement of phytoplankton biomass leeward of Tahiti as observed by Biogeochemical-Argo floats. Journal of Marine Systems 204, 103284. https://doi.org/10.1016/j.jmarsys.2019.103284
Schmechtig C, Claustre H, Poteau A, ’Ortenzio F (2014). Bio-Argo quality control manual for the Chlorophyll-a concentration. Argo data management
Signorini SR, McClain CR, Dandonneau Y (1999). Mixing and phytoplankton bloom in the wake of the Marquesas Islands. Geophys Res Lett 26: 3121-3124
Thioulouse J, Chessel D, Dolédec S, Olivier J-M (1997). ADE-4, a multivariate analysis and graphical display software. Statistics and Computing 7: 75-80
Tregouboff G, Rose M (1957). Manuel de planctonologie méditerranéenne, in: Scientifique, C.n.d.l.R. (Ed.), Paris, p. 587
Van Wambeke FV, Pfreundt U, Barani A et al (2016). Heterotrophic bacterial production and metabolic balance during the VAHINE mesocosm experiment in the New Caledonia lagoon. Biogeosciences, 13(11), 3187-3202, doi.org/10.5194/bg-13-3187-2016
West NJ, Lebaron P, Strutton PG, Suzuki MT (2011). A novel clade of Prochlorococcus found in high nutrient low chlorophyll waters in the South and Equatorial Pacific Ocean. The ISME journal 5(6), 933
Wong A, Keely R, Carval T., Argo Data Management Team (2020). Argo Quality Control Manual for CTD and Trajectory Data.
Wyrtki K (1981). An Estimate of Equatorial Upwelling in the Pacific. J Phys Oceanog 11, 1205–1214
Xing X, Claustre H, Blain S et al. (2012). Quenching correction for in vivo chlorophyll fluorescence acquired by autonomous platforms: a case study with instrumented
elephant seals in the Kerguelen region (Southern Ocean). Limnol. Oceanogr. Methods 10, 483–495. https://doi.org/10.4319/lom.2012.10.483
Yan X, Ho C, Zheng Q, Klemas V (1992). Temperature and Size Variabilities of the Western Pacific Warm Pool. Science 258(5088), 1643–1645
Fig. 1 GlobColour-GSM satellite derived chlorophyll-a concentration (Chla in mg m-3) averaged over 1998 to 2012 for the South Pacific Ocean (white line delineates the French Polynesian Exclusive Economic Zone, EEZ). The
oligotrophic region (i.e., Chla <0.1 mg m-3) is highlighted with the blue color
Fig. 2 Bathymetry around the Marquesas archipelago. The name of the main islands is indicated in black. The
location of the stations sampled during the Pakaihi I te Moana cruise are reported as red triangles. The three close
stations sampled during BIOSOPE in September 2004 are indicated as a pink star and referred to as St. MAR. The three stations sampled during Tara Oceans are also indicated in pink and referred as 122 to 124 as in Caputi et al. (2019)
Fig. 3 Satellite derived SST (°C, upper panels a,b), SSS (middle panels c,d) and Chla (mg m-3, lower panels e,f) averaged over the first-time period of the cruise (4 to 10 February 2012; left column) dedicated to the northern region of the archipelago, and over the second time period (12 to 22 February 2012; right column) dedicated to the southern region.
The location of the cruise stations are reported as triangles. The red ones are consistent with the time period of satellite observations. Northern islands (Nuku Hiva, NK; Ua Huka,UH and Ua Pou, UP) and southern islands (Hiva Oa, HO and
Fatu Iva, FI) names are indicated
Fig. 4 Left vertical sections of CTD measurements temperature, salinity and in vivo fluorescence used as a proxy
of Chl. Right: in situ measurements of Nitrate, Phosphate, and Silicate. This section has been performed along a north to south transect as shown on the upper panel. Northern (Nuku Hiva, NK; Ua Huka, UH and Ua Pou, UP) and southern (Hiva Oa, HO and Fatu Iva, FI) island names are indicated on the upper panels. Contours plots drawn with the Ocean
Data View software
Fig. 5 Chla integrated over 0–60m (in light grey) and 0–100 m (in dark grey) issued from fluorometric analyses
(in mg m-2). Same abbreviation for the island names as in Fig. 4. Dark colors highlight NOff and SOff stations (i.e., St. 1–3, 13, 23–24), while light colors relate to the NIsl and SIsl stations (ie., St. 5–12 vs. 14–22,25–26, respectively).
Fig. 6 a) Trajectory along time of the BGC-Argo float deployed in the wake of Nuku Hiva during Tara Oceans
expedition in August 2011. b) Vertical distribution of BGC-Argo derived Chla along time. The black line delimits the MLD as defined in the BGC-Argo float section. The bold black line illustrates in both panels the approximate transition
from the northern to the southern part of the archipelago
Fig. 7 Picophytoplankton (Prochlorococcus, Synechococcus, and picophytoeukaryotes) and nanophytoplankton
abundances (×103 cells mL-1), obtained by flow cytometry along the north-south transect as pictured on Fig. 4
Fig. 8 Prochlorococcus, Synechococcus, and picophytoeukaryotes (Picophytoeuk.) and nanophytoplankton
(Nanophyto.) abundances integrated over 0–100 m.
Fig. 9 Total zooplankton biomass (bars) and abundance (dark line) in the 0–300 m layer. Same abbreviation for
the island names as in Fig. 4. For the biomass NOff and SOff stations are simply colored, while NIsl and SIsl stations are hatched. # Station 1 2 3 4 5 6 7 8 9 10 11 12 13 14 15 17 18 19 21 22 23 24 25 26 Bio mas s (mg DW m -2 ) 0 1000 2000 3000 4000 5000 A bu nd an ce (in d. m -2 ) 0 1e+5 2e+5 3e+5 4e+5 5e+5 6e+5 NK UH UP HO FI
Journal Pre-proof
Fig. 10 Co-inertia analysis on zooplankton taxonomic groups and environmental variables. Ordination on the plan
(1, 2) of A) environmental variables and B) zooplankton groups, and positions of the sampled stations on the C) first and
D) second axes of the two systems. The 1:1 lines represent the equality between the coordinates of both systems. Colours
of the squares highlight the NOff, NIsl, and SIsl regions. Appendicularians (APP), chaetognaths (CHAET), ctenophores (CTENO), small copepods (Small COP), medium copepods (med COP), large copepods (Lar COP), jellyfish (JEL),
meroplankton (MERO), mollusks (MOL), other crustaceans (O CR), polycheta (POLYC), siphonophores (SIPHO), tunicates (TUN), Prochlorococcus (Proc), Synechococcus (Syn), picoeukaryote (PicoEuk), nano-eukaryote (NanoEuk),
nanocyanobacteria (NanoCyan), other nanoplankton (Other nano), other picoplankton (Other pico) are indicated.
Fig. 11 Rank-frequency diagrams (RFDs) for all (A) zooplankton taxa and (B) copepod taxa A 1 10 100 Freq uen c y 0,001 0,01 0,1 1 Noff NIsl SIsl B Rank 1 10 100 0,001 0,01 0,1 1 Noff NIsl SIsl
Journal Pre-proof
Table 1 Station number and corresponding CTD and Niskin measurements as well as zooplankton net
(*additional phytoplankton net).
Station # Longitude (°W) Latitude (°S) CTD Niskin Zooplankton net
1 140°05.1 8°20.0 x x x 2 140°55.6 8°22.1 x x 3 140°47.4 8°42.7 x x* 4-6 140°15.1 8°54.6 x x x* 7-8 139°38.7 8°56.0 x x x 9 140°04.9 9°15.3 x x x 10 140°04.9 9°15.3 x 11 140°02.9 9°19.8 x 12 140°16.4 9°26.9 x 13 139°29.0 9°30.2 x x 14 139°02.2 9°38.8 x 15 139°09.5 9°52.6 x x 16 139°08.5 9°57.4 x x x* 17 139°08.6 9°58.1 x 18-20 139°55.3 9°50.2 x 21 138°55.6 9°51.1 x x x 22 138°45.5 9°39.1 x 23 138°9.8 10°0.5 x 24 137°55.6 10°14.1 x 25 138°44.1 10°27.7 x x x 26 138°43.8 10°32.2 x x x
Journal Pre-proof
Table 2. Top dominant phytoplankton taxa sampled at three stations around the Marquesas archipelago, **
species >10% of total cells counts
St. 3 (NOff) St. 5 (NIsl) St. 16 (SIsl)
Diatoms taxa (Top 10)
Pseudo-nitzschia delicatissima ** Thalassionema nitzschioides ** Pseudo-nitzschia delicatissima ** Thalassionema nitzschioides ** Chaetoceros spp. Cylindrotheca closterium ** Cylindrotheca closterium** Bacteriastrum sp. Thalassionema nitzschioides ** Navicula spp. Pseudo-nitzschia delicatissima Navicula spp.
Fragilariopsis dodiolus Cylindrotheca closterium Chaetoceros spp. Pseudo-nitzschia seriata Navicula spp Thalassiosira ssp. Planktoniella sol Fragilariopsis dodiolus Fragilariopsis dodiolus Thalassiosira spp. Thalassiosira ssp Plagiotropis sp. Plagiotropis sp. Thalassionema bacillare Thalassiothrix sp. Rhizosolenia bergonii Rhizosolenia setigera Planktoniella sol
Dinoflagellate taxa (Top 5)
Tripos pentagonus** Tripos furca** Tripos pentagonus** Tripos furca** Podolampas palmipes** Tripos furca** Protoperidinium spp.** Tripos pentagonus** Phalacroma argus**
Tripos spp Tripos muelleri** Gonyaulax spp.**
Phalacroma argus Protoperidinium spp.** Protoperidinium spp.
Podolampas palmipes Tripos fusus Oxytoxum sp.
Table 3: Mean indexes of the abundance of the zooplankton taxa in the three zones: NOff (St. 1 to 3), NIsl (St. 4 to 12), and SIsl (13 to 26). Given the similarity of taxonomic composition, St.13 was included in SIsl to lighten the table.
Table 4 Table of the zooplankton taxa having the first 10 ranks in the RFDs diagrams shown in Fig. 11.