HAL Id: hal-03097383
https://hal.archives-ouvertes.fr/hal-03097383
Submitted on 5 Jan 2021
HAL is a multi-disciplinary open access
archive for the deposit and dissemination of
sci-entific research documents, whether they are
pub-lished or not. The documents may come from
teaching and research institutions in France or
abroad, or from public or private research centers.
L’archive ouverte pluridisciplinaire HAL, est
destinée au dépôt et à la diffusion de documents
scientifiques de niveau recherche, publiés ou non,
émanant des établissements d’enseignement et de
recherche français ou étrangers, des laboratoires
publics ou privés.
Using aerobic exercise to evaluate sub-lethal tolerance of
acute warming in fishes
Felipe Blasco, Andrew Esbaugh, Shaun Killen, Francisco Tadeu Rantin,
Edwin Taylor, David Mckenzie
To cite this version:
Felipe Blasco, Andrew Esbaugh, Shaun Killen, Francisco Tadeu Rantin, Edwin Taylor, et al.. Using
aerobic exercise to evaluate sub-lethal tolerance of acute warming in fishes. Journal of Experimental
Bi-ology, Cambridge University Press, 2020, 223 (9), pp.jeb218602. �10.1242/jeb.218602�. �hal-03097383�
RESEARCH ARTICLE
Using aerobic exercise to evaluate sub-lethal tolerance of acute
warming in fishes
Felipe R. Blasco1,2,*, Andrew J. Esbaugh3, Shaun S. Killen4, Francisco Tadeu Rantin1, Edwin W. Taylor1,5and
David J. McKenzie1,6
ABSTRACT
We investigated whether fatigue from sustained aerobic swimming provides a sub-lethal endpoint to define tolerance of acute warming in fishes, as an alternative to loss of equilibrium (LOE) during a critical thermal maximum (CTmax) protocol. Two species were studied, Nile tilapia (Oreochromis niloticus) and pacu (Piaractus mesopotamicus). Each fish underwent an incremental swim test to determine gait transition speed (UGT), where it first engaged the unsteady anaerobic swimming mode that preceded fatigue. After suitable recovery, each fish was exercised at 85% of their own UGTand warmed 1°C every 30 min, to identify the temperature at which they fatigued, denoted as CTswim. Fish were also submitted to a standard CTmax, warming at the same rate as CTswim, under static conditions until LOE. All individuals fatigued in CTswim, at a mean temperature approximately 2°C lower than their CTmax. Therefore, if exposed to acute warming in the wild, the ability to perform aerobic metabolic work would be constrained at temperatures significantly below those that directly threatened survival. The collapse in performance at CTswimwas preceded by a gait transition qualitatively indistinguishable from that during the incremental swim test. This suggests that fatigue in CTswimwas linked to an inability to meet the tissue oxygen demands of exercise plus warming. This is consistent with the oxygen and capacity limited thermal tolerance (OCLTT) hypothesis, regarding the mechanism underlying tolerance of warming in fishes. Overall, fatigue at CTswim provides an ecologically relevant sub-lethal threshold that is more sensitive to extreme events than LOE at CTmax.
KEY WORDS: CTmax,Oreochromis niloticus, Piaractus
mesopotamicus
INTRODUCTION
Aquatic habitats are undergoing increasingly rapid human-induced environmental change, especially in response to climate warming.
Projections indicate a gradual increase in seasonal temperatures by up to 4°C by 2100, accompanied by an increased frequency of extreme and acute warming events at localized scales (Frölicher and Laufkötter, 2018; IPCC, 2014, 2019). This will challenge resident animals, particularly ectotherms such as fishes, whose physiology is profoundly influenced by temperature, with consequences for fitness traits such as survival, growth and reproduction (Perry et al., 2005; Pörtner and Knust, 2007; Smale et al., 2019). Therefore, it is critical to understand the capacity of fishes to tolerate warming.
A primary methodology used to evaluate upper thermal limits in fishes is the critical thermal maximum (CTmax) protocol
(Lutterschmidt and Hutchison, 1997). This involves warming a fish progressively in steps and uses loss of equilibrium (LOE) as the tolerance endpoint, the temperature at which the fish loses its ability to maintain orientation and turns over. Although the CTmaxdoes not
cause mortality, LOE is an incipient lethal threshold because, in the wild, the animal would be unable to escape from the thermal conditions and so its survival would be threatened (Lutterschmidt and Hutchison, 1997). It has also proven rather difficult to understand what causes LOE at CTmaxin fishes (Ern et al., 2016,
2017; Jutfelt et al., 2019; Wang et al., 2014). It is essential to understand the physiological mechanisms that underlie tolerance of warming because this will greatly improve the ability to model and project the effects of global warming on fish populations and communities (Jørgensen et al., 2012; McKenzie et al., 2016).
The dominant hypotheses for the physiological mechanism that underlies tolerance of warming in fishes are the Fry paradigm (Fry, 1947, 1957, 1971) and its mechanistic elaboration, the oxygen and capacity limited thermal tolerance (OCLTT) hypothesis (Pörtner, 2010; Pörtner et al., 2017). The core concept in the Fry paradigm and the OCLTT hypothesis is that thermal tolerance is limited by the capacity of the cardiorespiratory system to meet tissue oxygen demands (Fry, 1971; Pörtner, 2010; Pörtner and Farrell, 2008). That is, when fishes are warmed, their basal metabolism is progressively accelerated until, at a certain warm temperature, the oxygen demands for simple maintenance require the entire cardiorespiratory capacity for oxygen supply. At that temperature, the aerobic scope (AS) for vital activities beyond maintenance (e.g. exercise, growth and reproduction) is zero; exceeding that temperature threshold rapidly leads to overall physiological collapse (Eliason et al., 2011; Pörtner, 2010; Pörtner and Farrell, 2008; Schulte, 2015). These temperature thresholds are expected to be species-specific and depend upon the species’ ecology and evolutionary history. The mechanism behind the OCLTT is proposed to be universal (Fry, 1971; Pörtner, 2010) but this is currently an active debate (Farrell, 2016; Jutfelt et al., 2018; Lefevre, 2016; Schulte, 2015), in particular because there is evidence that LOE at CTmaxmay not be linked to limitations in tissue
oxygen supply (Ern et al., 2016, 2017; Wang et al., 2014). As such, there is a need for alternative protocols to evaluate sub-lethal sensitivity to acute warming in fishes, especially which use
Received 20 November 2019; Accepted 1 March 2020
1
Department of Physiological Sciences, Federal University of São Carlos, 13565-905 São Carlos, SP, Brazil.2
Joint Graduate Program in Physiological Sciences, Federal University of São Carlos – UFSCar/São Paulo State University, UNESP Campus Araraquara, 14801-903 Araraquara, SP, Brazil.3
Marine Science Institute, University of Texas at Austin, Austin, TX 78373, USA.4
Institute of Biodiversity, Animal Health & Comparative Medicine, College of Medical, Veterinary & Life Sciences, University of Glasgow, Glasgow G12 8QQ, UK.5
School of Biosciences, University of Birmingham, Birmingham B15 2TT, UK.6MARBEC, Université de
Montpellier, CNRS, Ifremer, IRD, 34000 Montpellier, France.
*Author for correspondence ([email protected])
F.R.B., 0002-1909-7055; A.J.E., 0002-7262-4408; S.S.K., 0000-0003-4949-3988; F.T.R., 0000-0002-3697-278X; E.W.T., 0000-0002-4122-6511; D.J.M., 0000-0003-0961-9101
This is an Open Access article distributed under the terms of the Creative Commons Attribution License (http://creativecommons.org/licenses/by/4.0), which permits unrestricted use, distribution and reproduction in any medium provided that the original work is properly attributed.
Journal
of
Experimental
ecologically relevant endpoints that are less extreme than LOE and which are more amenable to understanding their underlying physiological mechanisms. If limitations to tissue oxygen supply do underlie a collapse in performance during warming, then this could be tested by imposing a level of aerobic metabolic work upon a fish and measuring their capacity to sustain it while their overall tissue oxygen demands are being accelerated by progressive increases in temperature. When sockeye salmon, Oncorhynchus nerka, were exposed to progressive warming while they were swimming at a high sustained aerobic speed in a swim tunnel, at a certain warm temperature they exhibited signs of unsteady anaerobic swimming and then fatigued (Steinhausen et al., 2008).
We therefore investigated the hypothesis that fatigue from sustained aerobic swimming provides a sub-lethal threshold for tolerance of acute warming in fishes, which is more sensitive (occurs at a lower temperature) than LOE at CTmax. We studied two widespread tropical
freshwater species, a cichlid that originates from Africa, the Nile tilapia, Oreochromis niloticus (Linnaeus 1758), and a serrasalmid from South America, the pacu, Piaractus mesopotamicus (Holmberg 1887). For each individual fish, we first performed an incremental swim test to reveal its gait transition speed (UGT), where it transitioned
from steady aerobic to unsteady anaerobic swimming (Marras et al., 2013). After suitable recovery, we set each fish to swim at 85% of their own UGTand warmed them in steps, to identify the temperature at
which they fatigued, which we denoted as CTswim. We then compared
CTswimof all fishes with their own CTmax, the temperature of LOE
when warmed at the same rate under static conditions. We also expected to gain qualitative evidence that the collapse in performance at CTswimwas linked to an inability to meet tissue oxygen demand, in
particular that fatigue was preceded by a gait transition from steady aerobic to unsteady anaerobic swimming. This would indicate that the CTswim protocol could be useful in testing the expectations of the
OCLTT paradigm. Finally, we measured rates of oxygen uptake during the initial swim test and during the CTswim, to gain insight into
how acute warming influenced overall capacity for oxygen supply, relative to capacity at the initial acclimation temperature.
MATERIALS AND METHODS Ethical approval
The experiments were performed according to the regulations of the Brazilian National Council for Control of Animal Experimentation (CONCEA). The protocol was approved by the Ethics Committee on Animal Use of the Federal University of São Carlos (CEUA/ UFSCAR), protocol number CEUA 3927151016.
Animals
Juvenile tilapia and pacu of both sexes were provided by Piscicultura Polettini in Mogi Mirim (São Paulo state) and transported to the Department of Physiological Sciences, Federal University of São Carlos (São Carlos, SP). There, each species was held in a 500 liter holding tank supplied with well-aerated water at 25±1°C from a recirculating biofilter system, and fed ad libitum every second day with commercial pellets. After a period of at least 2 weeks, animals were anesthetized (0.1 g l−1 benzocaine) and tagged (PIT) for individual identification. They were allowed to recover in routine holding conditions for at least 1 week before use in the experiments.
Swimming performance and metabolic phenotype at acclimation temperature
Each fish was measured for mass (to the nearest 0.1 g) and for fork length, height and width (to the nearest mm), to calculate the solid blocking effect in the swim flume, and to measure relative
swimming speed in body lengths (BL) s−1 (Bell and Terhune, 1970). Swimming respirometry was performed with a Steffensen-type swim tunnel respirometer constructed of Plexiglas (volume 13.4 liters), designed to exercise fish in a non-turbulent water flow with a uniform velocity profile (McKenzie et al., 2007, 2012).
Each fish was placed in the respirometer and allowed to recover overnight, swimming at a gentle current speed equivalent to 1 BL s−1. The respirometer was supplied with a constant flow of aerated biofiltered water at 26°C. The next morning the fish was exposed to progressive increments in swimming speed of 1 BL s−1 every 30 min until 5 BL s−1was reached. Beyond this, it was exposed to constant acceleration at 0.1 BL s−1every 10 s until fatigue, with this speed noted as maximum swimming speed (Umax; Marras et al.,
2013). During the constant acceleration element of the protocol, UGT
was when fish began to engage an unsteady anaerobic gait, rapidly leading to fatigue (Marras et al., 2013). The aerobic gait comprised steady body-caudal swimming (rhythmic beating of the tail) that relies upon slow twitch oxidative muscle. The unsteady anaerobic gait comprised intermittent powerful tailbeats that propelled the fish to the front of the swim tunnel, after which it coasted to the back, before repeating the tailbeat, so-called‘burst and coast’ swimming that relies on recruitment of fast-twitch glycolytic muscle (Marras et al., 2013; Webb, 1998). When a fish fatigued and fell back against the rear screen of the swim tunnel, speed was immediately reduced to 1 BL s−1and it was allowed to recover for 30 min. The fish was then removed from the tunnel and placed in its holding tank to recover for at least 96 h before any subsequent protocol.
Measurements of O2uptake (ṀO2; mmol kg
−1h−1) were made at
each swimming speed between 1 and 5 BL s−1, by intermittent stopped-flow respirometry (Steffensen, 1989) over a 15 min cycle, providing two measures of ṀO2 for each speed. Water oxygen
concentration was recorded continuously using an optical oxygen probe and meter (Fibox, Pre-sens GmbH, Regensburg, Germany, www.presens.de) and associated software (Pre-sens Oxyview). The ṀO2was then calculated considering the rate of decline in oxygen
concentration, the water volume in the swim tunnel and the mass of the fish (McKenzie et al., 2003, 2007). For each individual fish and swim test, a least-squares exponential regression was applied to the relationship between swimming speed and the ṀO2measurements.
Extrapolation back to the y-intercept, a notional swimming speed of zero, was employed to correct for the contribution to ṀO2of locomotor
muscle activity (Brett, 1964; Fry, 1971). This was considered an estimate of standard metabolic rate (SMR). Active metabolic rate (AMR) was also calculated based on the exponential regression, by resolving ṀO2 at the maximum aerobic swimming speed (UGT).
Aerobic scope (AS) was calculated as AMR minus SMR.
CTmaxfor swimming (CTswim) protocol
Control trials were run to establish that fishes could swim uninterrupted for at least 9 h at 85% of their own UGT, at their
acclimation temperature of 26°C, which exceeded the duration of the CTswim protocol. Measurements of ṀO2 were collected for
10 min once every 30 min throughout, using the same methods as described for swimming respirometry above.
Fishes were then challenged to swim at 85% of their pre-determined UGTand exposed to stepwise warming at a rate of 1°C
every 30 min. The response variable in CTswim was fatigue, the
temperature at which the fish refused to swim and fell back against the rear screen. CTswimwas calculated as the last temperature step
completed plus the proportion of the last temperature step that the fish tolerated prior to fatigue. Immediately upon fatigue the fish was placed into a recovery tank containing water at 26°C. Once they had
RESEARCH ARTICLE Journal of Experimental Biology (2020) 223, jeb218602. doi:10.1242/jeb.218602
Journal
of
Experimental
regained normal swimming behavior they were moved to the holding tanks to recover for at least 96 h prior to any subsequent protocol. Measurements of ṀO2were made over the last 10 min at
each temperature step. The highest ṀO2measurement was identified
for each fish and named ṀO2max–CTswim.
Static CTmaxprotocol
Four individuals from each species were selected randomly and placed overnight in a 68 liter tank containing aerated water at 26°C, to recover from handling. The following morning, the water in the tank was warmed in steps of 1°C every 30 min. The tank was well aerated to maintain dissolved oxygen levels and avoid thermal stratification. Loss of equilibrium (LOE) was used as the indicator of thermal tolerance, involving complete loss of dorsoventral orientation. CTmaxwas then
recorded as the last temperature step fully completed plus the proportion of the last step that the fish endured prior to LOE. Upon LOE, each fish was rapidly transferred to a 68 liter recovery tank containing water at 26°C. After at least 30 min and when they had recovered normal swimming behavior, they were returned to their holding tank to recover for at least 96 h prior to further experimentation.
Statistical analysis
All statistics and models were produced using R v. 3.4.0 (http://www. R-project.org/) using the function lmer in package lme4 (https:// CRAN.R-project.org/package=lme4). Metabolic and performance variables were compared between species by t-test and within species by paired t-test, with P<0.05 taken as the limit for significance. Critical thermal (CT) values were examined using a general linear model with CT as the response variable, and species and protocol (CTmax versus CTswim) as responses variables. An interaction
between species and protocol was initially included but was non-significant, and so was removed and the model re-run. Linear mixed-effects (LME) models were constructed to examine the effect of warming on oxygen uptake during swimming, with oxygen uptake as the response variable, species as a categorical explanatory variable, treatment (warming versus constant 26°C) as a categorical explanatory variable, temperature as a continuous explanatory variable, and fish ID as a random effect. The full model was first fitted using restricted maximum likelihood (REML) estimation to compare possible random structures by likelihood ratio testing. We compared the random intercept model with fish identity nested within group as a random factor with random slope models where the slope estimates were allowed to vary among individuals for oxygen availability. Random slopes did not improve model parsimony and so only random intercepts were used for fish ID nested within group. Two-way interactions among species, treatment and temperature were initially included in the full model but removed when non-significant, and the models re-run. Model assumptions of linearity, normality and homogeneity of residuals were confirmed by inspecting plots of model residuals versus fitted values. Model r2values were computed
using the MuMIn 1.9.13 package for R (https://CRAN.R-project.org/ package=MuMIn). For LME models, this included marginal r2and
conditional r2, which indicate the variance explained by fixed factors,
and by both fixed and random factors, respectively (Nakagawa and Schielzeth, 2010). Data used for the analyses have been deposited in Dryad (doi:10.5061/dryad.cjsxksn2v).
RESULTS
Swimming performance and metabolic phenotype at acclimation temperature
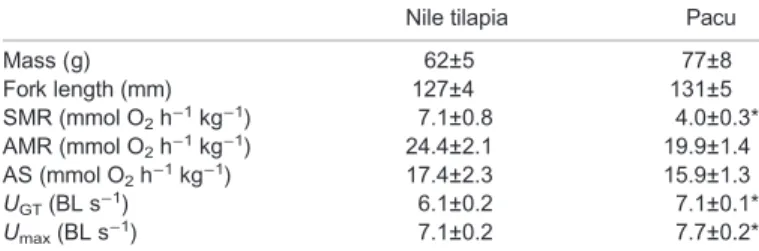
The two species showed a significant difference in their swimming performance; mean UGT and UMAX were higher in pacu than in
tilapia (Table 1). Mean SMR was lower in pacu than in tilapia, but there were no differences in AMR or AS (Table 1).
Tolerance of acute warming: CTswimversus CTmax
At their acclimation temperature, all fishes swam using a steady aerobic gait for at least 9 h at 85% of their UGTwithout any sign
whatsoever of fatigue. During the CTswimprotocol, all individual
fishes swam using the steady aerobic gait until a certain warm temperature, at which they started to engage unsteady burst and coast anaerobic swimming, which was followed by fatigue with the fish falling back against the rear screen or simply refusing to swim. The gait transition was qualitatively indistinguishable from that observed during the constant acceleration test. No fish lost equilibrium during the CTswim protocol and, in both species, the CTswim was
significantly lower than CTmax, by almost 2°C (Table 2, Fig. 1).
During CTmax, fish showed signs of erratic behavior and sideways
rolling prior to complete LOE. Neither of the warming protocols caused any mortality and all fish recovered normal behavior within 30 min of returning to water at 26°C. There were no differences in mean CTswimor CTmaxbetween the two species (Table 2, Fig. 1).
Effects of acute warming on metabolic rate
During the control swim, there was no change in ṀO2for 9 h in
either species (Fig. 2), and their mean ṀO2 (Table 3) was
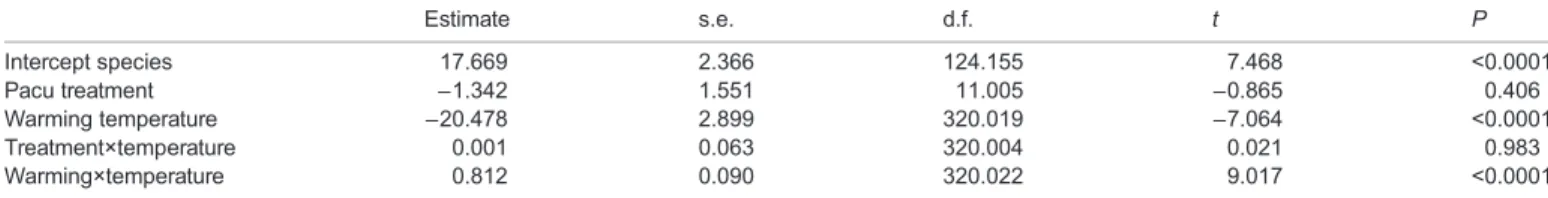
approximately 75% of their mean AMR (Table 1). The warming during CTswimwas associated with a profound increase in ṀO2for
both species (Fig. 1, Table 4). The mean ṀO2max (Table 3) was
significantly higher than each species’ mean AMR at their acclimation temperature (Table 1). The species did not differ in their ṀO2at 26°C at the outset of the CTswim, or in their ṀO2max. As a
result, the aerobic scope due to acute warming was similar in both species (Table 3). These species differences were reflected in the species effect in the LME models (Table 4).
DISCUSSION
The results demonstrate that, in two fish species, CTswimcan be used
to define tolerance of acute warming with fatigue as a sub-lethal endpoint rather than the more extreme incipient lethal endpoint of
Table 2. General linear model results for factors affecting critical thermal thresholds
Estimate s.e. t P
Intercept 39.9291 0.2048 195.002 <0.0001
Species Pacu −0.3619 0.2364 −1.531 0.137
Type CTswim −1.6219 0.2364 −6.860 <0.0001
Reference level for species is Nile tilapia; reference level for type is CTmax.
Model r2=0.641.
Table 1. Mean (±s.e.m.) mass, fork length, standard metabolic rate (SMR), active metabolic rate (AMR), aerobic scope (AS), maximal aerobic swimming speed (UGT) and maximal swimming speed (Umax) in Nile tilapia (Oreochromis niloticus) and pacu (Piaractus mesopotamicus)
Nile tilapia Pacu
Mass (g) 62±5 77±8 Fork length (mm) 127±4 131±5 SMR (mmol O2h−1kg−1) 7.1±0.8 4.0±0.3* AMR (mmol O2h−1kg−1) 24.4±2.1 19.9±1.4 AS (mmol O2h−1kg−1) 17.4±2.3 15.9±1.3 UGT(BL s−1) 6.1±0.2 7.1±0.1* Umax(BL s−1) 7.1±0.2 7.7±0.2*
n=8 per species, an asterisk indicates a significant difference between them (P≤0.05 by t-test).
Journal
of
Experimental
LOE at CTmax (Mauduit et al., 2016; Rezende et al., 2014). The
results indicate that, if exposed to acute warming events in the wild, the ability of fishes to perform aerobic metabolic work would be constrained at temperatures significantly below those at which their
survival was directly threatened, which has clear ecological implications. It is also true that the likelihood of these two species experiencing extreme warming events up to 38°C, the approximate temperature of their CTswim, is much higher than for events up to
40°C, the temperature of their CTmax(Wong et al., 2014; Collins
et al., 2019; Frölicher and Lauffkötter, 2018). This protocol needs to be extended to more fish species, but the present study establishes that CTswimcan provide an ecologically relevant endpoint that is
significantly more sensitive than CTmax.
In addition to being more sensitive than the CTmax, the CTswim
protocol is interesting because the underlying mechanisms for fatigue seem clearly related to capacity for oxygen supply. Various studies have demonstrated a disconnect between CTmax and
capacity for oxygen supply; whether CTmax is oxygen-dependent
appears to vary with species. The physiological mechanisms of oxygen-independent CTmaxare not understood and may be linked to
effects of acute warming on membrane integrity and nerve function. These points have all been raised to argue against the universality of the OCLTT framework (Ern et al., 2014, 2016, 2017; Jutfelt et al., 2019; Wang et al., 2014). By contrast, the CTswimprotocol
specifically targets metabolic constraints caused by warming. The control swimming at 85% of UGTproved that both fish species could
perform sustained aerobic work at a constant metabolic rate for very extended periods, with no signs whatsoever of fatigue. Therefore, fatigue during the CTswim was not due to the metabolic work of
swimming but, rather, to the metabolic load imposed by warming. It is very interesting that, at a high temperature close to their CTswim,
all individuals of both species began to engage unsteady burst and coast swimming in order to maintain station in the water current, which rapidly led to fatigue. This response was qualitatively indistinguishable from the gait transition observed during an incremental swim challenge, which indicates that it was due to a similar underlying mechanism.
The teleost heart is an aerobic organ and obtains much of its oxygen from venous return in the single circulation, blood that has unloaded much of its oxygen to respiring tissues (Farrell and Jones, 1992; Jones and Randall, 1978). It has been suggested that during an incremental swim challenge, fishes engage the gait transition towards anaerobic swimming when oxygen levels in venous blood returning to the heart drop below a critical level. By engaging the white muscle, the fish reduces rates of oxygen extraction by the working red muscle and so venous oxygen supply to the heart is assured (Farrell and Clutterham, 2003; McKenzie and Claireaux, 2010; McKenzie et al., 2004). The observed gait transition prior to fatigue during the CTswimmay suggest a similar decline in venous
oxygen levels, which risked compromising oxygen supply to the working heart (McKenzie and Claireaux, 2010). That is, the cardiorespiratory system could no longer meet the combined oxygen demands of thermal acceleration of metabolism and sustained aerobic exercise. Steinhausen et al. (2008) found that
37 38 39 40 41 CTmax CTswim Pacu Nile tilapia Te mperature (°C)
Fig. 1. Box plot of data for CTswim(orange data) or CTmax(red data) in two
fish species, Nile tilapia (left) and pacu (right). Boxplot lower and upper hinges represent the 25th and 75th percentiles, respectively; the horizontal line within the box is the median; the length of whiskers represents the range of data points between each hinge and 1.5× the difference between the 25th and 75th percentiles. Data beyond these limits are outliers. Each point is one fish, n=8 in all cases. 40 30 20 10 26 28 30
Nila tilapia Pacu
26°C Warming
Oxygen uptake (mmol O
2 h –1 kg –1) 32 34 36 38 Temperature (°C) 26 28 30 32 34 36 38
Fig. 2. Oxygen uptake during the CTswimprotocol, when Nile tilapia (left)
or pacu (right) were swimming aerobically and warmed 1°C every 30 min, from their acclimation temperature of 26°C (red data and curve), or when the same fishes swam aerobically for the same period at their acclimation temperature (blue data and curve). Swimming speed in both cases was set at 85% of each individual’s gait transition speed in an incremental swim trial (see Materials and Methods for more details). The shaded area is the 95% confidence interval at each temperature. Each point is a fish measured at that temperature, or that interval for the control swim at 26°C.
Table 3. Mean (±s.e.m.) values ofṀO2at two different moments during
CTswim[ṀO2at acclimation temperature (26°C) and the maximum
ṀO2measured (ṀO2max)] and the difference between them (CTswim
scope) in Nile tilapia and pacu
Nile tilapia Pacu
ṀO2(26°C) 18.0±1.0 16.8±1.8
ṀO2max 32.6±2.1* 30.6±1.2*
CTswimscope 14.7±1.4 13.8±1.0
ṀO2is in mmol O2h−1kg−1, n=8 per species. An asterisk indicates a significant
difference between ṀO2at 26°C and ṀO2max(P<0.05 by paired t-test).
RESEARCH ARTICLE Journal of Experimental Biology (2020) 223, jeb218602. doi:10.1242/jeb.218602
Journal
of
Experimental
fatigue from exercise in the chinook salmon during acute warming coincided with cardiac pumping capacity reaching its maximum. There is other evidence that the capacity of the heart to maintain tissue oxygen supply may be a critical element of tolerance of acute and chronic warming in fishes (Clark et al., 2008; Sandblom et al., 2016), so this is an interesting issue for future research with the CTswimprotocol.
The methodology to properly explore the Fry paradigm and the OCLTT hypothesis is to measure SMR and AMR in fish held at a range of temperatures, to construct an AS performance curve. This is very time-consuming and very difficult to perform on a single individual (Claireaux et al., 2006; Claireaux and Lefrançois, 2007; Eliason et al., 2011), which seriously constrains exploration of the universality of the mechanisms across species, and exploration of questions regarding individual variation and phenotypic plasticity within species. Although we cannot be absolutely certain of the mechanism that led to fatigue in the CTswim test, the evidence
clearly indicates that it was linked to problems with meeting metabolic oxygen demand. This is consistent with the OCLTT hypothesis. Therefore, the CTswimcan be used directly to explore
the mechanisms underlying warming-induced fatigue, to confirm that they do reflect constraints on meeting metabolic oxygen demand, and to establish whether the response is universal across fish species. The CTswim protocol could also be used to explore
questions regarding plasticity and resilience of fish species to climate change and thermal stress. The rate of environmental change associated with global warming is too fast to be coped with by adaptive evolutionary responses and, therefore, the resilience of species will depend upon migration, the existence of tolerant genotypes, and phenotypic plasticity (Bell, 2013; Gonzalez and Bell, 2013). The CTswimprotocol is ideal for evaluating individual
variation in thermal sensitivity, based upon oxygen supply capacity, and the potential for phenotypic plasticity to offset any constraints. It is interesting that the ṀO2maxwas very significantly higher than the
AMR of each species at their acclimation temperature. The exponential increase in ṀO2during the CTswimwas purely due to the effects of
temperature on metabolism, as ṀO2 did not change when fishes
swam at 26°C for 9 h. This shows that acute warming increases the cardiorespiratory capacity of these two tropical species, in an immediate and rapid manner. Claireaux et al. (2006) measured UGT
(called Umax in that study) and associated respiratory metabolism
in European seabass, Dicentrarchus labrax, that were seasonally acclimatized to temperatures between 7 and 30°C. They found that warming was associated with an increased capacity for aerobic metabolism, energy flux and metabolic scope. The current data indicate that these effects can also be seen during acute warming. When Steinhausen et al. (2008) exposed chinook salmon to acute warming when swimming at 75% of their critical swimming speed (Ucrit), the
thermal effects on oxygen uptake were much less pronounced than the exponential increase in metabolic rate observed in Nile tilapia and pacu. Salmonids are considered rather stenothermic species (Eliason et al., 2011). The remarkable cardiorespiratory plasticity in response to
acute warming by these two tropical species may reflect an evolutionary history of exposure to warm and changeable water temperatures. The mechanisms underlying this plasticity remain to be explored, but a release of catecholamines and increased performance of the cardiac pump may be of major importance (Jayasundara and Somero, 2013; Nyboer and Chapman, 2018).
In conclusion, fatigue in a CTswimprotocol provides a sub-lethal
threshold for tolerance of warming that is relevant because of the ecological importance of swimming for fishes and that is more sensitive to potential extreme events than LOE in a CTmax. It also
has the advantage that the underlying mechanism for fatigue in CTswimappears to be linked to constraints on tissue oxygen supply,
such that this can now be explicitly investigated. The protocol has applications in testing hypotheses such as the OCLTT (Jutfelt et al., 2018; Pörtner, 2010) and gill oxygen limitation (Lefevre et al., 2017, 2018; Pauly and Cheung, 2017), or in exploring how and why individuals, populations and species might differ in their sub-lethal tolerance of warming (Anttila et al., 2013; Fangue et al., 2009; Mauduit et al., 2016; Roze et al., 2013; Schulte et al., 2011).
Acknowledgements
The authors are grateful to Cesar Polettini, of Piscicultura Polettini, for donating the fish.
Competing interests
The authors declare no competing or financial interests.
Author contributions
Conceptualization: F.R.B., A.J.E., S.S.K., F.R., E.W.T., D.J.M.; Methodology: F.R.B., A.J.E., S.S.K., E.W.T., D.J.M.; Formal analysis: F.R.B., D.J.M.; Investigation: F.R.B., A.J.E., S.S.K., E.W.T., D.J.M.; Resources: F.R., E.W.T.; Data curation: F.R.B., A.J.E., S.S.K.; Writing - original draft: F.R.B., D.J.M.; Writing - review & editing: F.R.B., A.J.E., S.S.K., F.R., E.W.T., D.J.M.; Supervision: F.R., D.J.M.; Project administration: F.R.; Funding acquisition: S.S.K., F.R.
Funding
This study was funded in part by the Fundação Coordenação de Aperfeiçoamento de Pessoal de Nı́vel Superior – CAPES (Doctoral fellowship to F.R.B.); a Natural Environment Research Council Advanced Fellowship (NE/J019100/1 to S.S.K.); the Conselho Nacional de Desenvolvimento Cientı́fico e Tecnológico – CNPq (401061/ 2014-0 to E.W.T.); an International Exchanges Grant from the Royal Society of London (S.S.K. and F.T.R.), and the Centre National de la Recherche Scientifique (D.J.M.). Deposited in PMC for immediate release.
Data availability
Data used for the analyses have been deposited in the Dryad Digital Repository (McKenzie, 2020): cjsxksn2v.
References
Anttila, K., Dhillon, R. S., Boulding, E. G., Farrell, A. P., Glebe, B. D., Elliott, J. A. K., Wolters, W. R. and Schulte, P. M. (2013). Variation in temperature tolerance among families of Atlantic salmon (Salmo salar) is associated with hypoxia tolerance, ventricle size and myoglobin level. J. Exp. Biol. 216, 1183-1190. doi:10.1242/jeb.080556
Bell, G. (2013). Evolutionary rescue and the limits of adaptation. Philos. Trans. R. Soc. B Biol. Sci. 368, 20120080. doi:10.1098/rstb.2012.0080 Bell, W. H. and Terhune, L. D. B. (1970). Water tunnel design for fisheries research.
Fish. Resour. Board Canada Tech. Rep. 195, 1-69.
Table 4. Linear mixed-effects model results for factors affecting oxygen uptake during CTswim
Estimate s.e. d.f. t P Intercept species 17.669 2.366 124.155 7.468 <0.0001 Pacu treatment −1.342 1.551 11.005 −0.865 0.406 Warming temperature −20.478 2.899 320.019 −7.064 <0.0001 Treatment×temperature 0.001 0.063 320.004 0.021 0.983 Warming×temperature 0.812 0.090 320.022 9.017 <0.0001
Reference level for species is Nile tilapia; reference level for treatment is 26°C constant. Model includes individual as a random effect. Model marginal r2=0.430,
conditional r2=0.673.
Journal
of
Experimental
Brett, J. R. (1964). The respiratory metabolism and swimming performance of young sockeye salmon. J. Fish. Res. Board Canada 21, 1183-1226. doi:10.1139/ f64-103.
Claireaux, G. and Lefrançois, C. (2007). Linking environmental variability and fish performance: integration through the concept of scope for activity. Philos. Trans. R. Soc. Lond. B. Biol. Sci. 362, 2031-2041. doi:10.1098/rstb.2007.2099 Claireaux, G., Couturier, C. and Groison, A.-L. (2006). Effect of temperature on
maximum swimming speed and cost of transport in juvenile European sea bass (Dicentrarchus labrax). J. Exp. Biol. 209, 3420-3428. doi:10.1242/jeb.02346 Clark, T. D., Sandblom, E., Cox, G. K., Hinch, S. G. and Farrell, A. P. (2008).
Circulatory limits to oxygen supply during an acute temperature increase in the Chinook salmon (Oncorhynchus tshawytscha). Am. J. Physiol. Regul. Integr. Comp. Physiol. 295, R1631-R1639. doi:10.1152/ajpregu.90461.2008
Collins, M., Sutherland, M., Bouwer, L., Cheong, S.-M., Frö licher, T., Jacot Des Combes, H., Koll Roxy, M., Losada, I., McInnes, K., Ratter, B. et al. (2019). Extremes, abrupt changes and managing risk. In IPCC Special Report on the Ocean and Cryosphere in a Changing Climate (ed. H.-O. Pö rtner, D. C. Roberts, V. Masson-Delmotte et al.), pp. 589-655. Cambridge and New York: Cambridge University Press (in press).
Eliason, E. J., Clark, T. D., Hague, M. J., Hanson, L. M., Gallagher, Z. S., Jeffries, K. M., Gale, M. K., Patterson, D. A., Hinch, S. G. and Farrell, A. P. (2011). Differences in thermal tolerance among sockeye salmon populations. Science 332, 109-112. doi:10.1126/science.1199158
Ern, R., Huong, D. T. T., Phuong, N. T., Wang, T. and Bayley, M. (2014). Oxygen delivery does not limit thermal tolerance in a tropical eurythermal crustacean. J. Exp. Biol. 217, 809-814. doi:10.1242/jeb.094169
Ern, R., Norin, T., Gamperl, A. K. and Esbaugh, A. J. (2016). Oxygen dependence of upper thermal limits in fishes. J. Exp. Biol. 219, 3376-3383. doi:10.1242/jeb. 143495
Ern, R., Johansen, J. L., Rummer, J. L. and Esbaugh, A. J. (2017). Effects of hypoxia and ocean acidification on the upper thermal niche boundaries of coral reef fishes. Biol. Lett. 13, 20170135. doi:10.1098/rsbl.2017.0135
Fangue, N. A., Richards, J. G. and Schulte, P. M. (2009). Do mitochondrial properties explain intraspecific variation in thermal tolerance? J. Exp. Biol. 212, 514-522. doi:10.1242/jeb.024034
Farrell, A. P. (2016). Pragmatic perspective on aerobic scope: peaking, plummeting, pejus and apportioning. J. Fish Biol. 88, 322-343. doi:10.1111/jfb.12789 Farrell, A. P. and Clutterham, S. M. (2003). On-line venous oxygen tensions in
rainbow trout during graded exercise at two acclimation temperatures. J. Exp. Biol. 206, 487-496. doi:10.1242/jeb.00100
Farrell, A. P. and Jones, D. R. (1992). The heart. In Fish Physiology, Vol. 12A (ed. W. S. Hoar, D. J. Randall and A. P. Farrell), pp. 1-88. San Diego: Academic Press. Frö licher, T. L. and Laufkötter, C. (2018). Emerging risks from marine heat waves.
Nat. Commun. 9, 650. doi:10.1038/s41467-018-03163-6
Fry, F. E. J. (1947). The effects of the environment on animal activity. Univ. Toronto Stud. Biol. Ser. 55, 1-62.
Fry, F. E. J. (1957). The aquatic respiration of fish. In The Physiology of Fishes, Vol. 1 (ed. M. E. Brown), pp. 1-63. New York: Academic Press.
Fry, F. E. J. (1971). The effect of environmental factors on the physiology of fish. In Fish Physiology, Vol. 6 (ed. W. S. Hoar and D. J. Randall), pp. 1-98. New York: Academic Press.
Gonzalez, A. and Bell, G. (2013). Evolutionary rescue and adaptation to abrupt environmental change depends upon the history of stress. Philos. Trans. R. Soc. B Biol. Sci. 368, 20120079. doi:10.1098/rstb.2012.0079
IPCC. (2014). Climate change 2014: synthesis report. In Contribution of Working Groups I, II and III to the Fifth Assessment Report of the Intergovernmental Panel on Climate Change (ed. Core Writing Team, R. K. Pachauri and L. A. Meyer), 151pp. Geneva, Switzerland: IPCC.
IPCC. (2019). Summary for policymakers. In IPCC Special Report on the Ocean and Cryosphere in a Changing Climate (ed. H.-O. Pö rtner, D. C. Roberts, V. Masson-Delmotte et al.), pp. 3-35. Geneva, Switzerland: IPCC (in press).
Jayasundara, N. and Somero, G. N. (2013). Physiological plasticity of cardiorespiratory function in a eurythermal marine teleost, the longjaw mudsucker, Gillichthys mirabilis. J. Exp. Biol. 216, 2111-2121. doi:10.1242/jeb. 083873
Jones, D. R. and Randall, D. J. (1978). The respiratory and circulatory systems during exercise. In Fish Physiology, Vol. 7 (ed. W. S. Hoar and D. J. Randall), pp. 1-59. New York: Academic Press.
Jørgensen, C., Peck, M. A., Antognarelli, F., Azzurro, E., Burrows, M. T., Cheung, W. W. L., Cucco, A., Holt, R. E., Huebert, K. B., Marras, S. et al. (2012). Conservation physiology of marine fishes: advancing the predictive capacity of models. Biol. Lett. 8, 900-903. doi:10.1098/rsbl.2012.0609 Jutfelt, F., Norin, T., Ern, R., Overgaard, J., Wang, T., McKenzie, D. J., Lefevre,
S., Nilsson, G. E., Metcalfe, N. B., Hickey, A. J. R. et al. (2018). Oxygen-and capacity-limited thermal tolerance: blurring ecology and physiology. J. Exp. Biol. 221, jeb169615. doi:10.1242/jeb.169615
Jutfelt, F., Roche, D. G., Clark, T. D., Norin, T., Binning, S. A., Speers-Roesch, B., Amcoff, M., Morgan, R., Andreassen, A. H. and Sundin, J. (2019). Brain cooling marginally increases acute upper thermal tolerance in Atlantic cod. J. Exp. Biol. 222, jeb208249. doi:10.1242/jeb.208249
Lefevre, S. (2016). Are global warming and ocean acidification conspiring against marine ectotherms? A meta-analysis of the respiratory effects of elevated temperature, high CO2and their interaction. Conserv. Physiol. 4, cow009. doi:10.
1093/conphys/cow009
Lefevre, S., McKenzie, D. J. and Nilsson, G. E. (2017). Models projecting the fate of fish populations under climate change need to be based on valid physiological mechanisms. Glob. Chang. Biol. 23, 3449-3459. doi:10.1111/gcb.13652 Lefevre, S., McKenzie, D. J. and Nilsson, G. E. (2018). In modelling effects of
global warming, invalid assumptions lead to unrealistic projections. Glob. Chang. Biol. 24, 553-556. doi:10.1111/gcb.13978
Lutterschmidt, W. I. and Hutchison, V. H. (1997). The critical thermal maximum: history and critique. Can. J. Zool. 75, 1561-1574. doi:10.1139/z97-783 Marras, S., Killen, S. S., Domenici, P., Claireaux, G. and McKenzie, D. J. (2013).
Relationships among traits of aerobic and anaerobic swimming performance in individual European sea bass Dicentrarchus labrax. PLoS ONE 8, e72815. doi:10. 1371/journal.pone.0072815
Mauduit, F., Domenici, P., Farrell, A. P., Lacroix, C., Le Floch, S., Lemaire, P., Nicolas-Kopec, A., Whittington, M., Zambonino-Infante, J. L. and Claireaux, G. (2016). Assessing chronic fish health: an application to a case of an acute exposure to chemically treated crude oil. Aquat. Toxicol. 178, 197-208. doi:10. 1016/j.aquatox.2016.07.019
McKenzie, D. (2020). Using aerobic exercise to evaluate sub-lethal tolerance of acute warming in fishes, v3. Dryad Dataset. doi:10.5061/dryad.cjsxksn2v McKenzie, D. J. and Claireaux, G. (2010). The effects of environmental factors on
the physiology of aerobic exercise. In Fish Locomotion: An Etho-ecological Perspective (ed. P. Domenici and B. G. Kapoor), pp. 308-344. Boca Raton: CRC Press. doi:10.1201/b10190-10
McKenzie, D. J., Martinez, R., Morales, A., Acosta, J., Morales, R., Taylor, E. W., Steffensen, J. F. and Estrada, M. P. (2003). Effects of growth hormone transgenesis on metabolic rate, exercise performance and hypoxia tolerance in tilapia hybrids. J. Fish Biol. 63, 398-409. doi:10.1046/j.1095-8649.2003.00162.x McKenzie, D. J., Wong, S., Randall, D. J., Egginton, S., Taylor, E. W. and Farrell, A. P. (2004). The effects of sustained exercise and hypoxia upon oxygen tensions in the red muscle of rainbow trout. J. Exp. Biol. 207, 3629-3637. doi:10.1242/jeb. 01199
McKenzie, D. J., Garofalo, E., Winter, M. J., Ceradini, S., Verweij, F., Day, N., Hayes, R., van der Oost, R., Butler, P. J., Chipman, J. K. et al. (2007). Complex physiological traits as biomarkers of the sub-lethal toxicological effects of pollutant exposure in fishes. Philos. Trans. R. Soc. Lond. B Biol. Sci. 362, 2043-2059. doi:10.1098/rstb.2007.2100
McKenzie, D. J., Steffensen, J. F., Taylor, E. W. and Abe, A. S. (2012). The contribution of air breathing to aerobic scope and exercise performance in the banded knifefish Gymnotus carapo L. J. Exp. Biol. 215, 1323-1330. doi:10.1242/ jeb.064543
McKenzie, D. J., Axelsson, M., Chabot, D., Claireaux, G., Cooke, S. J., Corner, R. A., De Boeck, G., Domenici, P., Guerreiro, P. M., Hamer, B. et al. (2016). Conservation physiology of marine fishes: state of the art and prospects for policy. Conserv. Physiol. 4, cow046. doi:10.1093/conphys/cow046
Nakagawa, S. and Schielzeth, H. (2010). Repeatability for Gaussian and non-Gaussian data: a practical guide for biologists. Biol. Rev. 85, 935-956. doi:10. 1111/j.1469-185X.2010.00141.x
Nyboer, E. A. and Chapman, L. J. (2018). Cardiac plasticity influences aerobic performance and thermal tolerance in a tropical, freshwater fish at elevated temperatures. J. Exp. Biol. 221, jeb178087. doi:10.1242/jeb.178087
Pauly, D. and Cheung, W. W. L. (2017). Sound physiological knowledge and principles in modeling shrinking of fishes under climate change. Glob. Chang. Biol. 24, e15-e26. doi:10.1111/gcb.13831
Perry, A. L., Low, P. J., Ellis, J. R. and Reynolds, J. D. (2005). Climate change and distribution shifts in marine fishes. Science 308, 1912-1915. doi:10.1126/science. 1111322
Pö rtner, H.-O. (2010). Oxygen- and capacity-limitation of thermal tolerance: a matrix for integrating climate-related stressor effects in marine ecosystems. J. Exp. Biol. 213, 881-893. doi:10.1242/jeb.037523
Pö rtner, H.-O. and Farrell, A. P. (2008). Physiology and climate change. Science 322, 690-692. doi:10.1126/science.1163156
Pö rtner, H. O. and Knust, R. (2007). Climate change affects marine fishes through the oxygen limitation of thermal tolerance. Science 315, 95-97. doi:10.1126/ science.1135471
Pö rtner, H.-O., Bock, C. and Mark, F. C. (2017). Oxygen- and capacity-limited thermal tolerance: Bridging ecology and physiology. J. Exp. Biol. 220, 2685-2696. doi:10.1242/jeb.134585
Rezende, E. L., Castañeda, L. E. and Santos, M. (2014). Tolerance landscapes in thermal ecology. Funct. Ecol. 28, 799-809. doi:10.1111/1365-2435.12268 Roze, T., Christen, F., Amerand, A. and Claireaux, G. (2013). Trade-off between
thermal sensitivity, hypoxia tolerance and growth in fish. J. Therm. Biol. 38, 98-106. doi:10.1016/j.jtherbio.2012.12.001
Sandblom, E., Clark, T. D., Grä ns, A., Ekström, A., Brijs, J., Sundström, L. F., Odelströ m, A., Adill, A., Aho, T. and Jutfelt, F. (2016). Physiological constraints to climate warming in fish follow principles of plastic floors and concrete ceilings. Nat. Commun. 7, 11447. doi:10.1038/ncomms11447
RESEARCH ARTICLE Journal of Experimental Biology (2020) 223, jeb218602. doi:10.1242/jeb.218602
Journal
of
Experimental
Schulte, P. M. (2015). The effects of temperature on aerobic metabolism: towards a mechanistic understanding of the responses of ectotherms to a changing environment. J. Exp. Biol. 218, 1856-1866. doi:10.1242/jeb.118851
Schulte, P. M., Healy, T. M. and Fangue, N. A. (2011). Thermal performance curves, phenotypic plasticity, and the time scales of temperature exposure. Integr. Comp. Biol. 51, 691-702. doi:10.1093/icb/icr097
Smale, D. A., Wernberg, T., Oliver, E. C. J., Thomsen, M., Harvey, B. P., Straub, S. C., Burrows, M. T., Alexander, L. V., Benthuysen, J. A., Donat, M. G. et al. (2019). Marine heatwaves threaten global biodiversity and the provision of ecosystem services. Nat. Clim. Chang. 9, 306-312. doi:10.1038/s41558-019-0412-1 Steffensen, J. F. (1989). Some errors in respirometry of aquatic breathers: how to
avoid and correct for them. Fish Physiol. Biochem. 6, 49-59. doi:10.1007/ BF02995809
Steinhausen, M. F., Sandblom, E., Eliason, E. J., Verhille, C. and Farrell, A. P. (2008). The effect of acute temperature increases on the cardiorespiratory
performance of resting and swimming sockeye salmon (Oncorhynchus nerka). J. Exp. Biol. 211, 3915-3926. doi:10.1242/jeb.019281
Wang, T., Lefevre, S., Iversen, N. K., Findorf, I., Buchanan, R. and McKenzie, D. J. (2014). Anaemia only causes a small reduction in the upper critical temperature of sea bass: is oxygen delivery the limiting factor for tolerance of acute warming in fishes? J. Exp. Biol. 217, 4275-4278. doi:10.1242/jeb.104166 Webb, P. W. (1998). Swimming. In The Physiology of Fishes (ed. D. D. Evans),
pp. 1-38. Boca Raton: CRC Press.
Wong, P. P., Losada, I. J., Gattuso, J.-P., Hinkel, J., Khattabi, A., McInnes, K. L., Saito, Y. and Sallenger, A. (2014). Coastal systems and low-lying areas. In Climate Change 2014: Impacts, Adaptation, and Vulnerability. Part A: Global and Sectoral Aspects. Contribution of Working Group II to the Fifth Assessment Report of the Intergovernmental Panel on Climate Change (ed. C. B. Field, V. R. Barros, D. J. Dokken, K. J. Mach, M. D. Mastrandrea, T. E. Bilir, M. Chatterjee, K. L. Ebi, Y. O. Estrada and R. C. Genova et al.), pp. 361-409. Cambridge and New York: Cambridge University Press.