HAL Id: hal-00739012
https://hal.archives-ouvertes.fr/hal-00739012
Submitted on 3 Aug 2020
HAL is a multi-disciplinary open access
archive for the deposit and dissemination of
sci-entific research documents, whether they are
pub-lished or not. The documents may come from
teaching and research institutions in France or
abroad, or from public or private research centers.
L’archive ouverte pluridisciplinaire HAL, est
destinée au dépôt et à la diffusion de documents
scientifiques de niveau recherche, publiés ou non,
émanant des établissements d’enseignement et de
recherche français ou étrangers, des laboratoires
publics ou privés.
Preformed and regenerated phosphate in ocean general
circulation models: can right total concentrations be
wrong?
O. Duteil, W. Koeve, A. Oschlies, O. Aumont, D. Bianchi, L. Bopp, E.
Galbraith, R. Matear, J. K. Moore, J. L. Sarmiento, et al.
To cite this version:
O. Duteil, W. Koeve, A. Oschlies, O. Aumont, D. Bianchi, et al.. Preformed and regenerated
phos-phate in ocean general circulation models: can right total concentrations be wrong?. Biogeosciences,
European Geosciences Union, 2012, 9 (5), pp.1797-1807. �10.5194/bg-9-1797-2012�. �hal-00739012�
Biogeosciences, 9, 1797–1807, 2012 www.biogeosciences.net/9/1797/2012/ doi:10.5194/bg-9-1797-2012
© Author(s) 2012. CC Attribution 3.0 License.
Biogeosciences
Preformed and regenerated phosphate in ocean general circulation
models: can right total concentrations be wrong?
O. Duteil1, W. Koeve1, A. Oschlies1, O. Aumont2, D. Bianchi3, L. Bopp4, E. Galbraith5, R. Matear6, J. K. Moore7,
J. L. Sarmiento3, and J. Segschneider8
1GEOMAR, Helmholtz-Zentrum f¨ur Ozeanforschung Kiel, D¨usternbrooker Weg 20, 24105 Kiel, Germany 2Centre IRD de Bretagne – BP70 – 29280 Plouzane, France
3AOS Program, Princeton University, Forrestal Campus, P.O. Box CN710, Princeton, NJ 08544–0710, USA
4Laboratoire des Sciences du Climat et de l’Environnement, Orme des Merisiers, CE Saclay, 91191 Gif sur Yvette, France 5Department of Earth and Planetary Science, McGill University, Montreal, QC, Canada
6CSIRO Marine and Atmosphere Research, Hobart, TAS, Australia
7Department of Earth System Science, University of California, Irvine, CA 92697, USA 8Max-Planck-Institut f¨ur Meteorologie, Bundesstrasse 53, 20146 Hamburg, Germany
Correspondence to: O. Duteil ([email protected])
Received: 6 December 2011 – Published in Biogeosciences Discuss.: 21 December 2011 Revised: 10 April 2012 – Accepted: 24 April 2012 – Published: 23 May 2012
Abstract. Phosphate distributions simulated by seven
state-of-the-art biogeochemical ocean circulation models are eval-uated against observations of global ocean nutrient distri-butions. The biogeochemical models exhibit different struc-tural complexities, ranging from simple nutrient-restoring to multi-nutrient NPZD type models. We evaluate the simula-tions using the observed volume distribution of phosphate. The errors in these simulated volume class distributions are significantly larger when preformed phosphate (or regener-ated phosphate) rather than total phosphate is considered. Our analysis reveals that models can achieve similarly good fits to observed total phosphate distributions for a very dif-ferent partitioning into preformed and regenerated nutrient components. This has implications for the strength and po-tential climate sensitivity of the simulated biological carbon pump. We suggest complementing the use of total nutrient distributions for assessing model skill by an evaluation of the respective preformed and regenerated nutrient components.
1 Introduction
The distribution of phosphate (PO4) in the ocean is controlled
by a wide range of processes. In the absence of major exter-nal sources, interexter-nal processes are the main drivers, namely
the physical circulation and the marine biology. PO4is
incor-porated into organic matter by photosynthetic phytoplankton in the euphotic zone. A fraction of this organic matter escapes recycling in the surface layer and is exported into the ocean interior. Remineralisation of organic matter by bacteria and zooplankton releases nutrients such as PO4 and consumes
oxygen. This phosphate is called “regenerated phosphate”. The remaining phosphate is the biotically unutilized surface phosphate, which enters the ocean by subduction during wa-ter mass formation, and is called “preformed phosphate”. Ac-cording to observational estimates, the preformed phosphate makes up for about 60 % of the global ocean’s phosphate in-ventory, whereas regenerated phosphate derived from rem-ineralisation of organic matter makes up for the remaining 40 % (Ito and Follows, 2005).
Patterns of PO4 concentrations as well as the
partition-ing into preformed and regenerated components are sensi-tive to ocean circulation, export production and reminerali-sation length scale. For example, a more active biology in-creases the transfer of phosphate from surface to intermedi-ate depths by remineralisation, depleting surface nutrients. Consequently, the amount of phosphate subducted at high latitudes, i.e. the preformed phosphate, decreases as well. As another example, a more vigorous overturning results in higher supply rates of nutrients from the deep ocean to the
1798 O. Duteil et al.: Preformed and regenerated PO4in OGCMs
Table 1. General description of the models used in this study. Model OPA-PISCES
MPIOM-HAMOCC
CCSM3-BEC UVIC om1p7-BLINGv0 CSIRO MOM-P2A Resolution 0.5 (eq.) to 2 × 2 0.5(NA) to 1.5 × 1.5 0.9 (eq.) to 2 × 3.6 1.8 × 3.6 0.6 (eq.) to 2 × 3 3.2 × 5.6 3.75 × 4 Levels 31 40 25 19 28 21 24
Mixed Layer TKE TKE KPP – KPP – – Lateral
diffusion
Iso-GM Iso-GM Iso-GM Iso-GM Iso-GM Iso-GM Iso-GM
Wind stress ERS NCEP-NCAR NCEP-NCAR NCEP-NCAR CORE Previous cou-pled exp. ECMWF Biology NPZD NPZD NPZD NPZD N N OCMIP (N) Boxes 24 18 18 9 4 4 5 2 phy., 2 zoo., NO3, PO4, Detritus, O2, Carb., Iron, Sil. 1 phy.∗, 1 zoo., NO3, PO4, Detritus, O2, Carb., Iron, Sil 4 phy., 1 zoo., NO3, PO4, Detritus, O2, Carb., Iron, Sil. 2 phy., 1 zoo., NO3, PO4, Detritus, O2, DIC, TALK implicit PZD, PO4, DOP, O2, Iron implicit PZD, PO4, O2, DIC, TALK implicit PZD, PO4, DOP, O2, DIC, TALK
Ref. Aumont and Bopp (2006) Maier-Reimer et al. (2005) Krishnamurty et al. (2009) Oschlies et al. (2008) Galbraith et al. (2010) Matear and Hirst (2003) Gnanadesikan et al. (2004)
∗Implicitely partionned into diatoms and coccolitophores depending on available silicate.
euphotic zone, which will increase surface nutrient levels. Thereby, the preformed PO4pool increases whereas the
re-generated PO4pool decreases. A model that correctly
sim-ulates biogeochemical and physical processes should repre-sent not only the total phosphate distribution, but also repro-duce its preformed and regenerated pools in a realistic way.
The global PO4distribution is characterised by generally
low PO4values in surface waters and high concentrations in
the deep ocean, with maximum concentrations often found in intermediate waters associated with low oxygen concen-trations. This picture is usually well reproduced by ocean general circulation models, as depicted by model intercom-parison studies (Najjar et al., 2007), which have been con-ducted for instance in the context of the Ocean Carbon-cycle Model Intercomparison Project (OCMIP). OCMIP compared models with a simplistic representation of marine biogeo-chemistry, i.e. restoring of nutrients at the sea surface and no explicit representation of phytoplankton. More complex biological models were used in the Coupled Carbon Cy-cle Climate Model Intercomparison Project (C4MIP) that focussed on the coupling of climate and the carbon cycle (Friedlingstein et al., 2006). Schneider et al. (2008) assessed surface PO4, export and primary production simulated by
three C4MIP models. Carbon fluxes at the ocean atmosphere
interface have been assessed using a suite of fully coupled climate models (Roy et al., 2011).
All these studies focused on total nutrient concentrations. The partitioning between regenerated and preformed pools has, to our knowledge, not been considered in previous model intercomparison studies. Previous studies aimed at a better understanding of the interactions of climate and bio-geochemistry have found preformed PO4to be an excellent
indicator of atmospheric pCO2, with a positive correlation
between the atmospheric CO2levels and the relative amount
of preformed phosphate in the ocean interior (Ito and Fol-lows, 2005; Marinov et al., 2008). By contrast, the total sur-face nutrient inventory is not necessarily correlated with at-mospheric pCO2and oceanic circulation changes.
The objective of this study is to illustrate that additional information can be gained by explicitly considering pre-formed and regenerated nutrients pools in the evaluation of biogeochemical models. We here exploit 7 state-of-the-art coupled biogeochemical-circulation models to demonstrate how the separation of the phosphate into preformed and re-generate concentrations can improve the assessment of the simulations.
O. Duteil et al.: Preformed and regenerated PO4in OGCMs 1799
2 Datasets
Seven global biogeochemical-circulation models used in previous studies are considered here (see Table 1 for de-tails): OPA-PISCES (Aumont and Bopp, 2006), MPIOM-HAMOCC (Maier-Reimer, 1993; Maier-Reimer et al., 2005), CCSM3-BEC (Krishnamurthy et al., 2009), UVIC2.8 (Oschlies et al., 2008), om1p7-BLINGv0 (Galbraith et al., 2010), CSIRO (Matear and Hirst, 2003), MOM P2A (Gnanadesikan et al., 2004).
Given that the partitioning into preformed and regenerated nutrients is likely sensitive to the models’ parameter choices and the forcing used, the behaviour of the models shown here should not be extrapolated to other model configurations.
All models were forced by prescribed atmospheric con-ditions in an attempt to obtain realistic pre-industrial cir-culation fields. The pelagic ecosystem part of the bio-geochemical models ranges from relatively simple nutrient restoring-type models (CSIRO, MOM P2A) to intermedi-ate complexity nutrient-phytoplankton-zooplankton-detritus (NPZD) (UVIC2.8, om1p7-BLINGv0) and more complex models with multiple plankton functional types (OPA-PISCES, MPIOM-HAMOCC, CCSM3-BEC). All models were integrated for at least 2000 yr to reach a steady state quasi-equilibrium. Annual mean output from these models is compared against objectively analysed annual means of the World Ocean Atlas (WOA) 2005 (Garcia et al., 2006a,b).
When using WOA as the ground truth against which we compare the different models, one has to keep in mind that there are inherent errors in this annual-mean composite of observations, specifically due to measurement errors, sea-sonal and regional sampling biases and interpolation effects. In particular, the scarcity of observations during winter time at high latitudes, especially in the North Atlantic and the Southern Ocean, might lead to a bias in the annual mean cli-matology of the upper ocean towards summer. In the deep ocean, however, phosphate and oxygen concentrations as well as temperature and salinity show little to no seasonal variations (e.g. Conkright et al., 2000). Here, seasonal bias in sampling is hence of minor importance. Our analysis con-siders concentration distributions over the entire water col-umn, of which the upper ocean represents only a relative small fraction. For the objective of this study, potential upper ocean sampling biases are therefore assumed to have only a very small effect. Prior to analysis, all model output fields were regridded onto the 33 levels 1 × 1 degree WOA grid.
The distribution of the regenerated phos-phate can be expressed in a general way as
PRegenerated=P PRegenerated (Oxidant) where possible
oxi-dants are oxygen, nitrate, manganese oxides, iron oxides, sulfate and eventually CO2. Organic matter remineralisation
using oxygen occurs everywhere in the ocean, except in places where oxygen is essentially depleted (suboxic regions). In this case, NO3and NO2may be used as electron
acceptors for the oxidation of organic matter. The global
importance of oxygen vs. NO3 as electron acceptors can
roughly be quantified from comparing current estimates of denitrification and the global export production in the ocean interior. The estimated loss of N is about 100 Tg N yr−1(Codispoti et al., 2001), which represents about 7 Tmol C yr−1 (0.08 Gt C yr−1 equivalents) as roughly 1 mole NO3 is consumed during the oxidation of 1 mole carbon
(Koeve and K¨ahler, 2010). The export flux is estimated to be about 10 Gt C yr−1 (e.g., Schlitzer, 2002). The amount of phosphate regenerated under suboxic conditions is equal to the ratio between these two quantities and accounts for about 1 percent of the aerobically remineralized phosphate. Remineralization by other compounds (sulfate, some metals) occurs only in enclosed seas (Black Sea, Baltic, some fjords) and in sediments in shelf and coastal waters. It may locally be important relative to aerobic demineralization, but in the open ocean’s pelagic realm investigated here is not considered to play a significant role.
For the main analysis of this paper, we assume that
PRegeneratedcan be approximated by PRegenerated (O2). Impacts
of denitrification, i.e. PRegenerated (NO3), are estimated for
models that include both a nitrogen and phosphorus cycle (see Appendix). However, due to the limited validity of this estimate and the relatively small impact of phosphorus re-generation by denitrification on our results (see Fig. A1), we focus on aerobic processes in the main part of this study. Re-generated phosphate is computed by multiplying the Appar-ent Oxygen Utilisation (AOU) with the oxidation ratio RP:-O2
PRegenerated=RP:-O2AOU (1)
Apparent Oxygen Utilisation (AOU) evaluates integral oxy-gen consumption by biological activity and is computed as the difference between the oxygen saturation concentration, which depends on thermohaline properties (Weiss, 1970), and the actually observed oxygen concentration. The RP:-O2
ratio is assumed to be a fixed and constant stoichiometric ra-tio between phosphate producra-tion and oxygen consumpra-tion. This ratio has been set to 1/172 in OPA-PISCES, MPIOM-HAMOCC, 1/170 in CCSM3-BEC, CSIRO, MOM P2A, UVIC2.8 and 1/150 in om1p7-BLINGv0. We use these model values when analyzing the respective models outputs. A common RP:-O2 value of 1/170 is used for the
analy-sis of WOA data independently of the value considered in the different models. Indeed, generally accepted values de-rived from ocean data are close to 1/170 (Takahashi et al., 1985; Kortzinger et al., 2001; Anderson and Sarmiento, 1994; Li et al., 2000). It has been shown that this ratio is nearly uniform with location and depth. Using TTO/NAS and GEOSECS data in Atlantic and Indian Ocean, Takahashi et al. (1985) found no evidence for a significant difference between the estimate ratios of oxygen consumption to phos-phate release for thermocline waters in the Atlantic and In-dian Oceans. Similar -O2/P values have also been observed
1800 O. Duteil et al.: Preformed and regenerated PO
Discussion
4in OGCMsP
ap
er
|
Discussion
P
ap
er
|
Discussion
P
ap
er
|
Di
scuss
ion
P
ap
er
|
Fig. 1. Total phosphate (mmol m
−3) volume distribution in WOA, OPA-PISCES, MPIOM-HAMOCC,
CCSM3-BEC, UVIC2.8, om1p7-BLINGv0, CSIRO, MOM P2A for bin sizes of 0.1 mmol m
−3. The
numbers indicate the global mean fraction of preformed over total phosphate. The blue (red) bars indicate
the mean fraction of preformed (regenerated) phosphate in each bin.
22
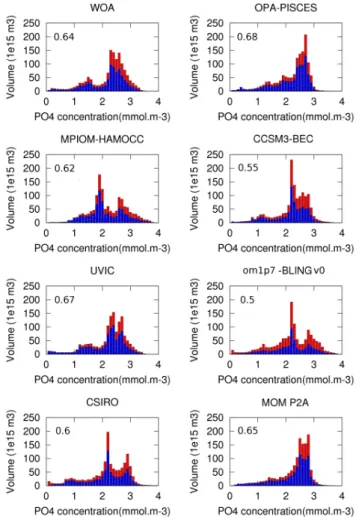
Fig. 1. Total phosphate (mmol m−3) volume distribution in WOA, OPA-PISCES, MPIOM-HAMOCC, CCSM3-BEC, UVIC2.8, om1p7-BLINGv0, CSIRO, MOM P2A for bin sizes of 0.1 mmol m−3. The numbers indicate the global mean fraction of preformed over total phosphate. The blue (red) bars indicate the mean fraction of preformed (regenerated) phosphate in each bin.
Ocean (about 3.5 km deep), the Red Sea, and the Norwegian Sea (Broecker et al., 1985).
Preformed phosphate is computed as the difference be-tween total and regenerated phosphates
PPreformed=P−PRegenerated (2)
With a piston velocity for oxygen of several meters per day, the timescale needed for the oxygen concentrations in the ocean’s surface mixed layer, typically several tens of meters thick, to equilibrate with the atmospheric can reach a few weeks (e.g. Broecker and Peng, 1982). We note that, despite the relative rapidity of the O2 air-sea gas exchange (rapid
when compared with one to two orders of magnitude longer equilibration timescales for the strongly buffered CO2),
equi-librium of surface waters with atmospheric oxygen is actu-ally not perfect and may be prevented by physical processes, such as surface heat loss or entrainment of oxygen depleted
Discussion
P
ap
er
|
Discussion
P
ap
er
|
Discussion
P
ap
er
|
Di
scuss
ion
P
ap
er
|
Fig. 2.
Preformed phosphate (mmol m
−3) volume distribution in WOA, OPA-PISCES,
MPIOM-HAMOCC, CCSM3-BEC, UVIC2.8, om1p7-BLINGv0, CSIRO, MOM P2A.
23
Fig. 2. Preformed phosphate (mmol m−3) volume distribu-tion in WOA, OPA-PISCES, MPIOM-HAMOCC, CCSM3-BEC, UVIC2.8, om1p7-BLINGv0, CSIRO, MOM P2A.
deep water. Computed AOU might be higher than the true oxygen utilisation, especially for waters with high-latitude outcrop regions (Ito et al., 2004). While the processes con-trolling the saturation state of oxygen in the surface waters are not well constrained by available observations, we prag-matically use the AOU metric in this study. We acknowledge the limitation of the AOU approach, and we assume that all our datasets, model outputs as well as observations, are af-fected similarly.
3 Means and volume distributions
In WOA, total PO4 concentrations range from close to 0
to maximum values of 4.9 mmol m−3, with only very small parts of the global ocean volume exhibiting concentrations greater than 3.5 mmol m−3(Fig. 1). The global mean value is 2.26 mmol m−3. The volume associated with concentra-tions lower than 1 mmol m−3 is also small and represents only 5 % of the ocean volume. This low concentrations range
O. Duteil et al.: Preformed and regenerated PO4in OGCMs 1801
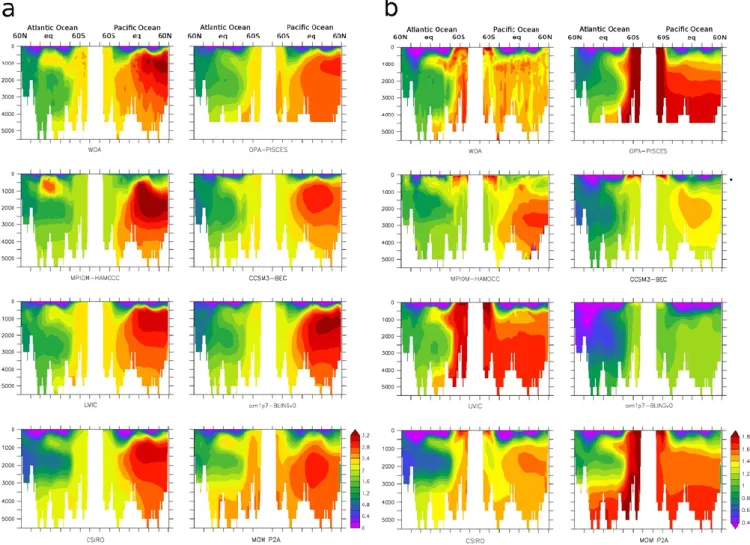
Fig. 3. Total (a) and preformed (b) phosphate concentrations (mmol m−3) along an Atlantic meridional section (30◦W) and a Pacific meridional section (150◦W) in different datasets: WOA, OPA-PISCES, MPIOM-HAMOCC, CCSM3-BEC, UVIC2.8, om1p7-BLINGv0, CSIRO, MOM P2A.
corresponds to the surface layer and the upper thermocline (Fig. 3a,b). The total oceanic phosphate pool is composed by 64 % of preformed and 36 % of regenerated PO4.
The observed (WOA) total phosphate volume distribu-tion is bimodal (Fig. 1). A first mode is characterised by concentrations ranging from 1 to 1.8 mmol m−3, with an associated volume of 20 % of the total ocean. This first mode corresponds mainly to Atlantic waters (Fig. 3), which are characterised by low phosphate values (around 1 mmol m−3) in northern subduction regions, intermediate values (1.5 mmol m−3) in tropical regions and large values (above 2 mmol m−3) in the Southern Atlantic. Subduction re-gions are characterised by a high fraction (0.75) of preformed over total phosphate, as the sinking water mass is young and thus little biological activity occurred since its last contact with the atmosphere. This fraction is much lower in the trop-ical regions of the Atlantic, where biologtrop-ical production is high and subsurface waters are older. Preformed phosphate
is low in the northern high latitude region (0.8 mmol m−3),
high in the Southern Atlantic (above 1.3 mmol m−3) and in-termediate in tropical waters (1 mmol m−3), where mixing occurs between waters of northern and southern origin.
The second mode of the total PO4 volume distribution
(Fig. 1, WOA) ranges from 2.2 to 3.5 mmol m−3 and rep-resents 70 % of the ocean volume. This range of concen-trations is typical for subsurface waters of the Southern Ocean, Indian and Pacific Ocean. Phosphate concentrations increase when water gets older, e.g., from the Southern Ocean (2.2 mmol m−3) towards the North Pacific, where val-ues reach 3.0 mmol m−3 at intermediate depths, as seen in Fig. 3. Preformed phosphate concentrations are relatively constant in the Pacific with values of 1.4 to 1.6 mmol m−3
(Fig. 3b), because in contrast to the Atlantic Ocean, deep waters of the Pacific originate exclusively from the Southern Ocean. In contrast, the ratio of preformed over total phos-phate decreases from the Southern Ocean (0.75) northwards
1802 O. Duteil et al.: Preformed and regenerated PO4in OGCMs
and reaches minimum values of 0.5 in the North Pacific, where regenerated PO4 and total PO4 concentrations are
highest along the Pacific transect.
Global mean phosphate concentrations are similar be-tween observations and all the studied models. Values range from 2.17 mmol m−3 (MPIOM-HAMOCC) to 2.35 (MOM P2A). This similarity is not surprising, since all models were initialised with phosphate fields derived from WOA. Differ-ences reflect to a large extent the different topographies and resolution used in the different models. In order to quantify differences in the PO4distribution between models and data,
we computed a “Volume Class Error”, which is the percent-age of water simulated in the wrong concentration class com-pared to the WOA.
VCE = X
i
|VPO4(i)model−VPO4(i)WOA| !
/(2 · Vocean) (3)
where VPO4(i) is the volume of water for a given modeled or
observed phosphate concentration class i and Vocean is the
total volume of the ocean.
When measured in terms of total phosphate concentra-tion classes of 0.1 mmol m−3 width (Fig. 1), for our set of models the volume class error varies from 9 % for the UVIC2.8 model to 32 % in the MPIOM-HAMOCC model, with OPA-PISCES (19 %), CCSM3-BEC (20 %) and MOM P2A (21 %), om1p7-BLINGv0 (31 %), CSIRO (31 %), dis-playing intermediate model-data differences (Fig. 1).
The partitioning into preformed and regenerated phos-phate displays large variations among the different models. In the om1p7-BLINGv0 model, which assumes RP:−O2=
1/150, the global ratio of preformed over total is only 0.5, indicating a larger share of regenerated phosphate and hence a more intensive biological carbon pump comparing to the physical one. The oceanic phosphate field simulated by the OPA-PISCES model is however determined to a larger ex-tent by circulation-driven preformed phosphate, with a global ratio of preformed-to-total phosphate of 0.68. Preformed-to-total phosphate ratios of other models lie between these two extremes (om1p7-BLINGv0: 0.5, CCSM3-BEC: 0.55; CSIRO: 0.6, MPIOM-HAMOCC: 0.62, WOA: 0.64, MOM P2A: 0.65, UVIC2.8: 0.67, OPA-PISCES: 0.68) and are all relatively close to the WOA ratio of 0.64.
The “Volume Class Error” computed for the preformed pool distribution (Fig. 2) spans from 17 % for the CSIRO model to 69 % for om1p7-BLINGv0 (35 % MPIOM-HAMOCC, 44 % UVIC2.8, 47 % CCSM3-BEC, 48 % OPA-PISCES, 49 % MOM P2A). For all models but CSIRO, the error in preformed phosphate is greater than the error in the total phosphate. It demonstrates that the mechanisms, whether dynamical or biological, responsible for the setting of preformed phosphate concentrations are not as well rep-resented as suggested by just the total phosphate concen-trations. The good performance of CSIRO might be due to the use of flux adjustments at ocean surface and particularly
in the Southern Ocean (Matear and Hirst, 2003), leading to a more realistic winter mixed layer, convection depth and subduction of water in the Southern Ocean.
4 Water masses
In order to better understand what causes the differences in the PO4 distributions, we analyse the models’
representa-tions of the main water masses in the Atlantic and the Pacific Ocean.
Deep waters of the Atlantic Ocean are formed at high latitudes, both in the north (North Atlantic Deep Water: NADW) and in the Southern Ocean (Antarctic Bottom Wa-ter: AABW). In the North Atlantic interior (below 500 m and from 40 to 60◦N) (Fig. 3), concentrations of total
phosphate range from around 0.8 (CSIRO) to 1.5 (MOM P2A) mmol m−3and concentrations of preformed phosphate
from 0.4 (om1p7-BLINGv0), 0.6 (CSIRO) to 1 mmol m−3 (MOM P2A). Some models display preformed values in the NADW substantially lower than the WOA preformed PO4
of about 0.8 mmol m−3 (CCSM3-BEC, om1p7-BLINGv0, CSIRO).This apparent depletion of nutrients in the high-latitude water mass formation areas could be caused by too intense biological activity or too sluggish circulation.
Simulated total PO4concentrations in the Southern Ocean
(80 to 60◦S) show relatively small variations among the dif-ferent models ranging from around 1.9 (MPIOM-HAMOCC) to 2.5 mmol m−3(MOM P2A) (Fig. 3a). However, the par-titioning into preformed and regenerated phosphate varies substantially among the different models (Fig. 3b). Sim-ulated preformed phosphate concentrations in the South-ern Ocean range from around 1.1 (MPIOM-HAMOCC) to 1.8 mmol m−3 (OPA-PISCES). For relatively simple nutrient-restoring biogeochemistry models it has been shown that low preformed Southern Ocean phosphate concentra-tions can be related to sluggish circulation and weak over-turning (Marinov et al., 2008). Significant differences be-tween the end member values of preformed PO4in the
dif-ferent models suggest that an identical concentration of pre-formed PO4is achieved through a different combination of
NADW and AABW in the deep ocean, which is likely to have biogeochemical implications, e.g. on oxygen concentration.
In all of the models investigated, the simulated tongue of NADW with low preformed phosphate concentrations oc-cupies a depth range of about 2000–3000 m and is thinner than in the World Ocean Atlas (Fig. 3b). AABW, gener-ally rich in preformed nutrients, extends northward through-out the Atlantic in most models, whereas it is more mixed with NADW in observations in tropical regions. A tongue of relatively high phosphate concentrations is seen at inter-mediate depths in the tropical Central Atlantic Ocean. This feature is due both to the subduction of Antartic Interme-diate Water, characterised by high preformed nutrient val-ues, and high remineralisation in the tropics. In some models
O. Duteil et al.: Preformed and regenerated PO4in OGCMs 1803
Discussion
P
ap
er
|
Discussion
P
ap
er
|
Discussion
P
ap
er
|
Di
scuss
ion
P
ap
er
|
Fig. 4. Absolute misfits (mmol m
−3) for regenerated, preformed (ordinate) and total phosphate (abscissa)
in (a) global, (b) Southern Ocean, (c) Pacific and (d) Atlantic Ocean. In a model where no compensation
between preformed and regenerated pool exists, one should expect that the total phosphate misfit is
the sum of the preformed and regenerated misfits. In this case, and considering that total phosphate
misfits are, at each location, caused by either the preformed or regenerated pool, with equal amounts of
preformed and regenerated phosphate misfits, the models should be located along the green lines. Several
models present lower total misfits than the sum of preformed and regenerated misfits. This is particularly
the case for models reaching the red line (misfits in preformed or regenerated are at least equal to the
total misfit). Yellow/purple symbols visible for the models MPIOM-HAMMOCC and CCSM3-BEC
include a correction for the estimated contribution of denitrification to the regenerated phosphate pool
(see Appendix).
25
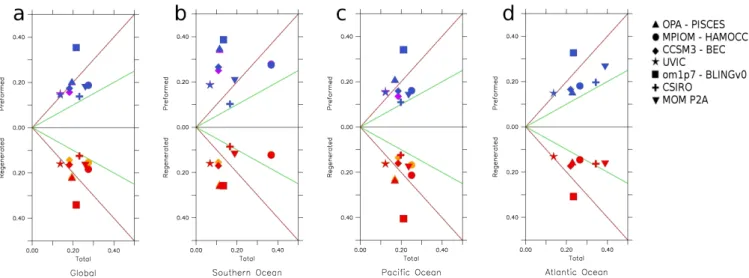
Fig. 4. Absolute misfits (mmol m−3) for regenerated, preformed (ordinate) and total phosphate (abscissa) in (a) global, (b) Southern Ocean, (c) Pacific and (d) Atlantic Ocean. In a model where no compensation between preformed and regenerated pool exists, one should expect that the total phosphate misfit is the sum of the preformed and regenerated misfits. In this case, and considering that total phosphate misfits are, at each location, caused by either the preformed or regenerated pool, with equal amounts of preformed and regenerated phosphate misfits, the models should be located along the green lines. Several models present lower total misfits than the sum of preformed and regenerated misfits. This is particularly the case for models reaching the red line (misfits in preformed or regenerated are at least equal to the total misfit). Yellow/purple symbols visible for the models MPIOM-HAMMOCC and CCSM3-BEC include a correction for the estimated contribution of denitrification to the regenerated phosphate pool (see Appendix).
(MPIOM-HAMOCC, MOM P2A, CSIRO) the role of rem-ineralisation is dominant in generating this feature, indicated by a meridional increase in total, but not in preformed, phos-phate concentrations.
Waters found in the Pacific Ocean originate both from the North Atlantic and from the Southern Ocean (Broecker et al., 1991). PO4concentrations progressively increase from
south to north due to remineralisation processes (Fig. 3a, WOA). Simulated total phosphate concentrations are high-est in MPIOM-HAMOCC, om1p7-BLINGv0, UVIC2.8 and CSIRO, where phosphate concentrations exceed 3 mmol m−3 at intermediate depths (1000 to 2000 m) from 20◦S to 50◦N. These high concentrations are associated with a preformed-to-total phosphate ratio of less than 0.5 (Fig. 3b). Simulated PO4 fields are dominated by the remineralised fraction in
the om1p7-BLINGv0 over most of the Pacific Ocean. OPA-PISCES and MOM-P2A do not display PO4concentrations
higher than 3 mmol m−3.
In the case of OPA-PISCES, remineralisation occurs at shallow depths and thus in regions where residence times are shorter, limiting the accumulation of regenerated phosphate. This shallow remineralisation could be due to too slow sink-ing speed or too fast remineralisation. Inversely in MPIOM-HAMOCC, remineralisation occurs in deeper and older wa-ter, where preformed values are already high. The appar-ent non-conservative behavior of simulated preformed phos-phate concentrations in MPIOM-HAMOCC and CCSM3 is an artefact that can be linked to high denitrification rates (see
Appendix), as only aerobic respiration has been taken in ac-count in the computation of the regenerated phosphate pool. Having described the main differences and similarities be-tween simulated and observed basin-scale PO4distributions,
a quantitative measure of the respective model’s fit to ob-servations can, for example, be obtained by the absolute L1 misfit (Kriest et al., 2010)
L1abs= X i X j X k |PO4Model−PO4Obs| (4)
where PO4Model and PO4Obs are modeled and observed (WOA) phosphate concentrations and i, j , k denote the di-mensions of the spatial domain. The sums of the norm are weighted by the relative volume of the corresponding grid boxes VVij k
total. Absolute L1 norms are computed for total,
pre-formed and regenerated PO4, respectively.
For the model configurations studied here, total PO4
mis-fits as well as mismis-fits of the preformed and remineralised components are shown in Fig. 4. Absolute total PO4
mis-fits are generally smallest in the Southern Ocean, higher in the Pacific Ocean (Fig. 4c) and largest in the Atlantic Ocean (Fig. 4d). The different magnitudes of the misfits are corre-lated with the complexity of the composition of the different water masses in the different basins. For instance, the South-ern Ocean presents a relatively simple vertical water mass structure, whereas the Atlantic ocean is characterised by dif-ferent deep and intermediate waters. Any vertical misplace-ment of this structure by the models can generate high misfits in total phosphate.
1804 O. Duteil et al.: Preformed and regenerated PO4in OGCMs
Several models display absolute misfits in total phosphate that are smaller than the individual misfits of preformed phosphate or regenerated phosphate, indicated by the sym-bols located to the left of the red lines in Fig. 4. This indicates some compensation of errors in preformed phosphate by er-rors in remineralised phosphate, e.g. by too low preformed phosphate concentrations being accompanied by too high concentrations of regenerated phosphate (and vice versa). A compensation is also suggested by the fact that models with large errors in preformed phosphate often display large errors in regenerated phosphate, as seen by the relatively close mirror symmetry of the different panels of Fig. 4 with respect to the horizontal zero line. If no compensation of er-rors in preformed and regenerated phosphate existed, and if total amounts of preformed and regenerated phosphate mis-fits were identical, the model solutions would lie on the green lines displayed in Fig. 4. This is not the case, and essentially all model solutions are located to the left of the green lines.
A compensation of errors in preformed and regenerated phosphate is largest in the Southern Ocean, where model-data misfits of total phosphate are for most models smaller than total phosphate misfits in the Pacific or Atlantic Ocean as well as in the global average. Model-data misfits in both preformed and regenerated phosphate, in contrast, tend to be higher in the Southern Ocean than in the other ocean basins. This suggests that particularly in the Southern Ocean, a rela-tively good fit to observed total phosphate concentrations can be reached by a very unrealistic partitioning into preformed and regenerated phosphate. Given the close correlation of changes in preformed phosphate and atmospheric CO2
ob-served for some models (Marinov et al., 2008), a model eval-uation based on preformed (regenerated) rather than total phosphate concentrations may reveal more details about the quality of the model. In particular, Southern Ocean biogeo-chemistry is, in many models, not as well simulated as one might think when looking at simulated total PO4
distribu-tions only.
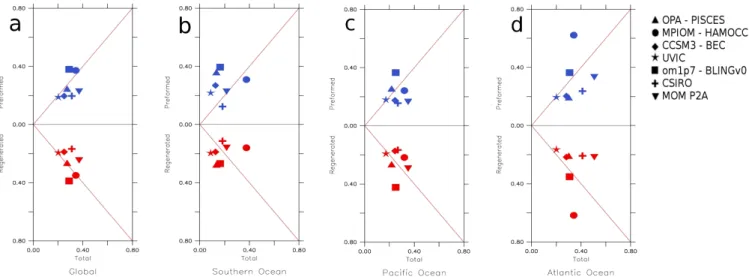
Using the root-mean-square norm to measure model-data misfits yields very similar results (see Appendix Fig. A1). Also, a correction for denitrification impacts on the esti-mated regenerated phosphate (see Appendix) for the models including an explicit nitrogen cycle (MPIOM-HAMMOCC and CCSM3-BEC) does not change the results significantly as indicated by the yellow and purple symbols included in Fig. 4.
5 Conclusions
Using a set of state-of-the-art coupled biogeochemistry-circulation models of the global ocean, this study has shown that a good representation of annual mean phosphate distri-butions in the ocean does not automatically imply that also the preformed and regenerated phosphate components are re-produced at a similar level of accuracy. A realistic
represen-tation of preformed and regenerated nutrient distributions is, however, relevant for assessing the sensitivity of marine bio-geochemical cycles and marine CO2uptake to environmental
changes.The underlying notion is that preformed (regener-ated) phosphate reflects the amount of phosphate returning to the ocean interior by physical (biological) processes.
The partitioning into preformed and regenerated phos-phate has been based on the canonical AOU concept (Red-field et al., 1963; Weiss, 1970), which assumes that a sub-ducted water mass is fully saturated with respect to atmo-spheric oxygen at its temperature and salinity values. How-ever, in reality as well as in an ocean model, the degree to which surface saturation is reached before the water is trans-ported away from the surface layer depends on several fac-tors. These factors include the intensity of air-sea gas ex-change (e.g. wind speed), cooling of surface water, entrain-ment of low-oxygen waters from deeper layers as well as in situ biological processes (respiration or production of oxy-gen). At high latitudes, ice-cover can further slow down air-sea exchange. Namely the processes of cooling, ice-cover and entrainment act in the same direction and lead to an un-dersaturation of surface waters during winter at high latitudes when and where most of the water masses inhabiting the deep ocean are formed. High latitudes are sparsely sampled during the winter season (Koeve, 2001, 2006). However, winter-time undersaturation has been observed, for example in the Wedell Sea, one prominent region of deep water formation, of up to about 20 % (Weiss et al., 1979; Gordon and Huber, 1990; Hopema et al., 1995; Russell and Dickson, 2003) and is in good agreement with a model study that applied an explicit tracer of preformed oxygen (Ito et al., 2004). Oxygen un-dersaturation in newly formed deep waters translates into an overestimation of oxygen use when the canonical AOU con-cept is applied, as recognized from early on (Redfield et al., 1963). The published observations and model studies avail-able so far suggest that this bias, however, is comparavail-able in models and the real ocean.
For doing better, two things are needed and likely will be available in the near future. First and most importantly, more unbiased winter time observations from high latitudes are re-quired. Provided that current sensor calibration issues can be solved, our understanding of winter time oxygen saturation at high latitudes can be expected to improve considerably within a few years from now. In models, the skill of the AOU approach can be tested explicitly, following the methodology of Ito et al. (2004). However, computing the TOU requires the use of an explicit tracer for preformed oxygen. This tracer is fixed at the surface at every time step to the total oxygen concentration and then transported passively into the ocean interior without being subject to biotically induced fluxes. Experiment with such tracers, however, were not available for the models presented here.
Despite the limits of the canonical AOU concept, the use of regenerated and preformed phosphate pools in global scale “skill” metrics provides a diagnostic that is more sensitive to
O. Duteil et al.: Preformed and regenerated PO4in OGCMs 1805
Discussion
P
ap
er
|
Discussion
P
ap
er
|
Discussion
P
ap
er
|
Di
scuss
ion
P
ap
er
|
Fig. A1. Absolute misfits (mmol m
−3) for regenerated, preformed (ordinate) and total phosphate
(ab-scissa) in (a) global, (b) Southern Ocean, (c) Pacific and (d) Atlantic Ocean. Root square of the L2
absolute misfit has been used: L2
abs=
P
iP
jP
k(PO
4Model−PO
4Obs)
2.
26
Fig. A1. Absolute misfits (mmol m−3) for regenerated, preformed (ordinate) and total phosphate (abscissa) in (a) global, (b) Southern Ocean, (c) Pacific and (d) Atlantic Ocean. Root square of the L2 absolute misfit has been used: L2abs=Pi
P
j
P
k(PO4Model−PO4Obs)2.
differences in circulation and biology than metrics based on total phosphate alone.
For the models investigated here, it turned out that low (high) values of preformed tend to be compensated by high (low) values of remineralised phosphate, suggesting some corrections of deficiencies in the physics by a tuned biogeo-chemical model component. This indicates that models may fit observed phosphate distributions for the wrong reasons. For the models analyzed here, this is particularly the case in the Southern Ocean.
As a conclusion, we re-iterate the need of establishing a set of validation tools for biogeochemical models. In addition to the common inspection of total nutrient concentrations, we recommend considering also preformed and regenerated nu-trient components. This comes at little additional cost, but can provide additional information about mechanisms re-sponsible for the generation of biogeochemical tracer dis-tributions. Using the concepts of preformed and regener-ated nutrients, which reflect the interplay between marine biology and ocean circulation, should help to better con-strain the ability of coupled biogeochemical models to repro-duce the processes relevant for global biogeochemical tracer distributions.
Appendix A
Estimated impact of denitrification on regenerated phosphate
The denitrification process has been estimated in the com-putation of the regenerated phosphate pool. We assume that denitrification has occurred wherever there is a nitrate deficit with respect to the Redfield equivalent of total phos-phate, computed as NO3−16PO4. Remineralisation of 1 mol
Fig. A2. Preformed phosphate concentration (mmol m−3) taking into account the impact of denitrification along an Atlantic merid-ional section (30◦W) and a Pacific meridional section (150◦W) in different datasets: WOA, OPA-PISCES, MPIOM-HAMOCC, CCSM3-BEC, UVIC2.8, om1p7-BLINGv0, CSIRO, MOM P2A.
1806 O. Duteil et al.: Preformed and regenerated PO4in OGCMs
of phosphate consumes 4/5 · ratio(−N/O2)moles of nitrate
(Paulmier et al., 2009). However, the limitation of this ap-proach is the assumption that waters with NO3−16PO4>0
have not experienced denitrification and that all denitrifica-tion leaves a trace in negative NO3−16PO4. Applying this
correction, preformed phosphate conservative properties are significantly improved in MPIOM-HAMOCC and CCSM-BEC (Figs. 4 and A2). At basin scale, model-data differences computed following the rationale of Kriest et al. (2010) dis-play slight improvements; however, the general picture is vir-tually unchanged (Fig. 4).
Acknowledgements. We acknowledge financial support to O.D.
and A.O. from the Deutsche Forschungsgemeinschaft (SFB 754), to W.K. from the German Federal Ministry of Education and Research (FKZ 03F0608A, BIOACID), to E.G. from Compute Canada, to R.J.M. from the funding support of the Australian Cli-mate Change Science Program and to J.S. from the EU FP7 project CARBOCHANGE (Grant no. 264879). The research of D.B. was supported by the Office of Science (BER), US Department of Energy, Award DE-FG02-07ER64467. The work of E.G. was supported in part by BP and Ford Motor Company through the Car-bon Mitigation Initiative at Princeton University and under award NA17RJ2612 and NA08OAR4320752 from the National Oceanic and Atmospheric Administration, US Department of Commerce. The statements, findings, conclusions, and recommendations are those of the authors and do not necessarily reflect the views of the National Oceanic and Atmospheric Administration, or the US Department of Commerce.
Edited by: J. Middelburg
References
Anderson, L. and Sarmiento, J.: Redfield ratios of remineralization determined by nutrient data analysis, Global Biogeochem. Cy., 8, 65–80, 1994.
Aumont, O. and Bopp, L.: Globalizing results from ocean in situ iron fertilization studies, Global Biogeochem. Cy., 20, GB2017, doi:10.1029/2005GB002591, 2006.
Broecker, W. S. and Peng, T. H: Tracers in the Sea. New York: Eldigio press, 1982.
Broecker, W. S., Takahashi, T., and Takahashi, T. T.: Sources and flow patterns of deep ocean waters as deduced from potential temperature, salinity, and initial phosphate concentration. J. Geo-phys. Res., 90, 6295–6939, 1985.
Broecker, W., Blanton, S., Smethie Jr., W., and Ostlund, G.: Radio-carbon decay and oxygen utilization in the deep Atlantic Ocean, Global Biogeochem. Cy., 5, 87–117, 1991.
Codispoti, L. A., Brandes, J. A, Christensen, J. P., Devol, A. H., Naqvi, S. W. A., Paerl, H., W., and Yoshinari, T.: The oceanic fixed nitrogen and nitrous oxide budgets: Moving targets as we enter the anthropocene? Scientia Marina, 65 (Suppl. 2), 85–105, 2001.
Conkright, M. E, Gregg, W. W., and Levitus, S.: Seasonal cycle of phosphate in the open ocean, Deep-Sea Res. I, 47, 159–175, 2000.
Friedlingstein, P., Cox, P., Betts, R., Bopp, L., Von Bloh, W., Brovkin, V., Cadule, P., Doney, S., Eby, M., Fung, I., Bala, G., John, J., Jones, C., Joos, F., Kato, T., Kawamiya, M., Knorr, W., Lindsay, K., Matthews, H., Raddatz, T., Rayner, P., Reick, C., Roeckner, E., Schnitzler, K., Schnur, R., Strassmann, K., Weaver, A., Yoshikawa, C., and Zeng, N.: Climate-carbon cycle feedback analysis: results from the C4MIP model intercompari-son, J. Climate, 19, 3337–3353, 2006.
Galbraith, E. D., Gnanadesikan, A., Dunne, J. P., and His-cock, M. R.: Regional impacts of iron-light colimitation in a global biogeochemical model, Biogeosciences, 7, 1043–1064, doi:10.5194/bg-7-1043-2010, 2010.
Garcia, H. E., Locarnini, R. A., Boyer, T. P., and Antonov, J. I.: World Ocean Atlas 2005, Vol. 3: Dissolved Oxygen, Apparent Oxygen Utilization, and Oxygen Saturation, edited by: Levi-tus, S., NOAA Atlas NESDIS 63, US Government Printing Of-fice, Washington, D.C., 342 pp., 2006a.
Garcia, H. E., Locarnini, R. A., Boyer, T. P., and Antonov, J. I.: World Ocean Atlas 2005, Vol. 4: Nutrients (Phosphate, Nitrate, Silicate), edited by: Levitus, S., NOAA Atlas NESDIS 64, US Government Printing Office, Washington, D.C., 396 pp., 2006b. Gnanadesikan, A., Dunne, J., Key, R., Matsumoto, K.,
Sarmiento, J., Slater, R., and Swathi, P.: Oceanic ventila-tion and biogeochemical cycling: Understanding the physical mechanisms that produce realistic distributions of tracers and productivity, Global Biogeochem. Cy., 18, GB4010, doi:10.1029/2003GB002097, 2004.
Gordon, A. and Huber, B.: Southern ocean mixed layer, J. Geophys. Res.-Oceans, C7, 11655–11672, 1990.
Hoppema, M., Fahrbach, E., Schr¨oder, M., Wisotzki, A., and De Baar, H. J. W.: Winter–summer differences of carbon dioxide and oxygen in the Weddell Sea surface layer, Mar. Chem., 51, 177– 192, 1995.
Ito, T. and Follows, M.: Preformed phosphate, soft tissue pump and atmospheric CO2, J. Mar. Res., 63, 813–839, 2005.
Ito, T., Follows, M., and Boyle, E.: Is AOU a good measure of respiration in the oceans?, Geophys. Res. Lett., 31, L17305, doi:10.1029/2004GL020900, 2004.
Koeve, W.: Wintertime nutrients in the North Atlantic – new ap-proaches and implications for estimates of seasonal new produc-tion, Mar. Chem., 74, 245–260, 2001.
Koeve, W.: Stoichiometry of the biological pump in the North Atlantic – constraints from climatological data, Global Bio-geochem. Cy., 20, GB3018, doi:10.1029/2004GB002407, 2006. Koeve, W. and K¨ahler, P.: Heterotrophic denitrification vs. autotrophic anammox – quantifying collateral effects on the oceanic carbon cycle, Biogeosciences, 7, 2327–2337, doi:10.5194/bg-7-2327-2010, 2010.
Kortzinger, A., Hedges, J., and Quay, P.: Redfield ratios revisited: Removing the biasing effect of anthropogenic CO2, Limnol.
Oceanogr., 46, 964–970, 2001.
Kriest, I., Khatiwala, S., and Oschlies, A.: Assessment of simple global marine biogeochemical models of increasing complexity, Prog. Oceanogr., 86, 336–360, 2010.
Krishnamurthy, A., Moore, J., Mahowald, N., Luo, C., Doney, S., Lindsay, K., and Zender, C.: Impacts of increasing an-thropogenic soluble iron and nitrogen deposition on ocean biogeochemistry, Global Biogrochem. Cy., 23, GB3016, doi:10.1029/2008GB003440, 2009.
O. Duteil et al.: Preformed and regenerated PO4in OGCMs 1807
Li, Y. H., Karl, D. M., Winn, C. D., Mackenzie, F. T., and Gans, K.: Remineralization ratios in the subtropical north Pacific gyre, Aquatic Geochem., 6, 65–86, 2000.
Maier-Reimer, E.: Geochemical cycles in an ocean general cir-culation model: preindustrial tracer distributions, Global Bio-geochem. Cy., 7, 645–677, 1993.
Maier-Reimer, E., Kriest, I., Segschneider, J., Wetzel, P.: The Hamburg Ocean Carbon Cycle Model HAMOCC5.1 – Techni-cal Description Release 1.1 – Berichte zur Erdsystemforschung 14/2005, Max-Planck-Institut f¨ur Meteorologie, Hamburg, Ger-many, available at: http://www.mpimet.mpg.de/wissenschaft/ publikationen/berichteerdsystemforschung.html, last access: De-cember 2011, 2005.
Marinov, I., Gnanadesikan, A., Sarmiento, J., Toggweiler, J., Follows, M., and Mignone, B.: Impact of oceanic circu-lation on biological carbon storage in the ocean and at-mospheric pCO2, Global Biogeochem. Cy., 22, GB3007,
doi:10.1029/2007GB002958, 2008.
Matear, R. and Hirst, A.: Long-term changes in dissolved oxygen concentrations in the ocean caused by protracted global warming, Global Biogeochem. Cy., 17, 1125, doi:10.1029/2002GB001997, 2003.
Najjar, R., Jin, X., Louanchi, F., Aumont, O., Caldeira, K., Doney, S., Dutay, J., Follows, M., Gruber, N., Joos, F., Lind-say, K., Maier-Reimer, E., Matear, R., Matsumoto, K., Mon-fray, P., Mouchet, A., Orr, J., Plattner, G., Sarmiento, J., Schlitzer, R., Slater, R., Weirig, M., Yamanaka, Y., and Yool, A.: Impact of circulation on export production, dissolved organic matter, and dissolved oxygen in the ocean: Results from phase II of the Ocean Carbon-cycle Model Intercomparison Project (OCMIP-2), Global Biogeochem. Cy., 21, GB3007, doi:10.1029/2006GB002857, 2007.
Oschlies, A., Schulz, K., Riebesell, U., and Schmittner, A.: Sim-ulated 21st century’s increase in oceanic suboxia by CO2
-enhanced biotic carbon export, Global Biogeochem. Cy., 22, GB4008, doi:10.1029/2007GB003147, 2008.
Paulmier, A., Kriest, I., and Oschlies, A.: Stoichiometries of remineralisation and denitrification in global biogeochemical ocean models, Biogeosciences, 6, 923–935, doi:10.5194/bg-6-923-2009, 2009.
Redfield, A. C., Ketchum, B. H., and Richards, F. A.: The influence of organisms on the composition of seawater, in: The Sea, vol. 2, edited by: Hill, M. N., John Wiley and Sons, New York, 26–77, 1963.
Roy, T., Bopp, L., Gehlen, M., Schneider, B., Cadule, P., Frol-icher, T., Segschneider, J., Tjiputra, J., Heinze, C., and Joos, F.: Regional impacts of climate change and atmospheric CO2on
fu-ture ocean carbon uptake: a multimodel linear feedback analysis, J. Climate, 24, 2300–2318, 2011.
Russell, J. L. and Dickson, A. G.: Variability in oxygen and nutri-ents in South Pacific Antarctic intermediate water, Global Bio-geochem. Cy., 17, 1033, doi:10.1029/2000GB001317, 2003. Schlitzer, R. : Carbon export fluxes in the Southern Ocean: results
from inverse modelling and comparison with satellite-based esti-mates, Deep Sea Res. II, 49, 1623–1644, 2002.
Schneider, B., Bopp, L., Gehlen, M., Segschneider, J., Fr¨olicher, T. L., Cadule, P., Friedlingstein, P., Doney, S. C., Behrenfeld, M. J., and Joos, F.: Climate-induced interannual variability of marine primary and export production in three global coupled climate carbon cycle models, Biogeosciences, 5, 597–614, doi:10.5194/bg-5-597-2008, 2008.
Takahashi, T., Broecker, W. S., and Langer, S.: Redfield ratio based on chemical data from isopycnal surfaces, J. Geophys. Res.-Oceans, C4, 6907–6924, 1985.
Weiss, R.: The solubility of nitrogen, oxygen, and argon in water and seawater, Deep Sea Res., 17, 721–756, 1970.
Weiss R. F., Ostlund, H. G., and Craig, H.: Geochemical studies of the Weddell sea, Deep Sea Res. Pt. I, 26, 1093–1120, 1979.