HAL Id: hal-02325488
https://hal.archives-ouvertes.fr/hal-02325488
Submitted on 22 Oct 2019
HAL is a multi-disciplinary open access
archive for the deposit and dissemination of sci-entific research documents, whether they are pub-lished or not. The documents may come from teaching and research institutions in France or abroad, or from public or private research centers.
L’archive ouverte pluridisciplinaire HAL, est destinée au dépôt et à la diffusion de documents scientifiques de niveau recherche, publiés ou non, émanant des établissements d’enseignement et de recherche français ou étrangers, des laboratoires publics ou privés.
meteorological conditions and placental DNA
methylation
Emilie Abraham, Sophie Rousseaux, Lydiane Agier, Lise Giorgis-Allemand,
Jörg Tost, Julien Galineau, Agnès Hulin, Valérie Siroux, Daniel Vaiman,
Marie-Aline Charles, et al.
To cite this version:
Emilie Abraham, Sophie Rousseaux, Lydiane Agier, Lise Giorgis-Allemand, Jörg Tost, et al.. Preg-nancy exposure to atmospheric pollution and meteorological conditions and placental DNA methy-lation. Environment International, Elsevier, 2018, 118, pp.334-347. �10.1016/j.envint.2018.05.007�. �hal-02325488�
Environ Int. 2018 Sep;118:334-347. doi: 10.1016/j.envint.2018.05.007. Epub 2018 Jun 21. 1
Pregnancy exposure to atmospheric pollution and
2
meteorological conditions and placental DNA methylation
3
Emilie Abrahama, Sophie Rousseauxa, Lydiane Agiera, Lise Giorgis-Allemanda, Jörg 4
Tostb
, Julien Galineauc
, Agnès Hulind
, Valérie Sirouxa, Daniel Vaimane
, Marie-Aline 5
Charlesf, Barbara Heudef, Anne Forhanf, Joel Schwartzg, Florent Chuffarta, Ekaterina 6
Flina, Saadi Khochbina, Rémy Slamaa, Johanna Lepeulea on behalf of the EDEN mother-7
child cohort study group. 8
a
Univ. Grenoble Alpes, Inserm, CNRS, IAB, 38000 Grenoble, France; b Laboratory for 9
Epigenetics and Environment, Centre National de Genotypage, CEA – Institut de Génomique, 10
Evry, France; c Air Lorraine, Nancy, France; d ATMO Poitou-Charentes, La Rochelle, France; 11
e
Genomics, Epigenetics and Physiopathology of Reproduction, Institut Cochin, U1016 12
Inserm –UMR 8104 CNRS – Paris-Descartes University, Paris; f Inserm U1153, Early Origins 13
of Child Health and Development team, Research Center for Epidemiology and Biostatistics 14
Sorbonne Paris Cité (CRESS), Paris Descartes University, Villejuif, France; g Department of 15
Environmental Health, Harvard T.H. Chan School of Public Health, Boston, Massachusetts, 16
USA. 17
Corresponding author: 18
Johanna Lepeule, IAB – Inserm U1209, Site Santé - Allée des Alpes, 38700 La Tronche. 19
Telephone: +33 4 76 54 94 66 – E-mail: johanna.lepeule@univ-grenoble-alpes.fr 20
Competing Financial Interests: The authors declare they have no present or potential 22
competing financial interests. 23
Funding: This work was made possible thanks to a grant from the Fondation de France 24
(n°2012-00031593 and 2012-00031617). This work was also supported by AVIESAN 25
(Alliance nationale pour les sciences de la vie et de la santé, n°ISP09_2014), the Fonds de 26
Recherche en Santé Respiratoire, the Région Rhône-Alpes, and the National Agency for 27
Research (ANR-13-CESA-0011-02). 28
Additional supports to SK team projects were from Fondation ARC “Canc’air” project 29
(RAC16042CLA), Plan Cancer (CH7-INS15B66) and Plan Cancer (ASC16012CSA), the 30
“Université Grenoble Alpes” ANR-15-IDEX-02, LIFE and SYMER. The EDEN cohort has 31
been funded by Foundation for Medical Research (FRM), National Agency for Research 32
(ANR), National Institute for Research in Public Health (IRESP: TGIR cohorte santé 2008 33
program), French Ministry of Health (DGS), French Ministry of Research, Inserm Bone and 34
Joint Diseases National Research (PRO-A) and Human Nutrition National Research 35
Programs, Paris–Sud University, Nestlé, French National Institute for Population Health 36
Surveillance (InVS), French National Institute for Health Education (INPES), the European 37
Union FP7 programmes (FP7/2007-2013, HELIX, ESCAPE, ENRIECO, Medall projects), 38
Diabetes National Research Program (through a collaboration with the French Association of 39
Diabetic Patients (AFD)), French Agency for Environmental Health Safety (now ANSES), 40
Mutuelle Générale de l’Education Nationale (MGEN), French National Agency for Food 41
Security, and the French-speaking association for the study of diabetes and metabolism 42
(ALFEDIAM). Funders had no influence of any kind on analyses or results interpretation. 43
ABSTRACT
45
Background: In utero air pollution exposure represents a major health threat to the 46
developing foetus. DNA methylation is one of the most well-known molecular determinants 47
of the epigenetic status of cells. Blood DNA methylation has been proven sensitive to air 48
pollutants, but the molecular impact on new-borns has so far received little attention. 49
Objectives: We investigated whether nitrogen dioxide (NO2), particulate matter (PM10),
50
temperature and humidity during pregnancy are associated with differences in genome-wide 51
placental DNA methylation levels. 52
Methods: Whole-genome DNA-methylation was measured using the Illumina’s Infinium 53
HumanMethylation450 BeadChip in the placenta of in 668 individuals enrolled in the EDEN 54
cohort. We designed an original strategy using a priori biological information to focus on 55
candidate genes with a specific expression pattern in placenta (active or silent) combined with 56
an agnostic epigenome-wide association study (EWAS). We used robust linear regression to 57
identify CpGs and differentially methylated regions (DMR) associated with each exposure 58
during short- and long-term time-windows. 59
Results: The candidate genes approach identified nine CpGs mapped to 8 genes associated 60
with prenatal NO2, PM10 and humidity exposure [false discovery rate (FDR) p<0.05]. Among
61
these, the methylation level of 2 CpGs located on ADORA2B remained significantly 62
associated with NO2 exposure during the 2nd trimester exposure in the EWAS (FDR p<0.05).
63
EWAS further revealed associations between exposure and variations of DNA methylation of 64
4 other CpGs. We further identified 27 DMRs significantly (FDR p<0.05) associated with air 65
pollutants exposure and 13 DMRs with weather conditions exposure. 66
Conclusions: These findings demonstrate that air pollutants exposure at levels commonly 67
experienced in the European population are associated with placental gene methylation and 68
provide some mechanistic insight into some of the reported effect of air pollutants on pre-69
eclampsia. Indeed, the methylation of ADORA2B, a gene whose expression was previously 70
associated with hypoxia and pre-eclampsia, was consistently found here sensitive to 71
atmospheric pollutants. In addition, a number of air pollutants associated DMRs pointed to 72
genes previously implicated in preeclampsia and metabolic syndrome. 73
Key words: mother-child cohort, placenta, air pollution, epigenetics, temperature, humidity 74
75
1. Introduction
76
Despite significant improvements in air quality in past decades, 50% of the population in 77
2014 in Europe live in areas that do not meet the World Health Organisation guidelines 78
(World Health Organization, 2006) for particulate matter less than 10 microns (PM10), 85%
79
for particulate matter less than 2.5 microns (PM2.5), and 7% for nitrogen dioxide (NO2) (Ortiz,
80
2017). Ambient air pollution includes gaseous pollutants, such as nitrogen oxides, sulphur 81
dioxide, ozone, benzene, as well as particulate matter of various sizes, which are a mixture of 82
solid and liquid droplets including black carbon, metals, and polycyclic aromatic 83
hydrocarbons. Air pollutants exposure during pregnancy is a major health threat to children as 84
it can cross the placenta and expose the developing foetus (Valentino et al., 2015; Wick et al., 85
2010). Exposure to air pollutants during pregnancy has been associated to a range of adverse 86
health outcomes both in the short-term, including low birth weight and preterm birth and in 87
the long term, including infant reduced lung function and neurodevelopmental disorders (Chiu 88
et al., 2016; Clifford et al., 2016; Jedrychowski et al., 2010; Stieb et al., 2012). Air pollution 89
pregnancy exposure is also a threat to the pregnant woman and is likely a risk factor of 90
preeclampsia (M. Pedersen et al., 2014). More recently, high- or low-ambient temperatures 91
have also been suggested to play a role in adverse pregnancy outcomes (Beltran et al., 2014; 92
Giorgis-Allemand et al., 2017; Kloog et al., 2015). 93
The placenta plays a key role in foetal programming by supporting both the health of the 94
mother and the development of the foetus. It conveys nutrients and oxygen to the foetus and 95
regulates gas and waste exchanges as well as hormone interactions (Murphy et al., 2006). 96
Alterations in placental physiology and function, potentially driven by epigenetic changes, 97
may impact the health of the future individuals during their childhood as well as into their 98
adulthood. Exposure to chemically and/or physically inappropriate environmental conditions 99
during pregnancy can affect the placental function by modifying its epigenome (Nelissen et 100
al., 2011). Indeed epigenetic mechanisms control the timing and levels of gene expression, by 101
defining the extent of their activation or by maintaining them repressed. Hence in utero 102
environmental exposures could result in epigenetic modifications of the placenta at birth, 103
including changes in the DNA methylation profile. As a transient organ, the placenta may 104
provide a unique record of exposures specifically occurring during pregnancy. While several 105
studies have reported changes in global and gene-specific methylation patterns from adult 106
blood associated with air pollution (Madrigano et al., 2011; Panni et al., 2016), temperature 107
and relative humidity exposure (Bind et al., 2014), the role of maternal exposure to such 108
environmental factors on new-borns DNA methylation patterns has received little attention so 109
far. In cord blood, methylation in mitochondria-related genes was associated with NO2
110
exposure during pregnancy in a recent meta–analysis (Gruzieva et al., 2017). In placenta, a 111
few studies have linked global DNA methylation and gene candidate methylation to air 112
pollution exposure during pregnancy (Cai et al., 2017; Janssen et al., 2013). However, no 113
study has yet investigated the relationship between exposure to air pollutants and 114
meteorological conditions during pregnancy and placental methylation patterns at a genome-115
wide scale. 116
We hypothesized that maternal exposure to air pollutants and meteorological conditions could 117
alter the placental function through modifications of DNA methylation. Therefore we 118
investigated the relationship of air pollutants and meteorological conditions with global DNA 119
methylation and gene-specific methylation in placentas at birth using the Illumina 450k array. 120
In order to identify potentially relevant changes in genomic methylation sites related to 121
environmental exposures, we used two complementary approaches combining a concept-122
driven analysis with an Epigenome Wide Association Study (EWAS) (Figure 1). The 123
concept-driven analysis is an original strategy relying on the hypothesis that sensitivity to 124
DNA methylation variations induced by environmental factors may depend on the activity of 125
the genomic region considered (Rousseaux et al., 2013). Indeed, a change in the DNA 126
methylation profile affecting a region involved in the epigenetic control of the expression 127
level of a gene actively repressed or activated during pregnancy is more likely to be 128
biologically relevant than a change occurring in another region of the genome. Therefore, 129
based on available expression data in placenta, we identified genes whose expression is either 130
predominant in full-term placenta or undergoes significant variations during placenta 131
development. In addition, using our methylation data, we also established a list of genes with 132
highly methylated CpG-rich promoters. Focussing on these genes with a specific status or 133
pattern of expression in the placenta, enabled us to explore the “basal epigenome dynamics – 134
epigenome response” relationship in the placenta. We then used an agnostic EWAS design, in 135
an attempt to confirm the findings of the concept-driven analysis and to identify new regions 136
associated with maternal air pollutants exposure. 137
Figure 1. Workflow of the study 138
139
2. Methods
140
2.1. Study population 141
The EDEN mother-child cohort included 2002 pregnant women, mainly Caucasian, enrolled 142
before 24 weeks of gestation in Nancy and Poitiers university hospitals, France, between 2003 143
and 2006 (Heude et al., 2015). Exclusion criteria were multiple pregnancies, pre-pregnancy 144
diabetes, French illiteracy and planned move outside the region in the following 3 years. 145
Residential addresses, lifestyle, demographic and medical data were collected by 146
questionnaires and interviews during pregnancy and after delivery. Among the 1301 women 147
for whom placenta samples were collected, we focused on 668 women. Placenta samples 148
were collected at delivery by the midwife or the technician of the study using a standardized 149
procedure. Samples of around 5mm x 5mm were carried out in the centre of the placenta on 150
the foetal side and were immediately frozen at -80°C. The EDEN cohort received approval 151
from the ethics committee (CCPPRB) of Kremlin Bicêtre and from the French data privacy 152
institution “Commission Nationale de l’Informatique et des Libertés” (CNIL). Written 153
consent was obtained from the mother for herself and for the offspring. 154
2.2. Placental DNA methylation assessment 155
DNA from placental samples was extracted using the QIAsymphony instrument (Qiagen, 156
Germany). The DNA methylation analysis was performed by The Centre National de 157
Génotypage (CNG, Evry, France). The DNA samples were plated onto 96-well or 48-well 158
plates. In total, nine plates including 64 chips were used. These plates were analyzed in 4 159
batches. The ratios for sex (boy/girl) and recruitment centre (Poitiers/Nancy) were balanced 160
for each chip. The Illumina’s Infinium HumanMethylation450 BeadChip, representing over 161
485,000 individual CpG sites, was used to assess levels of methylation in placenta samples 162
following the manufacturer’s instructions (Illuminas, San Diego, CA, USA). Raw signals of 163
450K BeadChips were extracted using the GenomeStudio® software (v2011.1. Illumina). The 164
DNA methylation level of each CpG was calculated as the ratio of the intensity of fluorescent 165
signals of the methylated alleles over the sum of methylated and unmethylated alleles (β 166
value). All samples passed initial quality control and had on average more than 98 % of valid 167
data points (detection p-value <0.01). A refined version of the Subset Quantile Normalization 168
(SQN) pipeline (Touleimat and Tost, 2012) including a revised annotation file (Price et al., 169
2013) was used for data processing, correction and normalization. Intensity values were 170
corrected for potential biases in fluorescent dye intensity and background corrected using the 171
lumi R package (Du et al., 2008) as implemented in the SQN pipeline. Probes potentially
172
influenced by SNPs underlying the entire sequence of the probe (+1 or + 2 bases depending 173
on the Infinium probe type) that are present in the EUR population of the 1000 Genome 174
project (http://www.1000genomes.org)) at a frequency of more than 5% were removed from 175
the analysis. Probes previously reported to map to several genomic regions were removed 176
(Y.-A. Chen et al., 2013). The SQN pipeline uses the intensity signals of high-quality (i.e. low 177
detection p-value) Infinium I probes as “anchors” to estimate a reference distribution of 178
quantiles for probes in a biologically similar context based on the annotation file (Touleimat 179
and Tost, 2012). This reference was then used to estimate a target distribution of quantiles for 180
InfII probes as a means to provide an accurate normalization of InfI/InfII probes and correct 181
for the shift. SQN is performed for each individual separately. A principal component 182
analysis as well as a hierarchical clustering were applied and showed no overall difference in 183
the methylation patterns across participants samples and control samples, so that a quantile 184
normalization was performed for between sample normalization. After quality control and 185
normalization steps, there were 426,049 CpG sites left. Methylation beta values ranged from 0 186
to 1. Data points with a detection p-value >0.01 were excluded from subsequent analyses. To 187
reduce the influence of potential outliers, we excluded data points below the 25th percentile - 188
3*interquartile ranges or above the 75th percentile + 3*interquartile ranges for each probe, 189
which removed 0.4% of all methylation beta values across participants. CpGs with more than 190
25% of missing data were removed, leaving 425,878 CpG sites for statistical analyses. 191
Global methylation was also evaluated by measuring methylation in four CpG sites of 192
repetitive Alu elements (Alu) and long interspersed nucleotide elements 1 (LINE-1) using a 193
previously published pyrosequencing methylation assay (A. S. Yang et al., 2004). We then 194
used the median percent methylation of the four CpG sites. 195
2.3. Cellular composition of placenta samples 196
Cellular composition of biological samples is a potential confounder in epigenetic 197
epidemiology studies. In the absence of reference methylomes for placental tissue, we used a 198
reference-free method, the RefFreeEWAS package available in R (Houseman et al., 2016), to 199
deconvolute cell-type proportions from DNA methylation array data. The method relies on 200
the identification of latent variables as surrogates for cell-type mixture. From the 10,000 most 201
variable CpGs, we identified the optimal number of cell-types to be 6. We then used the 202
425,878 CpGs to estimate the proportion of each cell-type per sample. 203
2.4. Identification of genes with specific patterns of expression 205
We developed an approach relying on the integration of biological knowledge on the 206
“epigenome-expression” relationship in the placenta. We hypothesised that genes and 207
chromatin regions whose activity is controlled by DNA methylation as well as dynamically 208
changing chromatin regions should be more prone to be affected by alterations of DNA 209
methylation following environmental insults. We therefore focused on two categories of 210
genes defined below: genes that are particularly active in the placenta and genes that are silent 211
in the placenta but poised to be activated in response to external stimuli. 212
We defined placenta-predominantly expressed (“active”) genes as genes highly expressed in 213
the placenta at the end of pregnancy, and with little or no expression in other tissues. This list 214
was defined through the exploitation of public transcriptomic data 215
(http://www.ncbi.nlm.nih.gov/geo/: GSE3526, GSE18809, GSE7434, GSE9984 studies) in 216
which 575 genes showed a predominant expression in placentas at birth after normal 217
pregnancies. A placenta predominant expression was defined by a mean level of expression 218
value in placenta samples being above a threshold defined as the mean expression values + 2 219
standard deviations of a series of 112 adult non-germline/non-placenta tissues of various 220
origins. The pre-treatment of transcriptomic data and the strategy to identify genes with a 221
predominant expression in specific tissue types have been described previously (Rousseaux et 222
al., 2013; Wang et al., 2015). These 575 placenta-predominantly expressed genes 223
corresponded to 9,003 CpGs measured by the Illumina beadchip (Table S1). 224
Placenta DNA methylation-dependent repressed (“silent”) genes included genes whose 225
regulatory region is heavily methylated in placenta, based on the assumption that a high level 226
of methylation in CpG-rich regions (or CpG islands) in the regulatory elements of these genes 227
could be associated with a methylation dependent repression. We then hypothesized that these 228
genes could potentially be reactivated upon demethylation. There were 9,969 CpGs located in 229
CpG islands (and which were not in the CpGs list corresponding to placenta-predominantly 230
expressed genes) and whose mean methylation level in our dataset was above 80% (Table 231
S1). Annotation of CpGs was based on information available in the R/Bioconductor 232
package IlluminaHumanMethylation450kanno.ilmn12.hg19, version 0.6.0. 233
234
2.5. Environmental exposures assessment 235
NO2 and PM10 hourly concentrations were modelled at the women's home addresses during
236
pregnancy using the quasi-Gaussian Atmospheric Dispersion Modelling System (ADMS) 237
Urban 3.1 (Cambridge Environmental Research Consultants. Cambridge. United Kingdom) 238
(Sellier et al., 2014). The model was implemented with the same methodology for both 239
Poitiers and Nancy and provides hourly estimates on a 40x40 meters grid. Mean daily 240
ambient temperature (T, in °C) and relative humidity (RH, in %) were obtained from the 241
monitors of the French weather network Météo France. For each woman, the nearest monitor 242
to her home address was used. Because the most biologically relevant time period for the 243
effect of air pollution and weather conditions on methylation is unknown, we considered 244
different exposure windows throughout pregnancy over which we averaged levels of NO2,
245
PM10, T and RH: day 1, 2 and 3 before delivery, one week before delivery, one month before
246
delivery, each trimester of pregnancy and the whole pregnancy. 247 248 2.6. Statistical analyses 249 2.6.1. Global methylation 250
We examined the impact of environmental exposures on the overall methylation level across 251
the entire genome using two approaches, one relying on repetitive elements Alu and LINE-1 252
and the other relying on the global profile of methylation levels estimated for the 425,878 253
CpGs. 254
Association of Alu and LINE-1 methylation levels with air pollutants and meteorological 255
exposures were investigated using robust linear regression, which accounts for potential 256
outliers and heteroscedasticity in the data. We adjusted for the following a priori selected 257
covariates: child sex, parity (0, 1, ≥2 children), maternal age at end of education (≤18, 19-20, 258
21-22, 23-24, ≥25 years), season of conception, study centre (Poitiers and Nancy), maternal 259
body mass index before pregnancy (continuous), maternal age at delivery (linear and 260
quadratic terms), maternal smoking during pregnancy (continuous) and gestational duration 261
(linear and quadratic terms). We additionally adjusted for technical factors related to the 262
methylation measurements (batch, plate and chip) and for the estimated cell-type proportions. 263
Meteorological exposures - temperature and humidity (restricted cubic splines) - were 264
investigated simultaneously. Each air pollutant was studied separately and further adjusted for 265
meteorological exposures (temperature and humidity, with restricted cubic splines). 266
Complementary to the repetitive elements analysis, we conducted a global analysis of 267
methylation profiles (GAMP). This method, described by Zhao et al. (2015), allows to test 268
whether exposure changes the overall profile or distribution of CpG measurements of the 269
participants instead of examining the effect on individual CpGs. Each individual's methylation 270
profile was characterized by approximating the density function and the cumulative 271
distribution function of the methylation distribution using splines basis functions. The B-272
spline coefficients were then used to represent each individual overall methylation 273
distribution. A variance component score test from the kernel machine framework, which 274
naturally accommodates the correlation between B-spline coefficients, was computed to test 275
the association of B-spline coefficients with each exposure of interest (temperature, humidity, 276
NO2, PM10) adjusted for confounders. Meteorological exposures were investigated
simultaneously. Each air pollutant was studied separately in models further adjusted for 278
meteorological exposures (temperature and humidity). 279
280
2.6.2. Methylation at specific loci 281
We studied the association between environmental exposures (NO2, PM10, temperature,
282
humidity) and CpG-specific methylation level using a robust linear regression model. We 283
applied the same approach described for global methylation analysis by testing: the 284
simultaneous effect of meteorological conditions (temperature and humidity) (1); the effect of 285
each air pollutant adjusted for meteorological conditions (temperature and humidity) (2) using 286
the following models: 287
.
288
.
289
Where Yij is the methylation measurement for CpG j in subject i,
290
are restricted cubic spline functions of 291
temperature and humidity, is the set of adjustment factors similar to the one used for the 292
global methylation analysis and is the random error. Each exposure window was tested in 293
a separate model. Multiple testing was accounted for by applying a Benjamini and Hochberg 294
False Discovery Rate (FDR) correction to the p-values that were obtained (Benjamini and 295
Hochberg, 1995). The FDR corrected p-values were calculated for the 18,972 CpGs included 296
in the active and silent genes lists for the concept-driven analysis and for the 425,878 CpGs 297
for the agnostic EWAS. An FDR-corrected p-value <0.05 was considered statistically 298
significant. For all significant CpGs (FDR-corrected p-value <0.05), we further tested whether 299
the association with the exposures differed by child sex by adding an interaction term in the 300
model. The genomic inflation factor (lambda) has been widely used in GWAS to assess 301
inflation/deflation of p-values (Devlin et al., 2001). A recent study demonstrated that the 302
Bayesian Inflation Factor (BIF) was a more relevant approach for EWAS (van Iterson et al., 303
2017). We computed the lambda and BIF for both the concept-driven analysis and the 304 agnostic EWAS. 305 306 2.6.3. Region-based analysis 307
To identify Differentially Methylated Regions (DMRs) in our data, we used Comb-p, a 308
method relying on the Stouffer-Liptak-Kechris correction that combines specific CpG p-309
values using sliding windows and accounting for correlation between CpGs (B. S. Pedersen et 310
al., 2012). DMR p-values were adjusted for multiple testing by id correction ( id , 311
1967). Significant DMRs (p-value<0.05) included at least 2 probes (p-value<0.001) at a 312
maximum distance of 500 bp. All analyses were performed using the statistical software R 313
(version 3.0.1) and Python (version 2.7.14). 314
315
3. Results 316
3.1. Population characteristics and environmental factors 317
On average (±SD), the participating mothers were 29 (± 5.1) years old, with a pre-pregnancy 318
BMI of 22.9 (± 4.2) kg/m² (Table 1). Mean gestational duration was 40 (± 1.7) weeks and 32 319
babies (5%) were born preterm (<37 gestational weeks). 320
Table 1. Characteristics of the EDEN study population (n=668) and environmental exposures 321
over the whole pregnancy period. 322
mean±SE n (%) Median pregnancy levels
Characteristics All T RH NO2 PM10
Center
Poitiers 287 (43) 12.2 77.3 12.2 15.6
Nancy 381 (57) 9.8 77.2 23.4 23.4
Male 349 (52) 10.7 77.4 17.1 20.6 Female 319 (48) 11.1 76.8 17.4 21.5 Parity 0 301 (45) 11.3 77.3 17.0 20.8 1 252 (38) 10.5 77.4 17.3 21.2 ≥2 115 (17) 11.0 76.9 17.4 21.0
Maternal age at end of education (year)
≤18 132 (20) 10.9 77.2 17.4 20.7 19-20 114 (17) 11.1 77.5 15.8 17.5 21-22 151 (23) 10.9 77.1 16.9 21.3 23-24 145 (22) 11.0 76.7 18.2 21.3 ≥25 126 (19) 10.8 77.8 18.8 21.4 Season of conception January – March 143 (21) 13.5 73.8 14.6 17.2 April – June 153 (23) 12.3 77.3 18.6 21.8 July – September 189 (28) 8.7 80.1 19.3 22.0 October – December 183 (27) 10.1 76.7 16.9 20.5 BMI(kg/m²) 22.9±4.2 - - - -
Maternal age (year) 29.0±5.1 - - - -
Maternal smokinga 1.7±3.5 - - - -
Gestational duration (weeks) 39.8±1.7 - - - - T= Temperature (°C). RH= Relative humidity (%). NO2= Nitrogen dioxide (µg/m
3
). PM10= Particulate matter
323
smaller than 10 µm (µg/m3). BMI= pre-pregnancy Body Mass Index. 324
aAverage number of cigarette per day during pregnancy
325 326
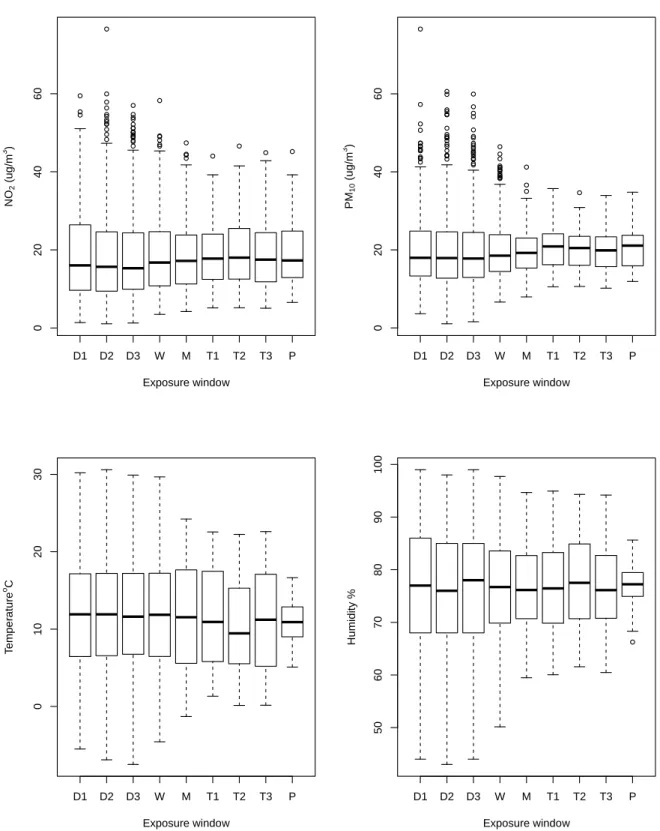
The longer the exposure window was, the less variable was the exposure level (Figure 2). 327
Mean pregnancy levels were 19 (± 7.7) μg/m3 for NO2 and 20 (± 4.5) μg/m3 for PM10.
Figure 2. Environmental exposure across time window (d1, 2, 3 = day 1, 2, 3 before delivery; 329
w = week before delivery; m = month before delivery; t1, 2, 3 = trimester 1, 2, 3 and P = 330
whole pregnancy). 331
332
NO2 and PM10 levels were highly correlated (range, 0.73 to 0.84 depending on averaging
333
period, see Table S2). For each air pollutant, trimester-specific levels were strongly and 334 D1 D2 D3 W M T1 T2 T3 P 0 2 0 4 0 6 0 Exposure window N O2 ( u g /m 3 ) D1 D2 D3 W M T1 T2 T3 P 0 2 0 4 0 6 0 Exposure window P M1 0 ( u g /m 3 ) D1 D2 D3 W M T1 T2 T3 P 0 1 0 2 0 3 0 Exposure window T e m p e ra tu re oC D1 D2 D3 W M T1 T2 T3 P 5 0 6 0 7 0 8 0 9 0 1 0 0 Exposure window H u m id it y %
positively correlated (correlation ranged from 0.52 to 0.78 for NO2 and from 0.79 to 0.86 for
335
PM10). Average temperature exposure during pregnancy varied from 5 °C minimum to 16 °C
336
maximum while relative humidity varied from 66% minimum to 86% maximum. 337
Temperature and humidity were strongly and negatively correlated (range between 0.71 and -338
0.80, depending on averaging period, see Table S2). As for correlation between air pollutants 339
and meteorological conditions, NO2 levels were moderately correlated with temperature and
340
humidity (|r|=0.15 to 0.61) and PM10 levels were weakly correlated with temperature and
341
humidity (|r|=0.04 to 0.34). 342
343
3.2. Global DNA methylation 344
Average methylation level was 16.2 (± 1.0) for Alu and 26.1 (± 1.9) for LINE-1. The 345
distribution of average methylation level by CpG site was bimodal, with a peak around 0.025 346
and another around 0.925 (Figure S1). Highest variability in methylation levels was observed 347
for moderately methylated CpG sites (see Figure S2). PM10 exposure the day before birth was
348
positively associated with Alu methylation with a 0.08 regression coefficient (p-value=0.01) 349
(Table S3). Temperature exposure during the 1st trimester of pregnancy was significantly 350
associated with the density of methylation distribution (p-value=0.03). However, analyses of 351
Alu and LINE-1 as well as the global analysis of methylation profiles mainly yielded not 352
significant differences with p-values higher than 0.05 (Table S3). 353
354
3.3. Concept-driven approach: silent and active genes in placenta 355
Among the list of placenta-predominantly expressed genes (“active genes”), 3 CpGs mapping 356
to 3 genes, whose average methylation levels varied between 0.03 and 0.58, were 357
significantly associated with NO2 exposure (FDR p-values <0.05, Table 2). Two of these 3
CpGs are located in the body of ADORA2B, encoding the Adenosine A2B Receptor, one is in 359
a region shared by the promoter regions of two genes, PXT1 (Peroxisomal testis specific 1) 360
and KCTD20 (potassium channel teramerization domain containing 20). The methylation 361
levels of the two CpGs of ADORA2B decreased on average with higher exposure to NO2
362
during the 1st or 2nd trimester or during the whole pregnancy. Conversely, the methylation of 363
the CpG located in the promoter of the PXT1 and KCTD20 genes was positively associated 364
with NO2 exposure during both the 2nd trimester and the whole pregnancy. Regarding
365
exposure to PM10, one CpG located in the promoter of SLC44A5B (solute carrier family 44
366
member 5) gene was positively associated with exposure the month before birth and another 367
CpG located in the body of KYNU (kynureninase) was negatively associated with exposure 3 368
days before birth. No significant association with methylation was found for temperature and 369
humidity levels (lowest FDR p-values, 1.00, 1.00, respectively). 370
Among the placenta DNA methylation-dependent repressed genes (“silent genes”), one CpG, 371
located in the body of the CAPN10 (Calcium-Activated Neutral Proteinase 10) gene, was 372
positively associated with NO2 exposure during the 3rd trimester. Exposure to PM10 the month
373
before birth was negatively associated with mean methylation of one CpG located in the body 374
of TUBGCP2 (tubulin gamma complex associated protein 2) and was positively associated 375
with mean methylation of two CpGs, one located in the body of TGM6 (transglutaminase 6) 376
and another located in the body of ADCK5 (aarF domain containing kinase 5). Regarding 377
exposure to meteorological conditions, no significant associations with methylation of active 378
genes were found (lowest FDR p-values, 1.00 for temperature and humidity). 379
The p-value distribution of the 18,972 CpGs included in the concept-driven analysis was close 380
to the theoretical distribution as indicated by the BIF values (range from 0.95 to 1.1) which 381
were substantially smaller compared to the lambda values (figures S3-S6). 382
Table 2. CpGs associated (FDR p < 0.05) with prenatal exposure to air pollutants or meteorological conditions 383
Exposure CpG Chr (built 37) Position Gene Location in gene Location of CpG βa FDR p-value Mean
methylation level (SE) candidate EWAS
CpGs located in placenta-predominantly expressed genes (n=9,003 sites)
NO2
Pregnancy cg10984505 chr6 36410951 PXT1;KCTD20 TSS1500;5'UTR Island 0.002 0.04 0.031 (0.006) cg17580614 chr17 15849512 ADORA2B Body Island -0.042 <10-3 0.02 0.586 (0.138) cg07563400 chr17 15849556 ADORA2B Body S_Shore -0.045 <10-3 0.343 (0.125) Trimester 1 cg17580614 chr17 15849512 ADORA2B Body Island -0.037 <10-3 0.586 (0.138) cg07563400 chr17 15849556 ADORA2B Body S_Shore -0.042 <10-3 0.343 (0.125) Trimester 2 cg10984505 chr6 36410951 PXT1;KCTD20 TSS1500;5'UTR Island 0.002 0.02 0.031 (0.006) cg17580614 chr17 15849512 ADORA2B Body Island -0.044 <10-4 <10-3 0.586 (0.138) cg07563400 chr17 15849556 ADORA2B Body S_Shore -0.047 <10-4 <10-3 0.343 (0.125)
PM10
Month before birth cg12659128 chr1 76078176 SLC44A5 TSS1500 N_Shelf 0.037 0.03 0.587 (0.070) Day 3 before birth cg04112100 chr2 143701758 KYNU Body OpenSea -0.012 0.04 0.257 (0.068)
CpGs located in methylation-dependent repressed genes list (n=9,969 sites)
NO2
Trimester 3 cg01712700 chr2 241535695 CAPN10 Body Island -0.004 0.02 0.948 (0.013)
PM10
Month before birth cg23075260 chr8 145617435 ADCK5 Body Island 0.018 0.03 0.878 (0.034) cg05142592 chr10 135097800 TUBGCP2 Body Island -0.008 0.03 0.953 (0.018) cg06967014 chr20 2384240 TGM6 Body Island 0.007 0.03 0.924 (0.015)
CpGs not in active and silent placenta genes list (i.e. EWAS approach)
NO2
Pregnancy cg20491726 chr2 242820622 N_Shelf 0.015 0.02 0.715 (0.051) Trimester 2 cg20491726 chr2 242820622 N_Shelf 0.015 0.02 0.715 (0.051)
PM10
Trimester 1 cg03215416 chr8 18823341 PSD3 Body OpenSea -0.020 0.03 0.913 (0.024)
Humidity
Trimester 2 cg16917193 chr12 54089295 Island 0.04b 0.104 (0.114) Month before birth cg16075020 chr19 12606183 ZNF709 5'UTR Island <10-3b 0.063 (0.077) NO2= Nitrogen dioxide (µg/m3). PM10= Particulate matter smaller than 10 µm (µg/m3).
384
a Results per 10 units increase in prenatal exposure.
385
b p-value of the spline
3.4. Agnostic approach: EWAS examining each CpG 387
When we independently tested the adjusted effect of exposures on each of the 425,878 CpGs, six 388
showed significantly different methylation levels (Table 2). Among these, two CpGs had also been 389
identified in the concept-driven analysis: cg07563400 and cg17580614, both located in ADORA2B, 390
remained significantly associated with NO2 exposure during the 2nd trimester of pregnancy after the
391
genome-wide FDR correction of p-values (Table 2; Figure 3). Other CpGs identified as 392
significantly associated with environmental exposures in the concept-driven approach did not 393
achieve genome-wide statistical significance in the EWAS, but all except one of them (cg05142592 394
on gene TUBGCP2) were still in the top 20 CpGs with the lowest p-values for association with 395
exposure (see Table S4 to S7). 396
The EWAS also revealed four new CpGs (not included in the concept-driven list of candidates) 397
whose average methylation was significantly (FDR p-value <0.05) associated with humidity, NO2
398
and PM10 exposure (Table 2). One CpG (cg20491726), mapped to a non genic region, was
399
significantly associated with a 10 µg/m3 increase in NO2 exposure during both the second trimester
400
(β=0.015 FDR p=0.02) and the whole pregnancy (β=0.015 FDR p=0.02). Another CpG mapped to 401
PSD3 (pleckstrin and Sec7 domain containing 3) was negatively associated with PM10 during the 1st
402
trimester of pregnancy (Table 3). Two CpGs, one in the non genic region and one mapped to 403
ZNF709 (zinc finger protein 709), were non-linearly associated with humidity in the 2nd trimester of 404
pregnancy and in the month before birth, respectively (Figure S7). The p-value distribution of the 405
425,878 CpGs was close to the theoretical distribution as indicated by the BIF values (range from 406
0.96 to 1.15) (Figure S8 to S11). 407
Although interaction terms with sex were significant for two CpGs (cg06967014, cg16917193), the 408
effect estimates (Table 8) and dose-response relationship (Figure S7) did not appear substantially 409
different between boys and girls. 410
Figure 3. Manhattan plots of p-values showing the association between environmental exposure 412
(NO2 (A, B), PM10 (C), and humidity (D, E)) and 425,878 CpGs methylation using the agnostic
413
EWAS. Each dot corresponds to the p-value of a CpG site and the horizontal lines indicates the 414
level of statistical significance (FDR p < 0.05). 415
416
3.5. Regional analysis 417
Our regional analysis identified 27 DMRs significantly (Sidak-corrected P-value<0.05) associated 418
with air pollutants exposure and 13 DMRs with weather conditions exposure (Table 3, Table S9). 419
The ADORA2B-associated DMR was identified for the three trimesters and the whole pregnancy; 420
the DMR included the two CpGs previously identified in the site-specific analyses. Among genes 421
highly represented in the identified DMRs, several CpGs located in the FAM38A gene were 422
negatively associated with NO2 exposure in each trimester, last month and pregnancy. The
423
FAM124B-associated DMR was hypomethylated across the 7 CpGs included in women with
424
increased exposure to NO2 or PM10, especially towards the end of pregnancy. NO2 exposure,
425
especially towards the end of pregnancy (3rd trimester and last month) was negatively associated 426
with two DMRs located in HSP90AA1 and LOC254559 and positively associated with two DMRs 427
located in LZTFL1, and P2RX4. The top-ranked DMRs in terms of number of CpGs included were 428
located in CD81 (13 CpGs) and in a non-genic region on chromosome 6 (15 CpGs). 429
430 431
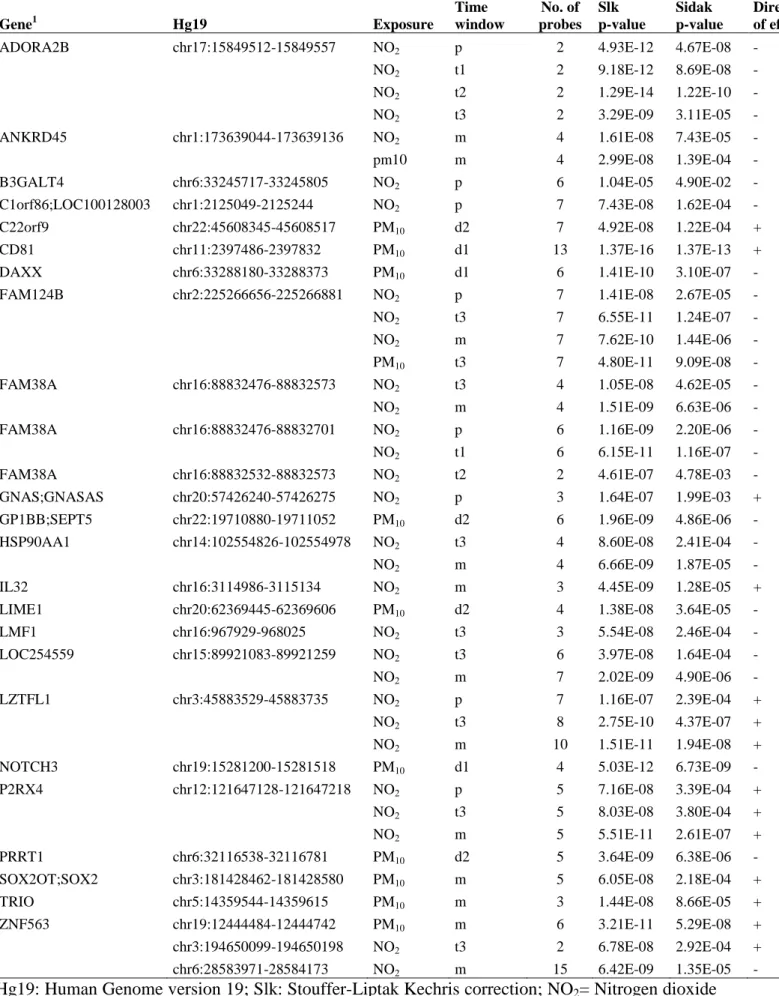
Table 3. Regions identified using the Comb-P method as differentially methylated in the placenta in 432
association with air pollutants exposure in pregnancy. 433 Gene1 Hg19 Exposure Time window No. of probes Slk p-value Sidak p-value Direction of effect2
ADORA2B chr17:15849512-15849557 NO2 p 2 4.93E-12 4.67E-08 -
NO2 t1 2 9.18E-12 8.69E-08 -
NO2 t2 2 1.29E-14 1.22E-10 -
NO2 t3 2 3.29E-09 3.11E-05 -
ANKRD45 chr1:173639044-173639136 NO2 m 4 1.61E-08 7.43E-05 -
pm10 m 4 2.99E-08 1.39E-04 -
B3GALT4 chr6:33245717-33245805 NO2 p 6 1.04E-05 4.90E-02 -
C1orf86;LOC100128003 chr1:2125049-2125244 NO2 p 7 7.43E-08 1.62E-04 -
C22orf9 chr22:45608345-45608517 PM10 d2 7 4.92E-08 1.22E-04 +
CD81 chr11:2397486-2397832 PM10 d1 13 1.37E-16 1.37E-13 +
DAXX chr6:33288180-33288373 PM10 d1 6 1.41E-10 3.10E-07 -
FAM124B chr2:225266656-225266881 NO2 p 7 1.41E-08 2.67E-05 -
NO2 t3 7 6.55E-11 1.24E-07 -
NO2 m 7 7.62E-10 1.44E-06 -
PM10 t3 7 4.80E-11 9.09E-08 -
FAM38A chr16:88832476-88832573 NO2 t3 4 1.05E-08 4.62E-05 -
NO2 m 4 1.51E-09 6.63E-06 -
FAM38A chr16:88832476-88832701 NO2 p 6 1.16E-09 2.20E-06 -
NO2 t1 6 6.15E-11 1.16E-07 -
FAM38A chr16:88832532-88832573 NO2 t2 2 4.61E-07 4.78E-03 -
GNAS;GNASAS chr20:57426240-57426275 NO2 p 3 1.64E-07 1.99E-03 +
GP1BB;SEPT5 chr22:19710880-19711052 PM10 d2 6 1.96E-09 4.86E-06 -
HSP90AA1 chr14:102554826-102554978 NO2 t3 4 8.60E-08 2.41E-04 -
NO2 m 4 6.66E-09 1.87E-05 -
IL32 chr16:3114986-3115134 NO2 m 3 4.45E-09 1.28E-05 +
LIME1 chr20:62369445-62369606 PM10 d2 4 1.38E-08 3.64E-05 -
LMF1 chr16:967929-968025 NO2 t3 3 5.54E-08 2.46E-04 -
LOC254559 chr15:89921083-89921259 NO2 t3 6 3.97E-08 1.64E-04 -
NO2 m 7 2.02E-09 4.90E-06 -
LZTFL1 chr3:45883529-45883735 NO2 p 7 1.16E-07 2.39E-04 +
NO2 t3 8 2.75E-10 4.37E-07 +
NO2 m 10 1.51E-11 1.94E-08 +
NOTCH3 chr19:15281200-15281518 PM10 d1 4 5.03E-12 6.73E-09 -
P2RX4 chr12:121647128-121647218 NO2 p 5 7.16E-08 3.39E-04 +
NO2 t3 5 8.03E-08 3.80E-04 +
NO2 m 5 5.51E-11 2.61E-07 +
PRRT1 chr6:32116538-32116781 PM10 d2 5 3.64E-09 6.38E-06 -
SOX2OT;SOX2 chr3:181428462-181428580 PM10 m 5 6.05E-08 2.18E-04 +
TRIO chr5:14359544-14359615 PM10 m 3 1.44E-08 8.66E-05 +
ZNF563 chr19:12444484-12444742 PM10 m 6 3.21E-11 5.29E-08 +
chr3:194650099-194650198 NO2 t3 2 6.78E-08 2.92E-04 +
chr6:28583971-28584173 NO2 m 15 6.42E-09 1.35E-05 -
Hg19: Human Genome version 19; Slk: Stouffer-Liptak Kechris correction; NO2= Nitrogen dioxide
434
(µg/m3). PM10= Particulate matter smaller than 10 µm (µg/m3). p: pregnancy. t1: trimester 1. t2:
trimester 2. t3: trimester 3. d1: day 1 before birth. d2: day 2 before birth. d3: day 3 before birth; 1 436
UCSC; 2 direction of effect was similar across all CpGs included in the DMR 437
438
3.6. Synthesis of the results 439
Our top finding was that one CpG (cg17580614) located in the body of ADORA2B, one of the 440
placenta-predominantly expressed genes, showed a significantly lower methylation in placenta after 441
NO2 exposure during pregnancy. This result came out of the concept-driven analysis performed on
442
18,972 CpGs and was confirmed in the agnostic approach that used a more stringent FDR 443
correction of the p-values on 425,878 CpGs and in the regional analysis. Furthermore, this CpG as 444
well as another ADORA2B CpG (cg07563400) were in the top 20 of CpGs associated with NO2
445
exposure during the 1st and 2nd trimesters and during the whole pregnancy (FDR p-values ≤0.1, 446
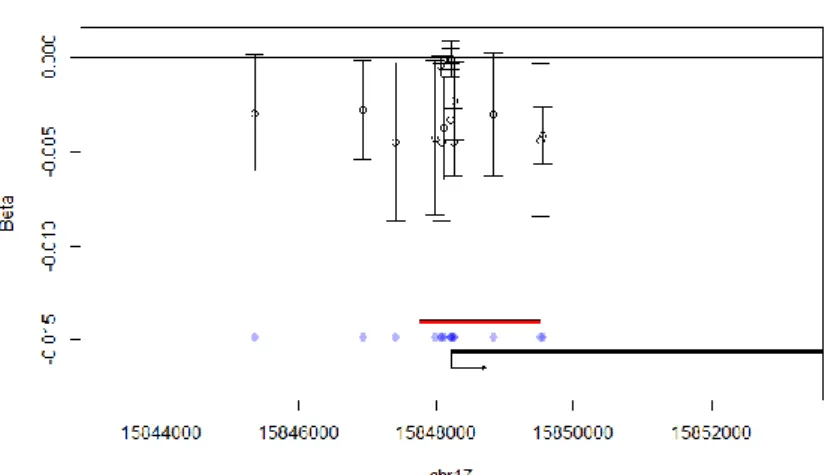
Supplemental material, Table S6). Figure 4 shows the regression coefficient for each of the 447
ADORA2B CpGs against its uncorrected p-value regarding the association with NO2 exposure
448
during the 2nd trimester and the whole pregnancy. Among the 19 CpGs of this gene, 16 were 449
negatively associated with NO2 exposure during the 2nd trimester and the whole pregnancy, and 11
450
(10, respectively) were in the top 1000 of the CpGs associated with placenta-predominantly 451
expressed genes (Figure 4). 452
Figure 4: Visualisation of regional associations between NO2 exposure during pregnancy and
453
ADORA2B methylation indicating the direction of the effect (coefficient) and confidence interval
454
for each CpG . 455
5. Discussion 457
To the best of our knowledge, the present study shows the results of the first genome-wide analysis 458
of differentially methylated probes and regions in placenta in relation to in utero exposure to PM10,
459
NO2, temperature and humidity. Associating a concept-driven analysis with an agnostic EWAS, we
460
showed lower methylation levels in two CpGs located in the body of ADORA2B associated with 461
increased exposure to NO2 during pregnancy, especially in trimesters 1 and 2. The agnostic EWAS
462
further revealed new significant associations of prenatal exposure to PM10, NO2, humidity and
463
temperature during various time-windows and methylation of 4 CpGs (mapped to 2 genes (PSD3, 464
ZNF709) and 2 non genic regions) and 39 regions (Table 3, Table S9), which are candidates for
465
replication in future studies. Among these, several DMR were located in genes pointing towards 466
hypertensive and metabolic disorders. 467
ADORA2B, encoding the Adenosine A2B receptor, was shown to play a role in placental
468
development and possibly in the pathophysiology of hypoxia and preeclampsia (PE) in pregnant 469
women (Acurio et al., 2014; Darashchonak et al., 2014; Jia et al., 2012), a pathology which has also 470
been associated with air pollution exposure during pregnancy (M. Pedersen et al., 2014). In both 471
mice and humans, it has been demonstrated that activation of ADORA2B signalling contributes to 472
the pathogenesis of PE (Huang et al., 2017), to small foetuses, small placentas and foetal growth 473
restriction (Iriyama et al., 2015). The molecular basis of the functional link and relationship 474
between ADORA2B gene and placenta DNA methylation, and the involvement of the ADORA2B 475
protein in PE and birth outcomes are questions to be addressed in future investigations. Additional 476
work will also be required to assess the relevance of ADORA2B as a candidate marker and/or target 477
for the diagnosis, prevention and treatment of PE. 478
Of interest, four DMR were located in CD81, DAXX, NOTCH3 and P2RX4 genes, which have all 479
been implicated in PE phenotypes. P2RX4, a purinergic receptor highly expressed in normal 480
placentas, was shown to be overexpressed in both term and preterm preeclamptic placentas (Roberts 481
et al., 2007) and hypomethylated in preeclamptic placentas (Chu et al., 2014). In our study, NO2
482
exposure in pregnancy, 3rd trimester and last month of pregnancy was positively associated with 483
P2RX4 methylation. In accordance with our result, a CpG of P2RX4 was found hypermethylated in
484
blood from adults exposed to PM2.5 in the previous month (Panni et al., 2016). In addition, our
485
results indicated a positive association of PM10 exposure the day before birth with methylation in a
486
DMR located in CD81 and a negative association with DMRs in DAXX and NOTCH3. CD81, a 487
gene encoding a member of the transmembrane 4 superfamily, was shown to be mainly expressed 488
in normal first trimester placentas and gradually downregulated with gestational age (Shen et al., 489
2017). In early-onset (≤34 weeks) severe preeclamptic placentas, CD81 was up-regulated in 490
syncytiotrophoblasts and extravillous cytotrophoblasts, which play a major role in maternal–fetal 491
exchanges (Malassiné and Cronier, 2002) and placentation (Pijnenborg et al., 2006). The 492
overexpression of CD81 was also demonstrated in a PE-like phenotype in rats (Shen et al., 2017). A 493
recent study demonstrated that DAXX methylation was involved in trophoblast differentiation, PE, 494
and response to hypoxia, suggesting an important role of DAXX in placentation (Novakovic et al., 495
2017). Similarly, NOTCH3 placental expression has been shown down regulated in PE (Fragkiadaki 496
et al., 2015) and up regulated in early onset PE (Zhao et al., 2014). Notch signaling has been 497
suggested to play a key role in cytotrophoblasts motility and differentiation (Haider et al., 2014). In 498
contrast to our finding, NOTCH3 methylation in blood form adults has been positively associated 499
with PM2.5 exposure the previous month (Panni et al., 2016). Further studies are required in order to
500
determine the functional relationship between these genes and their placental methylation. 501
Hypertensive disorders, among which preeclampsia in pregnant women (M. Pedersen et al., 2014), 502
are increasingly suspected as a potential mechanism to explain health effects of air pollutants (Shah 503
et al., 2013). 504
Among air pollutants associated DMR in our study, four were located in LMF1, GNAS, GNASAS, 505
and IL-32 genes. These genes have been previously involved in metabolic syndrome and related 506
phenotypes (Hong et al., 2017). Single nucleotide polymorphisms of LMF1 is involved in severe 507
hypertriglyceridemia (Péterfy, 2012). LMF1 blood methylation in adults has been positively 508
associated with PM2.5 exposure in the previous month (Panni et al., 2016), while our results
509
indicated a negative association of NO2 exposure in the 3rd trimester with placental methylation of
510
this gene. GNAS is an imprinted gene with a complex imprinted pattern ; decreased placental 511
expression has been associated with intra uterine growth retardation (Dunk et al., 2012; McMinn et 512
al., 2006) and cord blood hypermetylation has been associated with gestational diabetes (D. Chen 513
et al., 2014). GNASAS, the GNAS antisense RNA 1, placental expression was related to newborns 514
neurobehavioral profile (Green et al., 2016), while its methylation in adult blood has been linked to 515
prenatal exposure to famine (Tobi et al., 2009). In rabbits, pregnancy exposure to diesel engine 516
exhaust has been associated with changes in triglyceride and cholesterol levels in the offspring 517
exposed in utero (Valentino et al., 2015) but further investigations are required to identify if this 518
association could be to some extent mediated by epigenetic changes. Taken together our findings 519
point to PE- and metabolic syndrome-associated genes, which is in line with the increasing 520
evidence on the relationship between air pollution and the metabolic syndrome (B.-Y. Yang et al., 521
2018) and with the hypothesis that such effects might start early in life (Park, 2017). 522
Significant variations of the methylation levels of other CpGs and DMR, identified either from the 523
concept-driven analysis or from the agnostic EWAS approach, have occasionally been found 524
associated with NO2, PM10, temperature or humidity exposure at specific time windows of
525
pregnancy. However, the biological significance of the differential methylation observed for these 526
genes is unclear (Supplemental material, Table S10). These genes have not been associated with 527
NO2 or proximity to traffic in the two recent EWAS conducted in newborns (Gruzieva et al., 2017;
528
Kingsley et al., 2016). Noteworthy, some of these results were in agreement with air pollution 529
association studies conducted on blood DNA methylation. This was the case for the positive 530
association of methylation in LZTFL1-DMR with average NO2 exposure during pregnancy, 3rd
531
trimester and last month of pregnancy which was consistent with the relationship between LZTFL1 532
blood methylation and chronic PM2.5 exposure observed in an elderly population
Enwerem et al., 2016). The significant (FDR corrected) associations of PM2.5 exposure in the past
534
month and decreased blood methylation in ANKRD45 and LOC254559 and increased blood 535
methylation in TRIO found by Panni (Panni et al., 2016) was in agreement with our findings in the 536
placenta. However, the negative relationship they found between PM2.5 exposure and ZNF563
537
methylation disagree with our results. The small overlap between our results and those of previous 538
published EWAS can be explained by the fact that these studies relied on different tissues. Gruzieva 539
et al. investigated cord blood (Gruzieva et al., 2017) and Kingsley et al. examined placenta samples 540
from the maternal side (Kingsley et al., 2016). DNA methylation is tissue-specific (Ollikainen et 541
al., 2010) and it is likely that different tissue will respond differently to similar environmental 542
stimuli. The fact that DNA methylation is a dynamic mark also explains this absence of overlap 543
between the present results obtained in our population of newborns and other data obtained for 544
different populations and exposure levels. 545
Breton et al. (Breton et al., 2016) found that prenatal exposure to PM10 in the first trimester was
546
associated with lower LINE-1 methylation in 459 newborn bloodspots. A similar result was found 547
in 471 placenta samples where LINE-1 was associated with distance to traffic (Kingsley et al., 548
2016) and in 240 placenta samples where global methylation was linked to first trimester exposure 549
to PM2.5 (Janssen et al., 2013). These studies did not investigate shorter time-windows of exposure.
550
In our study, we also observed a negative relationship between PM10 exposure during the first
551
trimester and LINE-1 and Alu CpG methylation, but our results did not reach statistical 552
significance. In the short-term, PM10 exposure the day before birth was significantly and positively
553
associated with Alu repetitive elements methylation. 554
As for meteorological conditions, we observed a trend for temperature in the first trimester of 555
pregnancy being associated with the methylation distribution profiles (p-value for density function 556
= 0.03, p-value for cumulative distribution function = 0.11). We are aware of only one previous 557
study investigating the effects of meteorological conditions on DNA methylation in blood cells of 558
elderly men (Bind et al., 2014). The authors reported associations of ambient temperature with 559
DNA methylation in genes related to coagulation, inflammation, cortisol, and metabolic pathway 560
and associations of relative humidity with LINE-1 hypomethylation and Alu hypermethylation. In 561
our study, we found two loci, one in ZNF709 and one in a non genic region whose methylation was 562
associated with humidity exposure during the second trimester and the month preceding birth, 563
respectively. We also identified 13 DMRs mapping to 8 genes associated with meteorological 564
exposures. These genes do not seem involved in the inflammation or metabolic pathways 565
previously highlighted with blood methylation, and their association with prenatal meteorological 566
conditions had not been examined so far. 567
A novel feature of our study is the focus on genes with tissue specific patterns of expression, in 568
which we identified first a category of genes that are mostly active in the placenta and silent in 569
other tissues (“active genes”) and second a category of genes with a methylation-dependent 570
repressed state (“silent genes”) in the placenta. The definition of silent and active chromatin points 571
to regions with different dynamics and hence different capacity to respond to signals and to be 572
reprogrammed. In order to identify these regions, we used available transcriptomic data (for 573
selecting genes with specific patterns of expression in placenta) and the present methylome data 574
(list of silent genes with high methylation levels). This original approach not only allowed us to 575
identify potential target CpGs through the activity of their regulatory regions, but also to limit the 576
number of CpG sites to the most relevant ones to be tested in relation to environmental exposures, 577
without limiting the analysis to particular pathways previously identified in the literature. In the 578
context of a constantly expanding number of CpGs interrogated by microarrays and sequencing 579
techniques, which usually exceeds the sample size of the study, replication is often used to validate 580
the findings and limit the risk of false positives. Our strategy was rather to restrict our analysis to 581
the most biologically relevant genes and chromatin regions, which we defined as those prone to be 582
affected by alterations in methylation. Noteworthy, the results of the EWAS, which used a more 583
stringent correction of the p-value, and the DMR analyses strongly supports our finding from the 584
concept-driven analysis that ADORA2B placental methylation could be sensitive to prenatal air 585
pollution exposure. 586
We acknowledge several strengths and limitations to this study. First, our results demonstrate that 587
placental DNA methylation is associated with air pollutants exposure, but we cannot draw 588
conclusions on how gene expression relates to these methylation differences. Second, our study 589
focused on PM10 and NO2 air pollutants exposure, for which high temporally and spatially resolved
590
exposures were available. Air pollution is a complex mixture of compounds which are correlated 591
with the assessed pollutants. PM2.5 are of great concern because they can penetrate deep into the
592
lungs and enter the blood circulation. While our results identified mainly NO2 exposure as
593
associated with placental DNA methylation, we rather interpret this association as an indication of 594
traffic-pollutants association with DNA methylation. Another limitation is the use of residential 595
address to estimate air pollution exposure, which is prone to misclassification due to the lack of 596
consideration of time activity patterns and of indoor exposures. However, we used a high spatially 597
and temporally resolved ambient dispersion model. Third, although we attempted to account for 598
many potential confounders including technical factors and cell heterogeneity, we cannot rule out 599
confounding from unaccounted factors such as physical activity, diet, or genetics. Moreover, since 600
our cohort consists of highly educated mainly Caucasian women, our findings may not be general-601
izable to other populations. An important strength is that the sample size is one of the largest for a 602
study on placental DNA methylation and more generally for an environmental epigenetic study. 603
Samples were collected from the foetal side of the placenta, which is relatively easy to collect, non-604
invasive and may allow a good reproducibility of results since the placenta lifetime is limited to the 605
pregnancy. In perinatal studies, the placenta represents a relevant tissue considered as an accurate 606
‘record’ of children’s in-utero exposures (Maccani and Marsit, 2009) and as a health biomarker due 607
to its master regulator function of the fetal hormonal and endocrine milieu. EDEN is a well 608
characterized mother-child cohort, which allowed the consideration of a large range of potential 609
confounders, including data collected early in pregnancy. 610
611
612
6. Conclusions 613
Among the placenta methylated silent genes, we identified four CpGs, mapped to four genes, whose 614
methylation levels in the foetal placenta were significantly associated with maternal exposures to 615
NO2 and PM10. Among placenta active genes, we found five CpGs, mapped to five genes, whose
616
methylation levels in the foetal placenta were significantly associated with maternal exposures to 617
NO2 and PM10. One of these active genes, ADORA2B, had 2 CpGs whose methylation levels were
618
also significantly associated with NO2 exposure during the second trimester of pregnancy in the
619
EWAS approach after FDR correction of the p-value. The DMRs analyses showed ADORA2B 620
methylation as associated with NO2 exposure in pregnancy and at each trimester of pregnancy.
621
ADORA2B has been implicated in placental development, hypoxia and preeclampsia, a pathology 622
which has been previously associated with air pollution exposure during pregnancy. This latter 623
observation, together with our results, supports the hypothesis that placental DNA methylation is 624
involved in the exposure-disease relationships during pregnancy. Whether the observed associations 625
potentially bear long-term consequences for the health of the child and adult individual, or even 626
possibly for future generations, remains to be investigated. 627
628
7. Acknowledgments 629
We thank the midwife research assistants (L. Douhaud. S. Bedel. B. Lortholary. S. Gabriel. M. 630
Rogeon. and M. Malinbaum) for data collection and P. Lavoine for checking, coding, and entering 631
data. The EDEN mother-child cohort study group includes: I Annesi-Maesano, JY Bernard, J 632
Botton, M-A Charles, P Dargent-Molina, B de Lauzon-Guillain, P Ducimetière, M de Agostini, B 633
Foliguet, A Forhan, X Fritel, A Germa, V Goua, R Hankard, B Heude, M Kaminski, B Larroque, N 634
Lelong, J Lepeule, G Magnin, L Marchand, C Nabet, F Pierre, R Slama, MJ Saurel-Cubizolles, M 635