HAL Id: hal-02965616
https://hal.inrae.fr/hal-02965616
Submitted on 13 Oct 2020
HAL is a multi-disciplinary open access
archive for the deposit and dissemination of
sci-entific research documents, whether they are
pub-lished or not. The documents may come from
teaching and research institutions in France or
abroad, or from public or private research centers.
L’archive ouverte pluridisciplinaire HAL, est
destinée au dépôt et à la diffusion de documents
scientifiques de niveau recherche, publiés ou non,
émanant des établissements d’enseignement et de
recherche français ou étrangers, des laboratoires
publics ou privés.
Distributed under a Creative Commons Attribution| 4.0 International License
Using life cycle assessment to quantify the
environmental benefit of upcycling vine shoots as fillers
in biocomposite packaging materials
Grégoire David, Giovanna Croxatto Vega, Joshua Sohn, Anna Ekman Nilsson,
Arnaud Hélias, Nathalie Gontard, Helene Angellier-Coussy
To cite this version:
Grégoire David, Giovanna Croxatto Vega, Joshua Sohn, Anna Ekman Nilsson, Arnaud Hélias, et al..
Using life cycle assessment to quantify the environmental benefit of upcycling vine shoots as fillers in
biocomposite packaging materials. International Journal of Life Cycle Assessment, Springer Verlag,
2020, �10.1007/s11367-020-01824-7�. �hal-02965616�
SUSTAINABILITY OF FOOD P&P SYSTEMS
Using life cycle assessment to quantify the environmental benefit
of upcycling vine shoots as fillers in biocomposite
packaging materials
Grégoire David1 &Giovanna Croxatto Vega2&Joshua Sohn2&Anna Ekman Nilsson3&Arnaud Hélias4& Nathalie Gontard1&Hélène Angellier-Coussy1
Received: 3 January 2020 / Accepted: 21 September 2020 # The Author(s) 2020
Abstract
Purpose The objective of the present study was to better understand the potential environmental benefit of using vine shoots (ViShs), an agricultural residue, as filler in composite materials. For that purpose, a comparative life cycle assessment (LCA) of a rigid tray made of virgin poly(3-hydroxybutyrate-co-3-hydroxyvalerate) PHBV, polylactic acid (PLA) or polypropylene (PP), and increasing content of ViSh particles was performed. The contribution of each processing step in the life cycle on the different environmental impacts was identified and discussed. Furthermore, the balance between the environmental and the economic benefits of composite trays was discussed.
Methods This work presents a cradle-to-grave LCA of composite rigid trays. Once collected in vineyards, ViShs were dried and ground using dry fractionation processes, then mixed with a polymer matrix by melt extrusion to produce compounds that were finally injected to obtain rigid trays for food packaging. The density of each component was taken into account in order to compare trays with the same volume. The maximum filler content was set to 30 vol% according to recommendations from literature and industrial data. The ReCiPe 2016 Midpoint Hierarchist (H) methodology was used for the assessment using the cutoff system model.
Results and discussion This study showed that bioplastics are currently less eco-friendly than PP. This is in part due to the fact that LCA does not account for, in existing tools, effects of microplastic accumulation and that bioplastic technologies are still under development with low tonnage. This study also demonstrated the environmental interest of the development of biocomposites by the incorporation of ViSh particles. The minimal filler content of interest depended on the matrices and the impact categories. Concerning global warming, composite trays had less impact than virgin plastic trays from 5 vol% for PHBV or PLA and from 20 vol% for PP. Concerning PHBV, the only biodegradable polymer in natural conditions in this study, the price and the impact on global warming are reduced by 25% and 20% respectively when 30 vol% of ViSh are added.
Conclusion The benefit of using vine shoots in composite materials from an environmental and economical point of view was demonstrated. As a recommendation, the polymer production step, which constitutes the most important impact, should be optimized and the maximum filler content in composite materials should be increased.
Responsible editor: Carlo Ingrao
Electronic supplementary material The online version of this article (https://doi.org/10.1007/s11367-020-01824-7) contains supplementary material, which is available to authorized users.
* Grégoire David
greg.david31@gmail.com
1
JRU IATE 1208—CIRAD/INRA/Montpellier Supagro, University of Montpellier, 2 Place Pierre Viala, Bat 31, CEDEX 01, F-34060 Montpellier, France
2
Department of Management Engineering, Technical University of Denmark, Lyngby, Denmark
3
Agrifood and Bioscience, RISE Research Institutes of Sweden, Ideon, SE-223 70 Lund, Sweden
4 JRU Itap, IRSTEA/Montpellier SupAgro, University of Montpellier,
Montpellier, France
Keywords Biocomposite . Life cycle assessment . Packaging . Poly(3-hydroxybutyrate-co-3-hydroxyvalerate) . Vine shoots . Extrusion
1 Introduction
In viticulture, every winter after pruning, large quantities of vine wood are produced that are currently underutilized. Pruning of vine shoots (ViShs) is necessary in order to im-prove growing conditions for the plant, as well as to increase the yield and quality of grapes. Vine shoots can be from 1 to 2 m long, and production amounts to between 1 and 2.5 t of dry matter per hectare per year (Galanakis2017). The productivity of the vine plant depends on the region where it grows, the pruning method, and the vine species. In Languedoc-Roussillon (LR), a wine region in the south of France, ViSh production amounts to 500,000 t per year (IFN, FCBA, Solagro 2009). Currently, management of vine shoots in France is done by either collecting and burning the ViSh or leaving them on the vineyards where they are rough-cut and used as organic fertilizer (FranceAgriMer2016). When used as biofertilizers, ViSh should be considered by-products and not waste. However, their use as soil amendment can be prob-lematic, as decomposing ViSh may serve as vector for dis-eases for the following vine crop (Chambre régionale d’agriculture Nouvelle-Aquitaine and DRAAF/SRAL Nouvelle-Aquitaine2017). Furthermore, it is worth noting that ViSh is not the most judicious biofertilizer since its bio-degradation, i.e., mineralization in soil, competes with the vine’s growth with regard to nitrogen consumption (Keller
2015). Less commonly, ViShs are used as fuel wood or com-post, which are considered low-value uses for this potential resource. Regarding the ambitious goals set by the European community for a b ioecon omy, which include the decarbonization of the economy through an 80-95% decrease of CO2emissions by 2050 (Scarlat et al.2015), ViShs present a valuable resource for implementing decarbonizing recovery strategies. These strategies can be achieved in a biorefinery context, where cascading treatments of ViSh are investigated to produce value-added products, including the production of lignocellulosic fillers for biocomposite applications (Kilinc et al.2016; David et al.2019,2020a). Lignocellulosic fillers from agricultural residues present the advantages that, in ad-dition to their fully biodegradability in natural conad-ditions, they have a lower density than conventional inorganic fillers and are highly available at a low price, with no competition from the food sector (Mohanty et al.2001). ViShs present a great opportunity in the field of biocomposites, with a potential application being rigid food packaging that is biodegradable in natural conditions (David et al.2020c; Guillard et al.2018). On the other hand, the global plastic market is continuously growing having reached 350 million tons in 2018, with 40% of the production used in the packaging sector (PlasticsEurope
2018). The massive amount of plastics used each year results in a constant accumulation of plastic wastes in our environ-ment (Geyer et al. 2017). The associated effect of this on ecosystems, wildlife, and humans is worrying, if not yet fully understood. For this reason and the concern about global warming, fully bio-sourced and biodegradable materials such as biocomposites are emerging as a possible solution to tackle the problem of accumulation of plastic in our environment and to reduce greenhouse gas emissions. Poly(3-hydroxybutyrate-co-3-hydroxyvalerate), called PHBV, is a promising bacterial biopolymer that is biodegradable in the soil and ocean, and that can be synthetized from many types of carbon residues. PHBV can be combined with natural fillers to create fully biodegradable biocomposites, e.g., for application in rigid trays (Berthet et al. 2015a; Lammi et al.2018). Moreover, PHBV displays similar mechanical and barrier properties as polyprolylene (PP) and can therefore act as a viable substitute for this fossil-derived and non-biodegradable conventional polymer (Chodak2008). A competitor to PHBV is polylactic acid (PLA), which is the most widely commercialized bio-sourced plastic currently in the market. However, it is worth noting that PLA is not fully biodegradable in natural condi-tions, but only compostable in industrial conditions (Gurunathan et al. 2015), which requires collection and sorting in order to achieve a valuable end of life management and does not avoid concerns related to plastic accumulation from littering or leakage.
The development of biocomposites is largely motivated by either an improvement of the overall technical performance, the need for specific mechanical properties, a decrease of the overall cost of materials, and the improvement of the carbon footprint, by replacing a part of non-renewable fossil re-sources (Mohanty et al.2005). Biocomposites are thus gener-ally presented as eco-friendly materials. However, most of the time, the environmental benefit is not quantitatively proven (Civancik-Uslu et al.2018). It is thus necessary to ensure that the biocomposites are actually capable of mitigating the abovementioned environmental problems, as the use of bioplastics and natural fillers to produce biocomposites does not automatically make them sustainable. In order to quanti-tativ ely v erify env iron menta l claims made abo ut biocomposites and other innovative materials, it is possible to carry out environmental assessments.
Life cycle assessment (LCA), which is a holistic tool capa-ble of measuring environmental impacts of products and ser-vices, can be applied to emerging biomaterials (Hauschild et al.2018). It investigates the inputs (i.e., resources and en-ergy) and outputs (i.e., waste gases, wastewater, and solid waste) across the entire life cycle stages (cradle-to-grave).
LCA allows location of“hot spots” in the life cycle and avoids the shifting burdens from one life cycle stage to another while accounting for all types of emissions and resource consump-tion (Qiang et al.2014). Its main limits are the collection of data, which can be difficult, and the initial assumptions that need to be justified. Most of the LCAs carried out for biocomposites focus on the comparison of natural fillers with synthetic fibers (Kim et al.2008; Le Duigou et al. 2011; Civancik-Uslu et al.2018), especially for applications in the automotive industry (Joshi et al.2004; Duflou et al. 2012; Boland2014). Generally, natural fillers tend to have a better environmental performance than glass fibers, notably thanks to the weight reduction of the composites and their low energy demand for production (Joshi et al.2004).
There are fewer papers in the literature regarding the envi-ronmental advantage of incorporating natural fillers in poly-mer matrices. In a previous study considering 1 kg of material as functional unit, the environmental impacts of materials made of virgin polyolefins (PP and HDPE) and biocomposites with natural fillers (derived from rice husks and cotton linters) were compared (Vidal et al.2009). The LCA showed that composites displayed lower environmental impacts in all im-pact categories, except eutrophication, due to the use of fertil-izers for rice cultivation. Similarly, it was shown that the in-corporation of either wood flour or wood fiber allowed for reducing the environmental impacts of HDPE (Xu et al.
2008) and PP (Xu et al.2008), respectively, in proportion to the filler content.
LCAs of vine shoots and their incorporation in composites were not found in the literature. The combustion of ViSh and induced emissions have previously been studied (Spinelli et al.2012; Picchi et al.2013) without LCA tools. More re-cently, Gullón et al. performed a LCA of the valorization of vine shoots into antioxidant extracts, and other bioproducts from a biorefinery perspective (Gullón et al.2018). They de-termined that ViSh production-related processes should be burden-free in the biorefinery system since the environmental impacts were entirely allocated to the grape harvesting, as ViShs were considered agricultural waste (Sanchez et al.
2002; Max et al.2010).
Concerning PHBV, no process data is currently available in the Ecoinvent database. However, as shown by Yates and Barlow (2013), several LCAs about bioplastics including PHBV are available in the literature. Inventory data from these papers can be used (Harding et al.2007; Yates and Barlow
2013).
In this context, the objective of the present study was to better understand the potential environmental benefit of using vine shoots as raw resources for the production of lignocellu-losic fillers for biocomposite applications. For this purpose, a comparative life cycle assessment was carried out, first on rigid trays made out of virgin PHBV, polylactic acid (PLA), or polypropylene (PP). Then, the effect of ViSh incorporation
in these 3 polymer matrices was studied, utilizing a cradle-to-grave approach. The contribution of each life cycle step was identified and discussed. Furthermore, the balance between the environmental and the economic benefits of composite trays was discussed.
2 Methodology
2.1 Goal and scope
The aim of this article was to determine to what extent addi-tion of ViSh fillers in packaging trays was environmentally beneficial when compared with trays produced entirely from virgin plastics. For that purpose, the environmental perfor-mance of packaging trays produced in France from either 100% virgin plastics or related ViSh-based biocomposites was assessed. Composites with three polymer matrices, i.e., PHBV, PLA, and PP, and different filler contents were com-pared. The ReCiPe 2016 Midpoint Hierarchist (H) method was used during the impact assessment phase. All background data used in the assessment were obtained from the Ecoinvent v.3.4 database (Wernet et al. 2016) with the cutoff system model and processed using the LCA software Simapro v.8.5 (PRé Sustainability2018). The cutoff approach was chosen to reduce the potential for conflating information and to simplify the product system. Based on the“cutoff” approach, the used product from a first life is considered to be waste that does not bear any environmental burden from previous life.
The functional unit was a tray of standard model (176 × 162 × 40 mm, GN 1/6 type), 25 cm3in volume, for single-use packaging, produced by injection molding. It was assumed that all the considered trays had the sufficient properties to provide the same service. The volume of the trays was thereby kept equal throughout the assessment. However, due to the intrinsic densities of the considered materials, the final weight of the trays varied according to the nature and the proportion of each constituent. The scenarios included in this study were trays of virgin PHBV, PLA, and PP, and trays of PHBV, PLA, and PP filled with milled vine shoots.
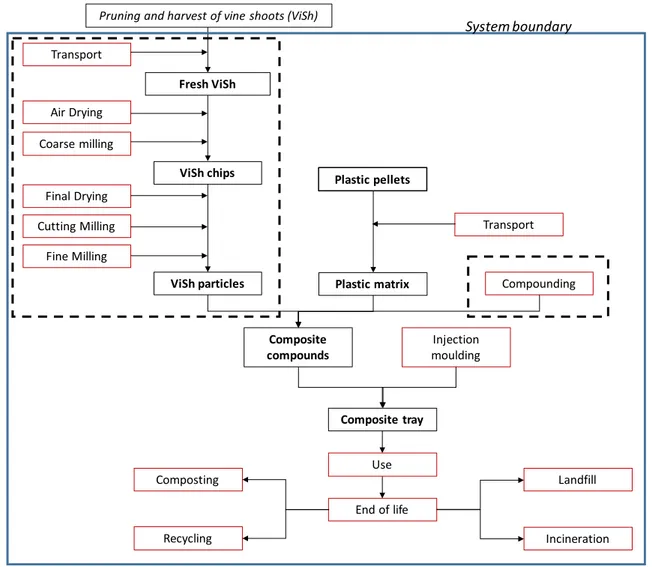
Figure1 displays the system boundary considered in the present study, with the different life cycle steps that were included. It was assumed that the collection of vine shoots and the production of the trays were done in the Languedoc-Roussillon region of France. In the case of 100% virgin plastic trays, the steps encased by dashed lines in Fig.1were irrele-vant because they concerned the ViSh treatment and compounding steps.
The pruning is a necessary process that is independent from the fate of the ViSh. It is difficult to estimate the exact propor-tion of burnt ViSh because this practice, which is a common fate for ViSh, is in theory forbidden, but derogations and tol-eranc es still exist (Min istère de l’écologie et du
développement durable2011). According to FranceAgriMer, burning of ViSh accounts for between 25 and 50% in France (FranceAgriMer2016; Gazeau et al. 2018). In the present study, ViShs burnt on site or without valorization were con-sidered. In that case, the collection of the ViSh happens any-way in order to remove ViSh from the vineyards and it was therefore considered a part of the grape cultivation production system. Furthermore, ViShs have no market value, and there-by, zero environmental impact would be allocated to them if allocation were to be used. ViShs were, thus, considered burden-free in the present system. Additionally, ViSh being produced in a wine-grape production system, all the environ-mental impacts of production were ascribed to the production of wine grapes. Therefore, pruning and harvest of ViSh were considered out of the system boundary.
The main properties of the raw materials are presented in Table 1. They correspond to commercial-grade PHBV ( P H I 0 0 2 f r o m N a t u r e p l a s t ) , P L A ( P L I 0 0 3 f r o m Natureplast), and PP (PPH9020 from Total Petrochemical).
The density of ViSh was experimentally determined, as ex-plained inSupplementary Data.
It was previously shown that increasing the content of ViSh in PP (Girones et al.2017), PE (Girones et al.2017), or PHBV (David et al.2020b) resulted in a slight decrease of the me-chanical properties of the materials. Ahankari et al. (2011) studied the reinforcement of PHBV and PP with agro-residues and recommended to incorporate filler contents lower than 40 wt% to avoid a decrease in mechanical properties, due to an increased filler agglomeration in the polymer matrix. Confirming this, Berthet et al. (2015b) observed that the pro-cessability of PHBV/wheat straw biocomposites became dif-ficult when the filler content was above 40 wt%. Authors usually considered weight filler contents. However, consider-ing that the volume of the injected moldconsider-ing tray remains con-stant whatever the matter, it was considered that the use of volume filler contents was more pertinent to compare the dif-ferent formulations. Given that, it was assumed that the max-imum ViSh filler content to attain satisfactory physical Fresh ViSh
Pruning and harvest of vine shoots (ViSh)
Cutting Milling Injection moulding Final Drying Composite tray Compounding Plastic pellets End of life Transport Air Drying Coarse milling ViSh particles ViSh chips Composite compounds Transport Landfill Composting Incineration Recycling System boundary Fine Milling Plastic matrix Use
properties for the tray application was 30 vol% for all the composites. This was also in accordance with the filler content currently used in commercialized composites (Vitis Valorem, Meursault, France, PLA or PP-Sarmine® products). This set limit of 30 vol% corresponded to a weight content of 32 wt% for PHBV and PLA, and 39 wt% for PP (for a given filler volume content and a tray volume, the filler weight content depends on the density of each constituent).
2.2 Life cycle inventory
The inventory is based on figures derived from communica-tions with different industrial producers: one company expert in micronization of powder (SD-Tech Group, Alès (Gateau
2019)); one company specialized in the valorization of vine shoots into biocomposites (Vitis Valorem, Meursault (Grangeot2019)); the French technical center of plastics and composites (CT-IPC, Bellignat (CT-IPC2019)); and one company expert in the injection of plastic trays (Fürstplast, Fourques (Hreblay 2019)). They were interviewed from January to June 2019. The data that was collected was ana-lyzed, compared with theoretical figures, and then finally se-lected. After this collection of data, existing processes from the Ecoinvent database were adapted to fit the collected data. In accordance with the geographical boundary of the assess-ment, all the electricity used in the foreground systems was assumed to be provided by the French energy mix.
2.2.1 Raw materials
Polymer matrices were PHBV, PLA, and PP. Ecoinvent pro-cesses data recorded for fossil-based PP and PLA from maize grain were used in the LCA. Inventory for PHBV made from sugar cane was obtained from the work of Harding et al (Harding et al.2007). Transport of plastic matter to the pro-duction facility was taken into account using the“Background data for transport” sheet from Ecoinvent as the specific trans-port mode was unknown (Borken-Kleefeld and Weidema
2013).
For all tested scenarios, lignocellulosic fillers were obtain-ed from the dry milling of ViSh collectobtain-ed in the Languobtain-edoc- Languedoc-Roussillon region. In keeping with status quo practices, ViShs
were collected during the winter after pruning and initially had a moisture content of 40 wt% (w.b.).
Transport of ViSh from the field to the filler producing site was assumed to be done by a 3.5–7-t lorry with an average distance of 10 km according to Vitis Valorem (France) infor-mation (Grangeot2019).
2.2.2 Production of biocomposite trays
Practical information about the handling of ViSh as raw ma-terial for the production of biocomposites was provided by Vitis Valorem (France) (Grangeot2019). Commonly, ViShs are first air-dried outdoors for 7 months, between January and August. The corresponding land use was determined consid-ering that the ViShs are arranged on the ground reaching an average height of 2 m, with an apparent density of 30 kg m−3. Only manual labor was used during this step. At the end of this period, the moisture content of ViSh was 20 wt% (w.b.).
Coarse milling with a common wood chipper (Greentec 952, Ufkes Greentec BV, Netherlands) was utilized to mill the ViSh. The throughput was set at 2000 kg h−1, and 10% of the initial ViSh mass were assumed lost during the milling process. Output chip sizes ranged between 3 and 6 cm in their largest dimension. The output is called“ViSh chips.”
An additional drying step was required to reduce the mois-ture content of the ViSh to 5 wt% (w.b.) after air drying. An existing drying process from the Ecoinvent database was used (seeSupplementary Data), modified to utilize the French elec-tricity grid.
After coarse milling, a finer milling process in two steps is needed in order to obtain particles of between 0.3 and 0.05 mm in size. First, ViShs were milled using a cutting mill type SM 300 (Retsch, Germany) with a 2.0-mm sieve, and secondly, they were milled with a fine impact mill (CUM 150, Netzsch Condux, Germany). The final output is hereafter called “ViSh particles.” Data for milling were provided by SD-Tech Group (Alès, France) (Gateau2019).
Flexible intermediate bulk containers (FIBC, commonly known as“Big Bags”) were used to store the ViSh chips after coarse milling, ViSh particles after fine milling and composite granules after compounding. It was assumed that each FIBC was used 3 times per year during a period of 5 years before
Table 1 Different properties for the components of the studied biocomposites. Density (g cm−3) Weight (g) (25 cm3 tray) Melting temperature (°C) Degradation (°C) Young’s modulus* (GPa) Stress at break* (%) Strain at break* (%) PHBV 1.23 30.75 170 200 4.2 40 3.2 PLA 1.24 31 150 250 3.5 45 3 PP 0.91 22.75 165 320 1.7 37 8 ViSh 1.36 - - 230 na na na *According to the standard ISO 527
being discarded. Each FIBC had a mass of 2.5 kg with a capacity of 1 m3, and it is made from PP. ViSh chips after coarse milling, finely milled ViSh particles and composite granules had a bulk apparent density of 200 kg m−3, 420 g m−3, and 700 g m−3, respectively.
During the compounding step, the plastic was mixed with ViSh fillers in an extruder. The extrusion process in Ecoinvent was adapted with data from Vitis Valorem (Grangeot2019), which uses a compounder, model ZSE 160 HP (Leistritz, Nuremberg, Germany). Electricity consumption of the compounding step was 300 kWh t−1,and the yield is 97.6%. In the assessment, the same yield and energy data is used for all compounding regardless of composite granule type. No plasticizers nor additives were used.
It was assumed that the trays were produced by injection molding of compounds. The injection molding process in Ecoinvent was modified to incorporate provision of electricity from the French electricity mix. The yield was assumed to be 99.4% because scrap and waste could be recycled in a nearly closed loop.
It was further assumed that all of the previously described steps (from air drying to injection molding) occurred at the same location. Table2recaps the data collected and used in the inventory of the production of biocomposite trays.
2.2.3 Use phase
It was assumed that the use phase of the biocomposite trays was comprised of the transport from the factory gate to the place at which they are used as food packaging and then to the distribution site. This transportation was assumed to be done utilizing a 32-t lorry with an average distance of 100 km for each transport stage (Labouze and Le Guern2007). The use
by the consumer was assumed to be the same for all assessed materials and thus was omitted from the assessment. 2.2.4 End of life
The end of life (EoL) of each tray was defined according to French practices for municipal waste (ADEME 2018) and considering the characteristics of the materials and existing facilities (Table3). With regard to transport in the end of life, it was estimated that the trays traveled on average 100 km from household to a waste treatment center (Beigbeder et al.
2019). Transport was assumed to happen by a 16–32-t lorry,
EURO5 from Ecoinvent.
Concerning composting, only industrial compositing was included due to the lack of data for home composting. The incineration process from Ecoinvent was adapted to account for CO2emissions and the origin of carbon (biogenic or fos-sil). Anaerobic digestion could be an end of life option for bioplastics and biocomposite trays, but was not included in the possibilities because it is not widely used in France, and it is more dedicated to agricultural wastes than composite materials.
A more detailed inventory for the production of biocomposites is given in the supplementary inventory (SI) of this paper.
3 Results and discussion
3.1 Environmental impact of 100% virgin plastic trays:
comparison of PHBV, PLA, and PP
First, the environmental performance of 100% plastic trays without ViSh fillers was compared (Fig.2). Trays made of
Table 2 Foreground data collected concerning the production biocomposite trays
Step Foreground data collected Comments Unit of the process Source Air drying Duration: 7 months Moisture content from 40 to 20 wt% m2a (square-meter-years, land
use occupation)
Vitis Valorem Height of the pile: 2 m
Density of ViSh: 30 kg/m3
Coarse milling Throughput: 2000 kg/h Ref: Greentec 952 h (duration) Vitis Valorem Yield: 90%
Drying step Yield: 100% Moisture content from 20 to 5 wt% l (volume of evaporated water) Vitis Valorem Cutting milling Throughput: 30 kg/h Ref: SM 300 Retsch kg (mass of matter to transform) SD-Tech
Yield: 99%
Nominal power machine: 3 kW
Fine milling Throughput: 29 kg/h Ref: CUM 150 Netzch Condux kg (mass of matter to transform) SD-Tech Yield: 99%
Nominal power machine: 7.5 kW
Compounding Yield: 97.6% Ref: ZSE 160 HP Leistritz kg (mass of matter to transform) Vitis Valorem Electricity consumption: 300 kWh/t
PP displayed lower impacts than those of PLA or PHBV trays in all the midpoint impact categories except for fossil resource scarcity. This could be explained by the fact that the density of PP (0.91 g cm−3) was lower than those of PHBV or PLA (1.23 and 1.24 g cm−3, respectively). Thus, in order to get the same tray, i.e., with the same volume, a smaller amount of PP (in mass terms) was needed, i.e., 22.75 g instead of 30.75 g for PHBV (Table1). Similar results were found showing that when compared by volume rather than weight, PHBV had higher environmental impacts than PP or PE (Tabone et al.
2010). Moreover, the production of 1 kg of PHBV or PLA induced higher impacts than the production of PP. Impacts for stratospheric ozone depletion, freshwater and marine eutrophication, land use, and water consumption were very low for PP, in comparison with the assessed bioplastics. This is primarily because the life cycle of PP does not have agri-culture activities, which, in this assessment, heavily contribut-ed to the above namcontribut-ed impact categories. On the other hand, the fossil resource scarcity impact for PP was the highest, at
least in part, because PP is entirely made from fossil resources. In regard to the assessed bioplastics, results showed that PLA induced the greatest impact for 13 out of the 18 impact categories.
The impact of each production step on global warming is presented in Fig.3. The production of polymer pellets was the largest contributor to induced impacts throughout the life cy-cle of a plastic tray, accounting for more than half of the burden for PP and more than 80% for PLA and PHBV. The PP tray impacts were 30% lower compared with bioplastic trays. This suggests that the substitution of traditional plastic trays with bio-based materials does not always result in a lower environmental impact. Nevertheless, conventional plas-tic industries have a high degree of optimization, which is not the case for bioplastics that are produced in low tonnage with relatively less developed technologies. This is exemplified by PP, a petrochemical matrix polymer, for which the production has been highly improved over nearly 70 years of develop-ment, whereas the development of biopolymers is recent; thus,
0% 20% 40% 60% 80% 100%
Tray PHBV Tray PLA Tray PP
Fig. 2 Environmental impact for all impact categories of the ReCiPe 2016 (H) method, for 100% virgin plastic trays Table 3 Current possible end of life of the different trays (in weight %) from (ADEME2018)
Tray material Landfill (%) Incineration (%) Recycling (%) Composting (%)
PP 34.6 36.5 28.9 0.0 PP-ViSh composite 48.7 51.3 0.0 0.0 PHBV 38.0 40.0 0.0 22.0 PHBV-ViSh composite 38.0 40.0 0.0 22.0 PLA 38.0 40.0 0.0 22.0 PLA-ViSh composite 38.0 40.0 0.0 22.0
they have not yet reached the same level of technological maturity. This leads one to the determination that further re-search on the optimization of the bioplastics processing to-ward their environmental improvement should be conducted (Vidal et al.2009). Therefore, it is expected that the environ-mental impacts induced by the production of bioplastics will be smaller than those observed in status quo production—and thus less than the impacts exhibited by the production reflected in the present study.
The use phase was not a large contributor to the overall life cycle, representing less than 0.5% of the global warming for each formulation of tray. It is interesting to note that the end of life was more important for PP than for bioplastics, with end of life accounting for 26% and 2% of the total burden, respec-tively. This was mainly attributed to the incineration process. Incineration was more favorable for bioplastics and biocomposites because the carbon released was biogenic, un-like that from fossil-based plastics. The landfilling contribu-tion to global warming was low, representing less than 5% of the PP end of life impacts, because PP was not assumed to be decomposed in the landfill. It must be noted that recycling of PP is an empty process because of the cutoff at recycling, meaning that the recycling benefit and costs are allocated to the production of new PP material.
In the present study, it was assumed that all the plastic wastes were managed without littering, but in reality, a non-negligible proportion of plastic waste ends in nature. In the world since 1950, 79% of plastic waste has accumulated in landfills or the natural environment (Geyer et al.2017). Long-term impacts such as the accumulation of microplastics in the environment are currently not taken into account in LCA or only taken into account via unconnected tabulation of microplastic generation potential (Lee et al. 2014). Thus, some of the benefits of using bioplastics that fully biodegrade in natural conditions, relative to those that do not, are not quantified nor included in the analysis. This is particularly relevant for PHBV, which, unlike PLA, is fully biodegradable in soil and does not require industrial composting (Hermann et al.2011). Furthermore, gas emissions from petrochemical polymer degradation, which have recently been demonstrated
to produce methane and ethylene emissions under sunlight conditions in both water and air, are also not accounted for in LCA (Royer et al.2018).
The nutrient contents of bioplastics (e.g., nitrogen and phosphorus) are so small that the benefit for reducing fertilizer use can be ignored. However, the sequestration of carbon in soil and the soil improvement properties are potential benefits of organic compost (Kim et al.2008). Nevertheless, these are difficult to quantify and are considered outside of the scope of the present work.
3.2 Effect of the incorporation of ViSh fillers on the
environmental performance of trays
A composite is the combination of two components: a matrix that constitutes the continuous phase, viz. PHBV, PLA, or PP in the present study, and fillers that corresponds to the dis-persed phase, viz. ViSh particles in the present study. The global warming impact for 1 kg of material is displayed in Fig.4for the 4 possible constituents of composite materials. It was readily apparent that ViSh fillers exhibited a lower impact (0.26 kg CO2eq/kg) than the polymer matrices (3.47, 3.58, and 2.29 kg CO2eq/kg for PHBV, PLA, and PP, respectively). The ViSh global warming impact was nearly 9 times smaller than that of the PP matrix. This was due to the advantage of using agricultural residues that only required transport, drying, and milling.
Figure5shows how the global warming impact was affect-ed by an increasing filler content in biocomposites. Similar figures for the other midpoint impact categories are available in SI. Through this assessment, a decreasing burden of the composite with increasing filler content was observed. Thus, the incorporation of ViSh appeared to be beneficial concerning global warming. It is worth noting that the pro-duction of composites required an additional compounding step and that the density of ViSh was 50% greater than that of PP, i.e., 1.36 g cm−3for ViSh compared with 0.91 g cm−3 for PP. The burden incurred by the compounding step was noticeable for composites with very low filler contents. As the production of biocomposites induced an additional use
G lobal w a rm in g (kg C O2 eq) 0 0.05 0.1 0.15 PHBV PLA PP EoL Use Injection Matrix
Fig. 3 Global warming impact of one 100% plastic tray (without fillers)
of energy, in all cases, composite with 1 vol% of ViSh had a higher global warming impact than respective virgin polymer matrices. The negative impact of the additional compounding step should be thus compensated for by the incorporation of increasing contents of ViSh particles in the polymer matrix. The magnitude of the decrease in impacts varied depending on the matrix type. For PHBV, PLA, and PP, the slope was re-spectively 1.00, 1.05, and 0.68 mg CO2eq/%ViSh. Thus, the use of ViSh was beneficial from 5.5 vol% for PHBV and PLA, whereas the ViSh benefit in PP was first observed for a volume filler content of 20.0 vol%. PHBV-based composites had a lower contribution to global warming than 100% virgin PP tray, starting from a PHBV matrix with ViSh content of 44 vol%. However, this filler content is too high to be considered realistic, when taking into account the processability of the materials and their resulting mechanical properties. Global warming of PP-based composites was higher than PHBV-ViSh composites, only when reaching a PHBV-ViSh content of 98.5 vol% and higher, which was of course a non-realistic formulation.
The filler content from which the addition of ViSh in the composite resulted in a benefit for all impact categories is
displayed in Fig.6. PHBV and PLA displayed similar results; the incorporation of ViSh improved the environmental im-pacts for all the categories except for ionizing radiation. If ionizing radiation was to be used as a single score indicator, then biocomposites would never exhibit lower impact than 100% virgin plastic trays because of the electricity needed for the milling, drying, and compounding steps of ViSh. The high ionizing radiation impact is mainly due to the French electricity mix, which includes a large share of electricity pro-duced from nuclear power. In the case of PP, PP-based com-posite trays can be better than 100% PP trays in 10 of the 18 midpoint impact categories. The ViSh burden was higher than PP matrix in 4 midpoint impact categories, so accordingly the composite exhibited greater impacts in strastospheric ozone depletion, ionizing radiation, land use, and mineral resource scarcity than virgin PP. Similarly, the compounding step was responsible for the higher impact in water consumption and terrestrial ecotoxicity. Finally, the increased freshwater and marine eutrophication burden was due to the end of life of the composite. The black dashed line in Fig.6represents the limit of acceptable filler content of 30 vol% in the composite to ensure the functional unit. Thus, freshwater and marine
0.05 0.07 0.09 0.11 0.13 0.15 0% 10% 20% 30% 40% 50% 100% PHBV tray PHBV/ViSh composite tray (x% of ViSh)
100% PP tray PP/ViSh composite tray (x% of ViSh)
100% PLA tray PLA/ViSh composite tray (x% of ViSh) G lobal w a rm in g (kg C O2 eq)
+
+
+
Filler content (vol%)
Fig. 5 Global warming impact (kgCO2eq) as influenced by the
filler content (vol%) for composite trays 0 1 2 3 4
PHBV matrix PLA matrix PP matrix ViSh filler
G
lobal
w
a
rm
in
g
(kg
C
O
2eq)
Fig. 4 Global warming impact (kg CO2eq/kg) of 1 kg of each
ecotoxicity and human non-carcinogenic toxicity were other impacts that PP-based composite could not improve relative to virgin PP.
According to results presented in Fig.5and Fig.6, it could be concluded that increasing the ViSh filler content in the composites as much as possible, while respecting the restric-tions set by material properties, was globally the best for the environment for all biocomposites. However, for PP, the in-clusion of ViSH presents a case of burden shifting that would require more interpretation in order to determine overall envi-ronmental impact.
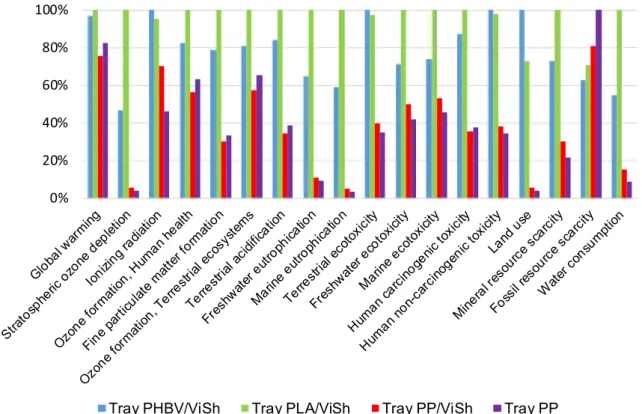
The environmental performance of composite trays filled with 30 vol% of ViSh particles was assessed in detail (Fig.7). The 100% virgin PP tray was also added as reference. As previously described in Section3.1, results were largely influ-enced by the nature of the matrix, mainly due to differences in density. PLA composites exhibited the highest environmental impact except for ionizing radiation, terrestrial ecotoxicity, human non-carcinogenic toxicity, and land use where PHBV exhibited the worst impacts. As expected, PP-based materials exhibited the highest impacts concerning fossil re-source scarcity.
As shown on Fig.8, global warming impacts of trays with 30 vol% ViSh fillers were significantly lower than those of trays made from 100% virgin plastics. This was in line with a previous study on the production of biocomposites with wheat straw (EcoBioCAP 265669
2013). The contributions were divided in three catego-ries: (i) raw materials for matrix and ViSh fillers, (ii) processing for compounding and injection steps, and (iii) use and the end of life. The incorporation of 30 vol% of fillers reduced the global warming burden of the raw materials by 25% relative to a 100% plastic tray. Moreover, the end of life impacts were also
reduced for bioplastics. In the case of a PP-based com-posite, PP could not be considered recyclable anymore, due to the presence of ViSh filler, inducing a slight increase of the EoL impact. Furthermore, the higher density of the composite materials relative to the pure plastics resulted in higher impacts from the injection molding step. And, the addition of ViSh came with an additional step of compounding, which had a relatively low impact compared with the injection molding cess, as it represented 20% of the burden of the pro-cessing. Thus, the incorporation of 30 vol% of ViSh in trays reduced their global warming effects by 19.6%, 19.9%, and 8.5% for PHBV-, PLA-, and PP-based trays, respectively.
3.3 Identification of the hot spots
3.3.1 ViSh filler production: contribution of each step to the environmental impact
The main contributor to the environmental impacts of ViSh particles was the milling steps (Fig. 9). Milling represented 72% of the global warming impact, followed by the drying steps, with a contribution of 22%. The most burdensome type of milling was coarse milling, though there was no impact for ionizing radiation because the energy came from diesel fuel. This was contrary to electricity-powered cutting and fine mill-ings. The fine milling step caused more impacts than cutting milling because more energy (electricity) is needed to get micrometric particles than millimetric particles. This should be expected, as total energy consumption increases as the particle size decreases regardless of milling equipment type (Mayer-Laigle et al. 2018). The final drying step also con-sumed energy, but in the form of heat from steam in the
0% 20% 40% 60% 80% 100%
Global warming Stratospheric ozone depletion Ionizing radiation Ozone formation, Human health Fine particulate matter formation Ozone formation, Terrestrial ecosystems Terrestrial acidification Freshwater eutrophication Marine eutrophication Terrestrial ecotoxicity Freshwater ecotoxicity Marine ecotoxicity Human carcinogenic toxicity Human non-carcinogenic toxicity Land use Mineral resource scarcity Fossil resource scarcity Water consumption
Filler content (vol%)
PHBV PLA PP
Fig. 6 Filler content (vol%) from which a composite tray results in lower environmental impacts than a 100% virgin plastic tray for each assessed impact category. The black dashed line represents the physical limitation
of filler content (30 vol%) in the composite to ensure the functional unit. When bars reached a filler content of 100%, no benefit can be realized by the addition of filler
chemical industry, which explained the low impact value in the ionizing radiation category.
The impact of ViSh transport was low in all the categories because it was assumed that the production of trays took place in the same region (Languedoc-Roussillon) as the generation of ViSh, allowing for short transportation distances.
Air drying only exhibited environmental burdens in one impact category, since it only required space to spread the vine shoots on the ground without the help of machinery. Thus, impacts from this step only appeared in the category land use, representing 56% of the land use from ViSh production.
3.3.2 Polymer/ViSh (30 vol%) composite tray production: contribution of each step on the environmental impact The analysis of the biocomposite burden clearly showed the strong contribution of the components of the composite and especially the matrix (Fig.10). The contributions of PLA are not shown in Fig.10to increase clarity and because the results were very similar to those of PHBV composites.
For PHBV-based composites, the production of the poly-mer matrix was the largest contributor, 15 midpoint impact categories, ahead of the end of life (freshwater and marine 0% 20% 40% 60% 80% 100%
Tray PHBV/ViSh Tray PLA/ViSh Tray PP/ViSh Tray PP
Fig. 7 Environmental impact of composite trays filled with 30 vol% of ViSh fillers (all impact categories)
0 0.05 0.1 0.15
Tray PHBV/ViSh Tray PLA/ViSh Tray PP/ViSh
EoL Use Injection Extrusion Fillers Matrix
-19.6%
-19.9%
-8.5%
Gl o b a l wa rm in g (k g C O2 eq)Fig. 8 Global warming impact of trays with 30 vol% filler. The percentages above the bars indicate the reduction of the impact compared with trays without ViSh filler
ecotoxicity) and the injection molding (ionizing radiation), in that order. The main contributions to the environmental bur-den in the production of PHBV are the large requirement for energy, in particular steam, and the use of sugar from sugar cane. In the case of PP-based composites, results were more balanced with 9 categories dominated by production of the matrix, 4 by injection molding or end of life, and 1 by compounding (water consumption). When comparing global warming potential, the production of the polymer matrix caused the largest contribution to environmental impact for the composite trays. The global warming impacts associated with polymer production outweighed those from the filler, manufacturing or end of life. The high contribution of the
end of life step in the categories freshwater and marine ecotoxicity was mainly due to the landfilling.
As expected, ionizing radiation impacts were mainly due the manufacturing steps: injection molding and compounding. These processes required electricity. In the case of PHBV composite, land use impact was largely explained by the need of sugar cane that is used as carbon source for the production of the matrix.
3.4 Economic vs environmental balance analysis
The price of the different trays was estimated from data given by industry (Table4). From an economic point of view, the
PHBV PP 0% 20% 40% 60% 80% 100% EoL Use Injection molding Compounding Filler Matrix
Fig. 10 Contribution for PHBV and PP-ViSh (30 vol%) composites
0% 20% 40% 60% 80% 100% Big bag Impact milling Cutting milling Final drying Coarse milling Air drying Transport
Fig. 9 Contribution for ViSh filler production
incorporation of 30 vol% of fillers reduced the price of a PHBV tray by 25.4%, and to a lesser extent in the case of PP (12.0%) because the price of raw PP is much lower than PHBV (Table4). It is interesting to note that the injection molding accounted for a large share of the price, ranging from 12% for 100% PHBV trays to 50% for PP-based composite trays. On the contrary, in the case of composite materials, the additional price of compounding was almost negligible. This resulted in a factory price of final trays that was not only driven by the price of raw materials. Thus, the addition of ViSh in trays reduced the final price but not as much as ex-pected according to the price of raw materials. There are two reasons for this: the price of injection molding, which was constant, and the density of ViSh was higher than for the plastics.
4 Conclusion
This study assessed the environmental impacts of com-posite trays made of PP, PLA, or PHBV, and increasing content of ViSh particle filler, based on a comparative life cycle assessment (LCA). It was shown that bioplastic matrices, i.e., PLA and PHBV, which are considered to be eco-friendly, displayed higher environ-mental impacts than fossil-based polypropylene. This re-sult should be tempered by the fact that long-term im-pacts such as plastic accumulation are not considered and that the production of bioplastics is still at a much lower level of technological development. In the case of PHBV, the only truly biodegradable bioplastic among the three studied, it is expected that production process-es will be optimized, in such a way to decrease their environmental impacts. It is therefore difficult to draw a general conclusion about the environmental efficiency of bioplastics compared with conventional plastics due to the expected evolution of the bioplastic technologies. As described by Yates and Barlow in a critical review on biopolymers (Yates and Barlow 2013), it is complex to compare their environmental impacts with other studies for different reasons: updated eco-profiles, feedstocks used, sources of energy, etc. There is currently no factor
that quantifies the effect of plastic debris on biodiversity (Woods et al. 2016). The biodegradability of PHBV can thus not be assessed in the LCA framework. However, there is ongoing research on this issue (for example, the Marilca initiative supported by the Life Cycle Initiative of the UN Environment (Boulay et al. 2019)). One can only wonder how the conclusions of this work will change when such data become available. The interest of a biodegradable material, compared with a non-biodegradable material that is recyclable may seem low from a short-term life cycle analysis point of view. But, this perspective neglects the fate of the recycled mate-rial which, after a few cycles, will eventually be re-leased into the environment, as the recycling of plastic, whether closed short loop or long loop, is limited in time.
The incorporation of increasing contents of ViSh particles in plastic trays resulted in a reduction of environmental im-pacts despite the additional processing steps required to pro-duce ViSh fillers and the higher density of ViSh compared with the three polymer matrices under consideration. Trays with a higher filler content are therefore heavier requiring that more matter be processed. Despite that fact, this study illus-trated the interest of using agro-residues in composites. Concerning global warming, composite trays had less impact than virgin plastic trays from 5 vol% for PHBV or PLA and from 20 vol% for PP. Regarding PHBV, the only biodegrad-able polymer in natural conditions in this study, the price and the impact on global warming are reduced by 25% and 20% respectively when 30 vol% of ViSh are added. Should the maximum filler content of 30 vol% be increased, there would be even greater potential to reduce the environmental impacts. Thus, it can be concluded that, if the goal is environmental sustainability while avoiding microplastic accumulation, the majority research efforts should be devoted to the optimiza-tion and scale up of bioplastic producoptimiza-tion, PP producoptimiza-tion be-ing already optimized. The use of cleaner energy would also help to achieve this goal while additionally reducing the im-pact of the injection molding step. Finally, the end of life should be also improved by increasing recycling for PP, en-suring separate collection for composting of PLA, and home composting for PHBV.
Table 4 Price of the studied composite trays. ViSh is 0.30 €/kg (Vitis Valorem, ADEME), the compounding is 0.04€/kg (CT-IPC), and the injection molding is 0.03€/p (Fürstplast)
Price
(€/t) Price 100% plastictray (€/100p) Price 30 vol% ViSh fillertray (€/100p) Reduction of the price due to30 vol% of ViSh filler (%) PHBV 7750a 26.95 20.11 − 25.4
PLA 2800b 11.73 9.46 − 19.4 PP 1240c 6.94 6.10 − 12.0
aNaturePlast, grade PHI 002, 2019 b
NaturePlast, grade PLI 003, 2019
c
Acknowledgments The authors would like to acknowledge the research group ELSA in Montpellier for providing SimaPro software.
Funding This work was carried out in the framework of the NoAW project, which is supported by the European Commission through the Horizon 2020 research and innovation program under the Grant Agreement No. 688338.
Open Access This article is licensed under a Creative Commons Attribution 4.0 International License, which permits use, sharing, adaptation, distribution and reproduction in any medium or format, as long as you give appropriate credit to the original author(s) and the source, provide a link to the Creative Commons licence, and indicate if changes were made. The images or other third party material in this article are included in the article's Creative Commons licence, unless indicated otherwise in a credit line to the material. If material is not included in the article's Creative Commons licence and your intended use is not permitted by statutory regulation or exceeds the permitted use, you will need to obtain permission directly from the copyright holder. To view a copy of this licence, visithttp://creativecommons.org/licenses/by/4.0/.
References
ADEME (2018) Déchets chiffres-clés-L’essentiel 2018
Ahankari SS, Mohanty AK, Misra M (2011) Mechanical behaviour of agro-residue reinforced poly(3- hydroxybutyrate-co-3-hydroxyvalerate), (PHBV) green composites: a comparison with traditional polypropylene composites. Compos Sci Technol 71: 653–657.https://doi.org/10.1016/j.compscitech.2011.01.007 Beigbeder J, Soccalingame L, Perrin D, Bénézet JC, Bergeret A (2019)
How to manage biocomposites wastes end of life? A life cycle assessment approach (LCA) focused on polypropylene (PP)/wood flour and polylactic acid (PLA)/flax fibres biocomposites. Waste Manag 83:184–193.https://doi.org/10.1016/j.wasman.2018.11.012 Berthet MA, Angellier-Coussy H, Chea V, Guillard V, Gastaldi E, Gontard N (2015a) Sustainable food packaging: valorising wheat straw fibres for tuning PHBV-based composites properties. Compos Part A Appl Sci Manuf 72:139–147.https://doi.org/10. 1016/j.compositesa.2015.02.006
Berthet MA, Angellier-Coussy H, Machado D, Hilliou L, Staebler A, Vicente A, Gontard N (2015b) Exploring the potentialities of using lignocellulosic fibres derived from three food by-products as con-stituents of biocomposites for food packaging. Ind Crop Prod 69: 110–122.https://doi.org/10.1016/j.indcrop.2015.01.028
Boland C (2014) Life cycle energy and greenhouse gas emissions of natural fiber composites for automotive applications: impacts of renewable material content and lightweighting By
Borken-Kleefeld J, Weidema BP (2013) Background data for transport. In: EcoInvent.https://www.ecoinvent.org/files/transport_default_ 20130722.xlsx. Accessed 14 Oct 2019
Boulay A-M, Vazquez I, Verones F, Woods J (2019) Marine impacts in LCA.www.marilca.org. Accessed 14 Oct 2019
Chambre régionale d’agriculture Nouvelle Aquitaine, DRAAF/SRAL Nouvelle-Aquitaine (2017) Guide de l’observateur : La vigne Chodak I (2008) Polyhydroxyalkanoates: origin, properties and
applica-tions. In: Monomers, polymers and composites from renewable re-sources. pp 451–477
Civancik-Uslu D, Ferrer L, Puig R, Fullana-i-Palmer P (2018) Are func-tional fillers improving environmental behavior of plastics? A re-view on LCA studies. Sci Total Environ 626:927–940.https://doi. org/10.1016/j.scitotenv.2018.01.149
CT-IPC (2019) Centre Technique Industriel de la Plasturgie et des Composites.https://ct-ipc.com/. Accessed 14 Oct 2019
David G, Gontard N, Angellier-Coussy H (2019) Assessing the potential of vine shoots particles as fillers in biopolyester based biocomposites. In: Eurofiller polymer blends conference. Palermo David G, Michel J, Gastaldi E, Gontard N, Angellier-Coussy H (2020a)
How vine shoots as fillers impact the biodegradation of PHBV-based composites. Int J Mol Sci 21.https://doi.org/10.3390/ ijms21010228
David G, Vannini M, Sisti L, Marchese P, Celli A, Gontard N, Angellier-Coussy H (2020b) Eco-conversion of two winery lignocellulosic wastes into fillers for biocomposites: vine shoots and wine pomace. Polymers (Basel) 12
David G, Heux L, Pradeau S, et al (2020c) Upcycling of vine shoots: production of fillers for PHBV-based biocomposites applications. J Polym Environ.https://doi.org/10.1007/s10924-020-01884-8 Duflou JR, Deng Y, Van Acker K, Dewulf W (2012) Do fiber-reinforced
polymer composites provide environmentally benign alternatives? A life-cycle-assessment-based study. 37:374–382.https://doi.org/ 10.1557/mrs.2012.33
EcoBioCAP 265669 (2013) Deliverable D5.1 Environmental assessment of different packaging materials
FranceAgriMer (2016) L’observatoire national des ressources en biomasse: Évaluation des ressources disponibles en France Galanakis CM (2017) Handbook of grape processing by-products,
Elsevier
Gateau A (2019) SD-Tech. https://groupe.sd-tech.com/. Accessed 14 Oct 2019
Gazeau G, Sibe V, Mouton R, Remy J (2018) Etude sur les options de valorisation matière (valorisation sous forme d’éco-matériaux) ou énergie des résidus de culture
Geyer R, Jambeck JR, Law KL (2017) Production, use, and fate of all plastics ever made. Sci Adv 3:25–29.https://doi.org/10.1126/ sciadv.1700782
Girones J, Vo LTT, Di Giuseppe E, Navard P (2017) Natural filler-reinforced composites: comparison of reinforcing potential among technical fibers, stem fragments and industrial by-products. Cellul Chem Technol 51:839–855
Grangeot S (2019) Vitis valorem.https://www.vitis-valorem.com/. Accessed 14 Oct 2019
Guillard V, Gaucel S, Fornaciari C, Angellier-Coussy H, Buche P, Gontard N (2018) The next generation of sustainable food packag-ing to preserve our environment in a circular economy context. Front Nutr 5:1–13.https://doi.org/10.3389/fnut.2018.00121 Gullón P, Gullón B, Dávila I, Labidi J, Gonzalez-Garcia S (2018)
Comparative environmental life cycle assessment of integral reval-orization of vine shoots from a biorefinery perspective. Sci Total Environ 624:225–240.https://doi.org/10.1016/j.scitotenv.2017.12. 036
Gurunathan T, Mohanty S, Nayak SK (2015) A review of the recent developments in biocomposites based on natural fibres and their application perspectives. Compos Part A Appl Sci Manuf 77:1–25. https://doi.org/10.1016/j.compositesa.2015.06.007
Harding KG, Dennis JS, Von Blottnitz H, Harrison STL (2007) Environmental analysis of plastic production processes: comparing petroleum-based polypropylene and polyethylene with biologically-based poly-β-hydroxybutyric acid using life cycle analysis. J Biotechnol 130:57–66. https://doi.org/10.1016/j.jbiotec.2007.02. 012
Hauschild M, Rosenbaum RK, Olsen S (2018) Life cycle assessment: theory and practice, 1st edn. Springer International Publishing Hermann BG, Debeer L, De Wilde B et al (2011) To compost or not to
compost: carbon and energy footprints of biodegradable materials’ waste treatment. Polym Degrad Stab 96:1159–1171.https://doi.org/ 10.1016/j.polymdegradstab.2010.12.026
Hreblay J (2019) Fürstplast.https://www.fuerstgroup.eu/fr/
IFN, FCBA, Solagro (2009) Biomasse forestière, populicole et bocagère disponible pour l’énergie à l’horizon 2020
Joshi SV, Drzal LT, Mohanty AK, Arora S (2004) Are natural fiber composites environmentally superior to glass fiber reinforced com-posites? Compos Part A 35:371–376.https://doi.org/10.1016/j. compositesa.2003.09.016
Keller M (2015) Water relations and nutrient uptake. In: Keller M (ed) The science of grapevines, 2nd edn. Academic Press, San Diego, pp 101–124
Kilinc AC, Atagur M, Ozdemir O et al (2016) Manufacturing and char-acterization of vine stem reinforced high density polyethylene com-posites. Compos Part B Eng 91:267–274.https://doi.org/10.1016/j. compositesb.2016.01.033
Kim S, Dale BE, Drzal LT, Misra M (2008) Life cycle assessment of kenaf fiber reinforced biocomposite. J Biobased Mater Bioenergy 2: 85–93.https://doi.org/10.1166/jbmb.2008.207
Labouze E, Le Guern Y (2007) Analyse du Cycle de Vie d’emballages en plastique de différentes origines-Rapport final
Lammi S, Le Moigne N, Djenane D et al (2018) Dry fractionation of olive pomace for the development of food packaging biocomposites. Ind Crop Prod 120:250–261.https://doi.org/10.1016/j.indcrop.2018.04. 052
Le Duigou A, Davies P, Baley C (2011) Replacement of glass/ unsaturated polyester composites by Flax/PLLA biocomposites: is it justified? J Biobased Mater Bioenergy 5:466–482.https://doi.org/ 10.1166/jbmb.2011.1178
Lee WS, Chua ASM, Yeoh HK, Ngoh GC (2014) A review of the pro-duction and applications of waste-derived volatile fatty acids. Chem Eng J 235:83–99
Max B, Salgado JM, Cortes S, Dominguez JM (2010) Extraction of phenolic acids by alkaline hydrolysis from the solid residue obtained after prehydrolysis of trimming vine shoots. J Agric Food Chem 58: 1909–1917.https://doi.org/10.1021/jf903441d
Mayer-Laigle C, Rajaonarivony R, Blanc N, Rouau X (2018) Comminution of dry lignocellulosic biomass: part II. technologies, improvement of milling performances, and security issues. B i o e n g i n e e r i n g 5 : 5 0 . h t t p s : / / d o i . o r g / 1 0 . 3 3 9 0 / bioengineering5030050
Ministère de l’écologie et du développement durable (2011) Circulaire du 18 novembre 2011 relative à l’interdiction du brûlage à l’air libre des déchets verts
Mohanty AK, Misra M, Drzal LT (2001) Surface modifications of natural fibers and performance of the resulting biocomposites: an overview. Compos Interfaces 8:313–343. https://doi.org/10.1163/ 156855401753255422
Mohanty AK, Misra M, Drzal LT (2005) Natural fibers, biopolymers, and biocomposites. Taylor & Francis
Picchi G, Silvestri S, Cristoforetti A (2013) Vineyard residues as a fuel for domestic boilers in Trento Province (Italy): comparison to wood chips and means of polluting emissions control. Fuel 113:43–49. https://doi.org/10.1016/j.fuel.2013.05.058
PlasticsEurope (2018) Plastics–the facts 2018 PRé Sustainability (2018) SimaPro:8.5
Qiang T, Yu D, Zhang A, Gao H, Li Z, Liu Z, Chen W, Han Z (2014) Life cycle assessment on polylactide-based wood plastic composites toughened with polyhydroxyalkanoates. J Clean Prod 66:139–145. https://doi.org/10.1016/j.jclepro.2013.11.074
Royer SJ, Ferrón S, Wilson ST, Karl DM (2018) Production of methane and ethylene from plastic in the environment. PLoS One 13:1–13. https://doi.org/10.1371/journal.pone.0200574
Sanchez A, Ysunza F, Neltran-Garcia M, Esqueda M (2002) Biodegradation of viticulture wastes by pleurotus: a source of mi-crobial and human food and its potential use in animal feeding. J Agric Food Chem 50:2537–2542. https://doi.org/10.1021/ jf011308s
Scarlat N, Dallemand J-F, Monforti-Ferrario F, Nita V (2015) The role of biomass and bioenergy in a future bioeconomy: policies and facts. Environ Dev 15:3–34.https://doi.org/10.1016/J.ENVDEV.2015.03. 006
Spinelli R, Nati C, Pari L, Mescalchin E, Magagnotti N (2012) Production and quality of biomass fuels from mechanized collection and processing of vineyard pruning residues. Appl Energy 89:374– 379.https://doi.org/10.1016/j.apenergy.2011.07.049
Tabone M, Cregg J, Beckman E, Landis A (2010) Sustainability metrics: life cycle assessment and green design in polymers. Environ Sci Technol 44:8264–8269
Vidal R, Martínez P, Garraín D (2009) Life cycle assessment of compos-ite materials made of recycled thermoplastics combined with rice husks and cotton linters. Int J Life Cycle Assess 14:73–82.https:// doi.org/10.1007/s11367-008-0043-7
Wernet G, Bauer C, Steubing B, Reinhard J, Moreno-Ruiz E, Weidema B (2016) The ecoinvent database version 3 (part I): overview and methodology. Int J Life Cycle Assess 21:1218–1230.https://doi. org/10.1007/s11367-016-1087-8
Woods JS, Veltman K, Huijbregts MAJ, Verones F, Hertwich EG (2016) Towards a meaningful assessment of marine ecological impacts in life cycle assessment ( LCA ). Environ Int 89–90:48–61.https://doi. org/10.1016/j.envint.2015.12.033
Xu X, Jayaraman K, Morin C, Pecqueux N (2008) Life cycle assessment of wood-fibre-reinforced polypropylene composites. J Mater Process Technol 8:168–177.https://doi.org/10.1016/j.jmatprotec. 2007.06.087
Yates MR, Barlow CY (2013) Life cycle assessments of biodegradable, commercial biopolymers—a critical review. Resour Conserv Recycl 78:54–66.https://doi.org/10.1016/j.resconrec.2013.06.010 Publisher’s note Springer Nature remains neutral with regard to jurisdic-tional claims in published maps and institujurisdic-tional affiliations.