HAL Id: hal-01286681
https://hal.archives-ouvertes.fr/hal-01286681
Submitted on 11 Mar 2016
HAL is a multi-disciplinary open access archive for the deposit and dissemination of sci-entific research documents, whether they are pub-lished or not. The documents may come from teaching and research institutions in France or abroad, or from public or private research centers.
L’archive ouverte pluridisciplinaire HAL, est destinée au dépôt et à la diffusion de documents scientifiques de niveau recherche, publiés ou non, émanant des établissements d’enseignement et de recherche français ou étrangers, des laboratoires publics ou privés.
Benhu, D. Pezzaniti
To cite this version:
R. Koech, A. Pires de Camargo, B. Molle, E. Saretta, J.A. Frizzone, et al.. Intercomparison testing and evaluation of sprinklers within the INITL. Journal of Irrigation and Drainage Engineering, Amer-ican Society of Civil Engineers, 2016, 142 (2), pp.04015048-1-04015048-8. �10.1061/(ASCE)IR.1943-4774.0000937�. �hal-01286681�
Intercomparison testing and evaluation of sprinklers within the INITL
Richard Koech1,*, Antonio Pires de Camargo2, Bruno Molle3, Ezequiel Saretta4, Jose Antonio Frizzone5 , Gao Benhu6and David Pezzaniti71
School of Environmental and Rural Science, University of New England, Armidale NSW 2351, Australia.
2
National Institute of Science and Technology in Irrigation Engineering, Piracicaba-SP, Brazil.
3
National Research Institute of Science and Technology for Environment and Agriculture, Montpellier, France.
4
National Institute of Science and Technology in Irrigation Engineering, Piracicaba-SP, Brazil.
5
National Institute of Science and Technology in Irrigation Engineering, Piracicaba-SP, Brazil.
6
China Institute of Water Resources and Hydropower Research
7
Australian Irrigation and Hydraulics Technology Centre, University of South Australia, P.O Box 2471, Adelaide, Australia.
*Corresponding author; Email: [email protected]; Phone: +61 2 6773 5221; Fax: +61 6773 2769.
Abstract
The International Network of Irrigation Testing Laboratories (INITL) undertook a sprinkler intercomparison testing exercise to generate data for an objective comparison of the performances of the different facilities and identify opportunities for further improvements. Three impact sprinklers were tested in four laboratories in accordance with the standard ISO 15886-3. The plots of flow rate-pressure profiles were found to be consistent, and correlated to those obtained from previous studies. Although there were slight variations in the measured flow rate data, the mean flow rates at each pressure level were the same for the three sprinklers and the shapes of the radial distribution profiles
were similar. The deviations of reconstituted flow rates (from the measured) of at least two tests in each facility were found to exceed the limit recommended by ISO 15886-3. The sprinkler software developed by INITL was found to have a good correlation with the commercial software SPACE PROTM.
Keywords: Intercomparison, sprinkler, radial distribution
Introduction
The INITL, initiated in 2000, is a network of 18 laboratories spread out in 17 countries which are involved in testing of irrigation-related equipment. Some of these facilities are affiliated to educational institutions, and hence integrate academic research with testing for commercial purposes. Some of the facilities are recognised internationally through their accreditation to the ISO/IEC 17025 (2005), an international standard which certifies that the facility meets the general requirements for competence of testing and calibration. Apart from the international accreditation, the facilities are also accredited by their national accreditation authorities. For instance, in Australia and Brazil, the corresponding accreditation bodies are the National Association of Testing Australia (NATA) and the General Coordination for Accreditation of the National Institute of Metrology, Quality and Technology (Cgcre).
The motivation behind the creation of the INITL was to develop a framework by which facilities involved in irrigation and related testing could objectively engage with each other in a reciprocal manner. So far, the most popular form of engagement has been to participate in joint intercomparison testing, whereby the same products are tested in various laboratories and the results are compared. This creates an opportunity for testing facilities, including those that are geographically isolated, to gauge their performance against their peers, and identify strategies for their improvement. The INITL’s philosophy is very similar to the intercomparison exercises that exist in many domains, or proficiency testing as they are often called. In Australia and Brazil for example, the NATA and Cgcre
respectively require that facilities participate in proficiency testing to maintain their accreditation or when seeking extensions of accreditations.
Additionally, since the procedures and guidelines used by these facilities are based on the same international standards, some form of engagement contributes towards more coordinated periodical reviews of these standards. The network, through the intercomparison activity, contributed to the latest modifications of the ISO 15886-3 and ISO 9261 standards. The INITL is the only organisation involved in international intercomparison exercises in metrology applied to irrigation equipment performance evaluation. Examples of published intercomparison exercises in other fields of metrology include the intercomparison of high pressure test facilities undertaken by ten of the major European companies (Tedeschi et al. (2002).
The first intercomparison exercise initiated by the INITL, involving successively drippers and sprinklers, was undertaken between 2003 and 2007. The sprinkler and dripper results were respectively presented at the ISO/TC 23/SC 18 meetings held in Anaheim, United States, in 2008 (No. 884) and in Mexico in 2009 (No. 924). The second exercise occurred in 2013-2014, and the results of the dripper tests are documented in Koech et al. (unpublished) while the results of the sprinkler tests are presented in this paper.
Soon after the commencement of intercomparison testing more than a decade ago, the INITL members recognised the need for a central internet-based platform to harmonise the processing of results and test reports. Hence a web-based, open-source software, that allows harmonised processing of sprinkler results and reports was developed, and is presented in this paper. The software is internet-based, and can be used by irrigation practitioners free of charge for research and other purposes. A similar irrigation software that was freely available a decade ago is Catch3D (Merkley 2004); however, it is no longer available and appears not to have been updated to enable it run using the current versions of computational operating systems.
The specific objective of this paper is therefore to present the results of the intercomparison testing of sprinklers within the INITL undertaken in 2013-2014, and describe the software developed for
processing and harmonising results. The test results and the software are evaluated and aspects of sprinkler testing requiring further research identified.
Overview of sprinkler testing and evaluation
Typically, field evaluations of sprinkler performance are undertaken by laying catch-cans around a selected number of sprinklers, or full grid (rectangular or square) arrangement. The sprinkler is located at the centre of the grid and the distortion caused by wind or sprinkler’s asymmetric coverage pattern can easily be detected. On the other hand, for research or developmental work in which more precise measurements are required, the characterisation of water distribution is often undertaken indoors because it is relatively easier to attain no-wind conditions. Depending on the wetted radius, full grid catch arrangement may also be used in laboratory testing, but more often catch-cans are arranged along one or more radial distance of a single sprinkler, technically referred to as single leg test (Svubure et al. 2010). The single radial grid catch-can arrangement is widely used because of constraints of space in many laboratories. This arrangement is mostly applied when a symmetrical watering pattern is expected and in no-wind conditions (ISO 15886-3, 2012).
The design and size of the sprinkler, number and configurations of nozzles, and the operating pressure are the key factors determining its water distribution profile (Tarjuelo et al. 1999). Ideally, the water distribution patterns of a sprinkler of the same model and size operating under the same conditions would be expected to be the same. However, it has been demonstrated that they vary in some cases, mainly because of manufacturing inaccuracies (Bean 1965). Measurement uncertainties, which are related to procedures and equipment used for testing, may also cause disparities in the data. Normally, a sprinkler with a full rotation should have a circular wetting pattern. However, if factors such as manufacturing imperfections cause the impact-type sprinkler to have a variable rotational speed, an asymmetric coverage pattern may be expected (Christiansen, 1942). An asymmetric coverage pattern may also be caused by the sprinkler riser not being perfectly vertical.
In both the full and the radial grid arrangement, the sprinkler performance is determined by measuring the quantities of water collected in the catch-cans. Traditionally, these measurements have been carried out manually; however automatic evaluation procedures have been proposed (for instance Seginer et al. 1992), but there is no evidence of their widespread adoption. Semi-empirical models used for the spatial distribution of water application under centre pivot sprinklers have been developed (Molle and Gat, 2000).
The international standard used by the majority of INITL members for evaluation of sprinkler systems is ISO 15886-3 (2012). This standard specifies the conditions and procedures for testing and characterising the water distribution pattern of sprinklers specifically used for irrigation purposes. The ISO standard specifies that test duration must comply with uncertainty requirements and the sprinkler jet must pass over the catch-cans at least 30 times. The measurement of the amount of water collected may be done by mass, volume or level, ensuring that uncertainty in measuring water depths does not exceed 3%. The number of catch-cans installed along a radius depends on the sprinkler jet length. If the jet length is longer than 4 m, at least 10 catch-cans must be installed.
Sprinkler test results may be presented in a variety of ways. One common example is a chart of the radial water distribution, which is a plot of the application rate (mm/h) observed along the jet length. By adding to this chart a horizontal line representing the average application rate, areas receiving more or less water than the average can be easily identified. The use of charts representing the volume of water collected along the jet radius is another option of presenting the results. As per ISO 15886-3 (2012), the effective radius of throw is generally defined as the distance between the sprinkler and the point where the application rate is 0.25 mm/hr (sprinklers of flow rate > 75 L/h) or 0.13 mm/hr (sprinklers of flow rate < 75 L/h). Sprinkler performance may also be characterised by plots of operating pressure versus flow rate.
The ISO 15886 – 3 (2012) outlines a method and criteria for validating test results based on a comparison between the measured and the reconstituted flow rate of the sprinkler. The reconstituted flow rate (Qre) is determined as follows:
=∑ (1) where is the depth measured at radius , is the catch-can spacing and t is the test duration. The
standard requires that for the results to be validated, the reconstituted flow rate shall not deviate by more than 5% from the measured flow rate for sprinkler rated at 507.6 L/h or higher and 7% for flow rates less than 507.6 L/h).
The distribution uniformity of water in a sprinkler system can be simulated using computer packages such as SPACE PROTM (Oliphant 2003) based on the water application profile of a single sprinkler and the corresponding arrangement of sprinklers in the irrigated area. This is undertaken by overlapping the data and calculating uniformity using the following methods: Christiansen uniformity coefficient (CUC); Statistical coefficient of uniformity (SCU); Distribution uniformity (DU); and scheduling coefficient (SC). CUC is commonly used as a uniformity measure in agricultural and turf irrigation (Zhang et al. 2013) and may be expressed as:
= 100 1 −∑ |∑ |! (2)
where Vi is the volume measured in an individual catch-can and " is the mean applied volume.
An example of a mathematical model proposed for the assessment of whole-field uniformity of a sprinkler system is described in Zhang et al. (2013). The software can simulate the hydraulics and overlapping of sprinklers, using variables such as field size, shape and topography.
Materials and Methods
Intercomparison testing
Table 1 provides a list and brief description of the laboratories that participated in the 2013-2014 sprinkler intercomparison tests. The cross tests were undertaken using three overhead, metallic,
impact sprinklers, NaanDanJain Model 2341 with two nozzles: 5 and 3.2 mm diameter, hereafter referred to as Sprinklers A, B and C. The same three sprinklers were successively tested in all the participating laboratories (in France, Brazil, China and Australia) in accordance with ISO 15886 – 3 (2012) - Agricultural irrigation equipment – sprinklers – Part 3: Characterisation of distribution and test methods. The manufacturer’s technical specifications for this sprinkler model are detailed in NAANDANJAIN Irrigation (2013). This document specifies that the expected flow rates of this sprinkler model at operating pressure of 300, 400 and 500 kPa are 2.210, 2.530 and 2.840 m3/h respectively.
Table 1 List of INITL members that participated in the sprinkler testing
Laboratory Description
AIHTC
Adelaide, Australia
The Australian Irrigation and Hydraulics Technology Centre (AIHTC) is based at the University of South Australia, Adelaide and the primary focus includes testing of irrigation and hydraulic equipment. The facility is accredited to the NATA in the field of meteorology and complies with the requirements of ISO/IEC 17025 (2005). The facility has been appointed by the Australian Commonwealth’s National Measurement Institute (NMI) as an approving and verification authority for water meters.
IWHR
Beijing, China
The China Institute of Water Resources and Hydropower Research (IWHR) is based in Beijing, China and conducts hydraulic tests among other tests. The main functions of the facility are: (i) certification of irrigation equipment and other devices to local, national and international standards; (ii) laboratory and in situ tests of irrigation equipment; (iii) formulation of test procedures and revision of local and national standards; and (iv) training and research.
The irrigation testing laboratory is located in the National Institute of Science and
1
The mention of the sprinkler model is for the purpose of clarity only, and does not imply recommendation, endorsement or otherwise on the part of the authors.
INCT-EI/ESALQ/USP
Piracicaba, Brazil
Technology in Irrigation Engineering (INCT-EI), Luiz de Queiroz College of Agriculture (ESALQ/USP), Piracicaba, Brazil. The laboratory has been undertaking accredited irrigation tests since 2010, as well as applied research in irrigation. The laboratory is accredited to the Cgcre /Inmetro and complies with the requirements of ISO/IEC 17025 (2005).
IRSTEA
Aix en Province, France
The National Institute of Science and Technology for Environment and Agriculture (IRSTEA) is located in Aix en Province, France, and undertakes tests and research on irrigation equipment and practices, including sprinkler systems, drip systems, fluid mechanics and hydraulic modelling. A recent research outcome which is subject to a patent approval is the design of an emitter that is resistant to most of the forms of clogging. Regarding drip irrigation, the laboratory tests the hydraulic characteristics of drippers and their manufacturing variability. The facility’s quality system complies with the requirements of ISO/IEC 17025 (2005), certified by external body.
The ISO 15886 – 3 (2012) provides that sprinkler evaluations can be conducted indoors or outdoors. However, as the objective of the tests was to obtain precise water distribution data (flow rate-pressure curves and water distribution patterns) for comparison, all the tests were performed in indoor facilities. Previous research (Stambouli et. al. 2014) has shown that no-wind conditions, as is expected in indoor facilities, are necessary in order to obtain reliable data.
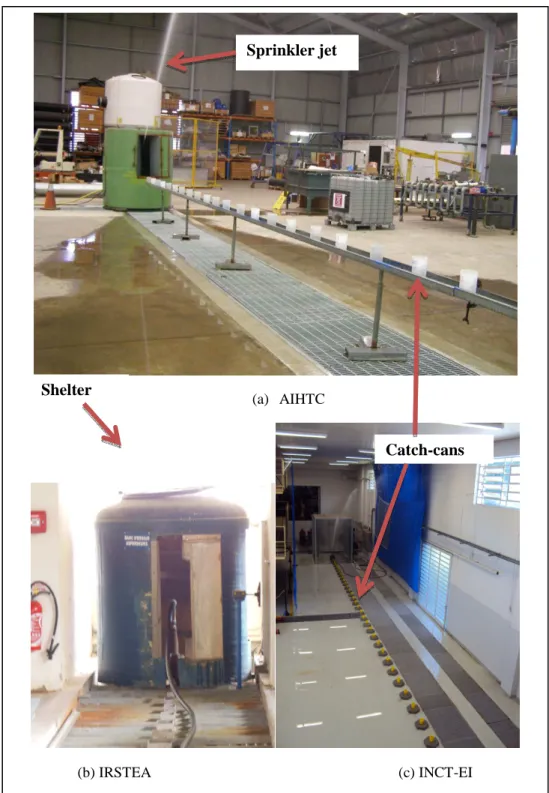
All the participating laboratories undertook single-leg tests which involved mounting one sprinkler head at time on a sprinkler riser typically 1 m long and supported by a tripod. Water was delivered to the sprinkler head through the other end of the sprinkler riser. To measure the operating pressure, a pressure tapping point was made in the riser pipe just below the sprinkler head, and a pressure gauge connected. In some laboratories, to restrict sideways spread of water, the sprinkler system was enclosed in a shelter (Fig. 1).
Fig. 1 Sprinkler test setup
Catch-cans to measure the radial distribution of water were arranged along one radius, spaced at 0.5 m; up to 18 catch-cans were required. The vertical distance between the main nozzle of the sprinkler
(a) AIHTC
(b) IRSTEA (c) INCT-EI
Catch-cans Sprinkler jet
and the surface of the catch-cans was maintained at 0.5 m. Control valves were installed in the pipeline to regulate the operating pressure. All tests were preceded by starting the pump and operating the sprinkler system for approximately one hour. This was necessary in order to condition the sprinklers, test all the system components, and expel any air that may have been in the system.
The flow rate-pressure curves were determined using the following pressures: 100, 150, 200, 250, 300, 350, 400, 450, and 500 kPa. The key parameters measured in these tests were the operating pressure and the total flow rate, using respectively a pressure gauge and a flow meter installed in the delivery pipeline. Other measurements recorded were ambient and water temperature and relative humidity. The duration of the test was one hour for each pressure level. It is worth noting that these tests did not involve the use of the catch-cans. The flow rate-pressure data were used in Excel spreadsheet to plot the curves and regression equations were fitted.
The radial water distribution patterns were determined at only 300 and 400 kPa pressures. In this case, the total flow rate was measured and the catch-cans were used to determine the amounts of water collected along the radial length. The amount of water collected in each catch-can was determined by weighing and then converted into volumes using the water density determined by the laboratory. The evaporative loss was estimated by placing a volume of water in one catch-can in the vicinity of the test, and measuring the mass of water at the start and at the end of the test. The evaporative loss was taken as the difference between mass measured before and at the end of the test, and was added to the amount collected in each catch-can. The ambient and water temperature and relative humidity data were also taken for these tests. The test duration was one hour for all the tests. The irrigation intensity was determined as the volume of water in each catch-can divided by the test duration (one hour). The radial distribution of water was determined by plotting the application rate or irrigation intensity against the radial distance from the sprinkler. Eqn. 1 was used to determine the reconstituted flow rate, and hence the validity of the test results. The statistical analysis of the data was undertaken using the software IBM SPSS Version 22.
Software development and use
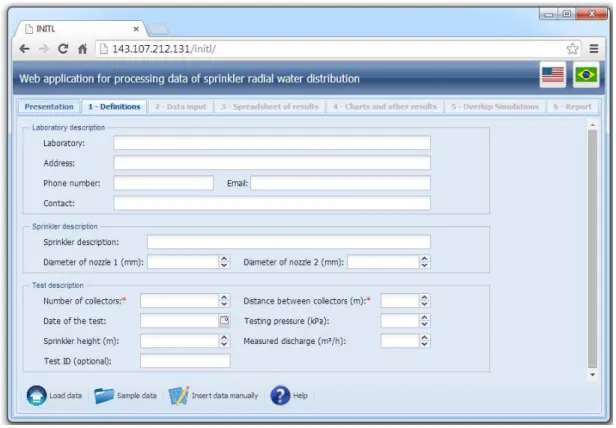
The INITL software was developed using ExtJs 4® framework and JavaScript, and is available online free of charge (http://143.107.212.131/initl/) in two languages, English and Portuguese. The general information of the sprinkler test, which must include the number of catch-cans and their spacings, are recorded as shown in Fig. 2.
Fig. 2 INITL software sprinkler information window
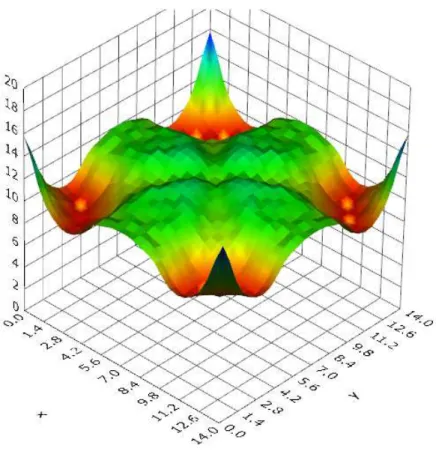
The current version of the software uses radial water distribution data, which can be entered manually or imported from Excel spreadsheet. The software processes the data and presents the following results: charts of water application rate and water volume applied along radius of throw, effective radius of throw, reconstituted flow rate and its deviation from measured flow rate. The application has a tool that simulates the uniformity of sprinklers arranged in rectangular or triangular spacing and determines the corresponding CUC (Eqn. 2). In addition, a three-dimensional rotatable chart illustrating the overlapped water applications corresponding to a given arrangement of lateral lines
and sprinklers is generated (Fig. 3). Finally, all the results are automatically generated by the software in pdf format.
Fig. 3 Chart displaying the overlapped application profiles of four sprinklers arranged in a square (14m by 14 m)
The computational algorithm used to simulate uniformity of water application by overlapping radial distribution data is hereby briefly explained. The general idea consists of the calculation of the amount of water collected by each catch-can, considering the influence of up to 16 sprinklers around the catch-can (Fig. 4). According to the catch-can spacing and arrangement of sprinklers, an array of null values is set. Each position in the array represents a catch-can so that it records the volume of water a catch-can may receive from sprinklers. For each catch-can, the Pythagorean Theorem determines the distance between a catch-can and a sprinkler.
Fig. 4 Schematic of the logic used for estimating the amount of water collected by each catch-can
[Empty circles represent the catch-cans, circles with a cross inside represent the sprinklers, and the dotted lines indicate the sprinklers that may contribute to the amount of water in each catch-can].
Based on that distance, the application rate can be interpolated by a Lagrange polynomial of degree 2 (Eqn. 3):
# = #$ & & %% + #( && %% + # % && % (3)
where: # is the application rate at the distance , which is the distance between the sprinkler and the location where the application intensity may be calculated (target point); $ is the distance between the sprinkler and the catch-can just before the target point; ( is the distance between the sprinkler and the catch-can just after the target point; is the distance between the sprinkler and the second
catch-can after the target point; #$, #( and # are the application intensities corresponding to the catch-cans positioned at the distances $, ( and .
An iteration statement sums the amount of water collected by each catch-can considering that, up to 16 sprinklers may throw water inside that catch-can. If the jet length is shorter than the distance between sprinkler and catch-can, water would not reach the catch-can so that a null value is added to the cumulated value recorded in the considered position of the array. Successive iterations determine the amount of water collected by each catch-can. Finally, the array is filled with values corresponding to the amount of water in each catch-can and the CUC can be calculated.
The software has the ability to simulate sprinkler application uniformities for rectangular and triangular configurations of sprinklers. The sprinkler data collected and used in this study was used to test and validate the software, as is explained later in this paper.
Results and discussion
Intercomparison tests
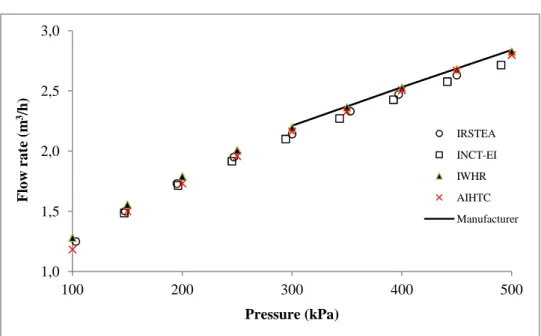
The flow rate-pressure data were plotted in Excel spreadsheets (Figs. 5-7) and the regression analysis undertaken showed that the data fitted the power function (Table 2), with R2 of 0.999 or better in all the results from all the participating laboratories. The value of the exponent was approximately 0.5 in all cases, which is expected for flow characteristics influenced by pressure (Karmeli 1977). The coefficients obtained varied slightly among laboratories, and ranged from 0.1000 to 0.1318.
Figs. 5-7 suggest a high degree of consistency, firstly with the three sets of data (representing each of the three sprinklers) submitted by each laboratory, and when results from all the laboratories are compared. The manufacturer’s curves however were marginally above those measured by the laboratories. However, it is worth noting the manufacturer’s data specified in the product brochure, is based on three pressures (300, 400 and 500 kPa) as opposed to nine pressures used by the testing laboratories. The tests to determine the flow rate-pressure curves did not require the measurement of the radial distribution of water and hence did not involve the use of catch-cans. Generally, there is less
uncertainty in the measurement of flow rates and pressure in full-flow closed conduits and as a result the test data were consistent across all the four laboratories.
Fig. 5 Pressure-flow rate curves for sprinkler A
Fig. 6 Pressure-flow rate curves for sprinkler B
1,0 1,5 2,0 2,5 3,0 100 200 300 400 500 F lo w r a te ( m 3/h ) Pressure (kPa) IRSTEA INCT-EI IWHR AIHTC Manufacturer 1,0 1,5 2,0 2,5 3,0 100 200 300 400 500 F lo w r a te ( m 3/h ) Pressure (kPa) IRSTEA INCT-EI IWHR AIHTC Manufacturer
Fig. 7. Pressure-flow rate curves for sprinkler C
Table 2 Pressure-flow rate sprinkler regression equations
Sprinkler Laboratory
IRSTEA INCT-EI IWHR AIHTC A q = 0.1204P0.5042 q = 0.1232P0.4988 q = 0.1295P0.4952 q = 0.1078P0.5247 B q = 0.1212P0.5038 q = 0.1215P0.5014 q = 0.1318P0.4929 q = 0.1025P0.5335 C q = 0.1202P0.5055 q = 0.1219P0.5010 q = 0.1316P0.4930 q = 0.1000P0.5381
Fig. 8 shows that the shapes of all the radial water distribution profiles measured at the pressures 300 and 400 kPa are statistically similar, and according to Stambouli et al. (2014), roughly correspond to typical profiles of sprinklers operating with two nozzles. However, the intensities obtained by IRSTEA appear to be slightly higher than the rest between 0.5 - 2 m radius. This was most probably due to the effect of the shelter (Fig. 1) as explained later in this paper. The effective radius of throw was approximately 16 and 17 m at the operating pressure of 300 and 400 kPa respectively. As is typical of sprinkler tests, the intensity of water application is highest within the area closest to the sprinkler (about 0-2 m). 1,0 1,5 2,0 2,5 3,0 100 200 300 400 500 F lo w r a te ( m 3/h ) Pressure (kPa) IRSTEA INCT-EI IWHR AIHTC Manufacturer
Fig. 8. Radial distribution of water 0 5 10 15 20 25 30 0 2 4 6 8 10 12 14 16 18 20 Sprinkler A 300 kPa
IRSTEA INCT - EI IWHR AIHTC
0 5 10 15 20 25 30 0 2 4 6 8 10 12 14 16 18 20 Sprinkler A 400 kPa
IRSTEA INCT-EI IWHR AIHTC
0 5 10 15 20 25 30 0 2 4 6 8 10 12 14 16 18 20 Sprinkler B 300 kPa
IRSTEA INCT-EI IWHR AIHTC
0 5 10 15 20 25 30 0 2 4 6 8 10 12 14 16 18 20 Sprinkler B 400 kPa
IRSTEA INCT-EI IWHR AIHTC
0 5 10 15 20 25 30 0 2 4 6 8 10 12 14 16 18 20 Sprinkler C 300 kPa
IRSTEA INCT-EI IWHR AIHTC
0 5 10 15 20 25 30 0 2 4 6 8 10 12 14 16 18 20 Sprinkler C 400 kPa
IRSTEA INCT-EI IWHR AIHTC
R
a
di
a
l
a
pp
li
ca
ti
o
n
ra
te
(
m
m
/h)
Radius (m)
Average application rateThe measured total flow rates and the reconstituted flow rates (calculated using Eqn. 1) for all the tests are shown in Table 3. The mean of measured flow rates for each sprinkler, for all the tests were 2.15 m3/h for the 300 kPa and 2.48 m3/h for the 400 kPa pressures. The flow rates indicated in the manufacturer’s specifications are 2.21 and 2.53 m3/h for the 300 and 400 kPa pressures respectively, translating to a corresponding variation of 2.7 and 2.0 %.
The ISO 15886-3 (2012) requires that the deviation of the reconstituted flow rate from the measured for a sprinkler discharging more than 0.141 L/s (0.51 m3/h) shall not be greater than ±5% for the results to be validated. The sprinklers tested discharged more than 2 m3/h, and hence in Table 3, any test with a deviation of greater than ±5% must be assumed to be invalid. The table shows that at least two results performed in each laboratory could not be validated.
Table 3- Measured and reconstituted flow rate, and the deviation
Laboratory Sprinkler Pressure Measured flow Reconstituted Deviation (kPa) rate (m3/h) flow rate (m3/h) (%)
IRSTEA A 300 2.14 2.34 9.35 B 300 2.14 2.27 6.07 C 300 2.14 2.38 11.2 A 400 2.48 2.48 0.00 B 400 2.48 2.71 9.27 C 400 2.48 2.54 2.42 INCT-EI A 300 2.11 2.19 3.94 B 300 2.10 2.19 4.43 C 300 2.12 2.28 7.89 A 400 2.43 2.61 7.24 B 400 2.43 2.50 2.59 C 400 2.43 2.58 6.38 IWHR A 300 2.18 2.33 6.88
B 300 2.19 2.23 1.83 C 300 2.19 2.31 5.48 A 400 2.51 2.53 0.80 B 400 2.52 2.62 3.97 C 400 2.52 2.59 2.78 AIHTC A 300 2.17 2.12 -2.39 B 300 2.16 2.43 12.50 C 300 2.17 2.39 10.14 A 400 2.50 2.59 3.64 B 400 2.50 2.58 3.04 C 400 2.50 2.62 4.76
The two possible explanations for the results that could not be validated as per the recommendations of the ISO 15886-3 (2012) are the asymmetric coverage pattern of the impact sprinklers and uncertainty in the measurement process. As already explained, asymmetric coverage pattern may be caused by variation in the rotational speed of the sprinkler. However, as per Christiansen (1942), this was expected to have a minimal impact since the sprinklers used for the test were new and the radial water distribution was measured at the manufacturer’s recommended operating pressure. Nonetheless, this poses the question of the adequacy of standard requirements compared to the capacity of laboratories to satisfy it. Further research may be required to ascertain if the threshold deviation of ±5% is too stringent.
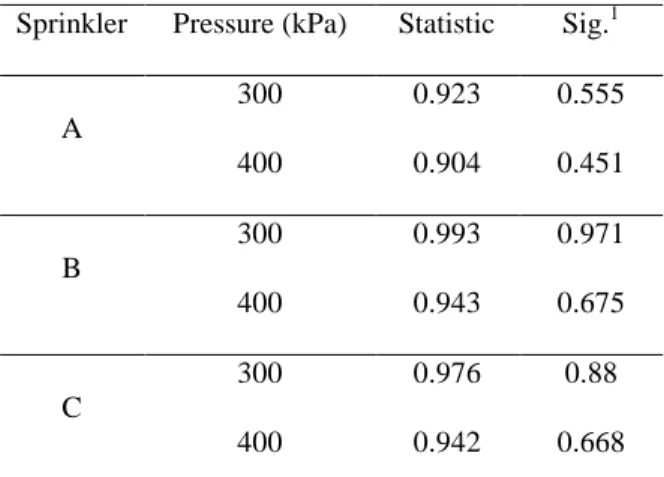
A statistical analysis was undertaken using IBM SPSS Version 22 to assess the normality of the measured flow rates obtained from all the four participating laboratories (Table 3) for the three sprinklers at the two pressures, 300 and 400 kPa. The data are shown to be normally distributed, with a significance of ≥ 0.451 (Table 4). The Shapiro-Wilk’s statistic was used because it is recommended
for small sample sizes (between 3 and 50). The results were expected to follow a normal distribution pattern since the tests were performed using the same sprinklers and under similar conditions.
Table 4- Shapiro-Wilk test for normality of measured flow rates
Sprinkler Pressure (kPa) Statistic Sig.1
A 300 0.923 0.555 400 0.904 0.451 B 300 0.993 0.971 400 0.943 0.675 C 300 0.976 0.88 400 0.942 0.668
¹ Sig. > 0.05 represents a group of data normally distributed
Measurement uncertainty
Uncertainty is a parameter that characterises the dispersion of values caused by random and systematic errors associated with the measurement. Practically, this means that the true value of a measurement is the measured value plus or minus the uncertainty for that measurement. The procedure commonly used by metrological facilities to determine uncertainties in their measurements is described by Bentley (2005).
As mentioned earlier, the uncertainty in the measurement process is a probable reason why some of the results in Table 3 could not be validated in accordance with ISO 15886-3 (2012). This could be as a result of inaccuracies of the equipment used to measure flow rate and pressure (for instance pressure gauge, water meter, stop watch and measuring scale). This intercomparison exercise thus provided the participating laboratories with data necessary to further audit their measurement uncertainties and
Although the general principles for the determination of measurement uncertainty for the sprinkler tests would be similar across all the laboratories that participated in the intercomparison tests, uncertainty budgets relate to the actual test procedures followed and the set of equipment used. Consequently, the uncertainty budgets for the intercomparison tests would be different in each laboratory. These budgets have not been included in this paper, but a brief discussion on uncertainty in measurement is necessary in order to understand the results presented, and especially any disparities noted.
The procedure for determining the reconstituted volume, both the ISO 15886-3 method and the method proposed in this study, comes with some uncertainty. This is because the water collected in each catch-can is assumed to apply equally to the corresponding portion of area in the determination of the reconstituted volume and ultimately flow rate. Another potential source of error is the enclosure (Fig. 1) used around the sprinkler to direct the stream of water from the sprinkler into a smaller area of the laboratory. It is possible that the enclosure may affect air circulation and possibly the droplet size and may intercept some of the jet trajectory. Perhaps more importantly, if the window of the shelter is smaller and restricts part of the stream from exiting, the radial water distribution and hence the reconstituted flow rate will be affected. The shapes of the radial water distribution patterns measured by IRSTEA (Fig. 8) may suggest that the window of the shelter was not large enough to allow the passage of the entire jet or that water was splashing from inside the shelter and reaching the first collectors, hence increase in the catch-can volumes around the sprinkler (0.5 -2 m). This study has identified the effect of the enclosure on the hydraulic characteristics of the sprinkler jet as area that requires further research. IRSTEA laboratory has been correcting this factor using a shelter that is not covered and present a wider opening window.
INITL software test and validation
The radial water distribution profiles, the reconstituted flow rates and their deviations from the measured flow rates generated by the INITL software were compared with those processed using Excel spreadsheet (Fig. 8 and Table 3) and were found to be identical. To further validate the
software, the sprinkler uniformity performance indicators (CUC) obtained were compared with the results simulated using the commercial software SPACE PROTM (Oliphant 2003). This was undertaken using radial distribution profile data collected by IRSTEA and INCT-EI for Sprinkler A at a pressure of 300 kPa, with both rectangular and triangular sprinkler patterns being simulated (Table 5). The distances between sprinkler heads and laterals were kept identical, and ranged from 14 to 24 m. The results are shown in Table 5 to be highly correlated, with the maximum deviation being determined to be 1.3 %. The most likely causes of the slight differences in the results are interpolation algorithm and rounding off errors.
Table 5 - Comparison of the CUC values obtained using the SPACE PROTM and the INITL software
Spacing (m) Christiansen Uniformity Coefficient - CUC (%)
IRSTEA Sprinkler A, 300 kPa INCT-EI Sprinkler A, 300 kPa Rectangular pattern Triangular pattern Rectangular pattern Triangular pattern SPACE PROTM INITL SPACE PROTM INITL SPACE PROTM INITL SPACE PROTM INITL 14 x 14 86 85.4 90 89.7 90 89.7 92 92.1 15 x 15 85 84.6 89 88.8 85 85.2 90 89.7 16 x 16 85 84.6 87 86 84 83.4 87 86.5 17 x 17 86 85.4 84 83.2 83 82.8 83 82.6 18 x 18 87 86 83 82.2 83 83.1 80 79.9 19 x 19 86 84.9 82 81.7 84 83.3 79 78.6 20 x 20 85 84.5 84 83.2 83 82.7 79 78.3 21 x 21 84 83.3 85 84.9 83 83.3 80 79.7 22 x 22 83 82.1 86 85.1 83 82.8 82 82.2 23 x 23 80 79.6 84 83.3 82 81.6 84 84.2 24 x 24 77 75.7 80 79.1 82 81.3 86 85.9
The sprinkler intercomparison tests undertaken by INITL in 2013 to 2014 involved four laboratories in Australia, Brazil, China and France. The flow rate-pressure profiles fitted a power function with R2 of 0.999 or better. The value of the exponent was approximately 0.5, which is consistent with values quoted in literature. It can be concluded that, after some minor adaptations and modifications in the protocol, the four laboratories have consistent and accurate measurement facilities. The radial distribution patterns were similar, while the average flow rates measured at 300 and 400 kPa pressures were 2.15 and 2.48 m3/h respectively, which translated to a variation of 2.7 and 2% from the values quoted in the manufacturer’s specifications. The reconstituted flow rates for at least two tests (at 300 and 400 kPa) in each laboratory could not be validated, most probably due to asymmetric sprinkler coverage pattern, measurement uncertainties and the influence of the sprinkler shelter. The sprinkler simulation software developed by INITL was tested and validated in this study, and the uniformity results were found to be consistent with those obtained using the commercial software SPACE PROTM. The INITL software is available free of charge at http://143.107.212.131/initl/.
References
Bean, A. (1965). “Water distribution by irrigation sprinklers.” Journal of Agricultural Engineering
Research, 10(4), 314-321.
Bentley, R. (2005). Uncertainty in measurement: the ISO guide. National Measurement Institute, Commonwealth of Australia, Canberra.
Christiansen, J. E. (1942). Irrigation by sprinkling. California Agricultural Experimental Station. Bulletin 670. Berkeley: University of California.
ISO 15886 -3 (2012). Agricultural irrigation equipment – sprinklers – part 3 – characterisation and test methods. International Organisation for Standardization, Geneva, Switzerland.
ISO/IEC 17025 (2005) - General requirements for competence of testing and calibration laboratories. International Organisation for Standardization, Geneva, Switzerland.
ISO TC23 SC18 N884 (2008). ISO15886 Sprinklers Evaluation Protocol, Amendment and Draft Report, November 2008, Anaheim, USA.
ISO TC23 SC18 N924 (2009). ISO9261 Test method from localised irrigation emitters, Report on Drippers Cross Test 23 September 2009, Cuerna Vaca, Mexico.
Karmeli, D. (1977). Classification of Flow Regime Analysis of Drippers, Journal of Agricultural Engineering Research, 22, 165 - 173.
Koech, R., Molle, B., Camargo, A., Dimaiolo, P., Audouard, M., Saretta, E. …..Pezzaniti, D. (Unpublished). Intercomparison testing of drippers within the INITL.
Merkley, G. (2004). Catch3D User’s Guide. Civil and Environmental Engineering Department, Utah State University, Logan, UT.
Molle, B., Gat, Y. (2000). “Model of Water Application under Pivot Sprinkler. II: Calibration and Results.” Journal of Irrigation and Drainage Engineering, 126(6), 348-354.
NAANDANJAIN Irrigation (2013) Sprinklers. Available online at:
[http://www.naandanjain.com/uploads/catalogerfiles/Sprinklers%20Booklet/NDJ_sprinklers_eng_170 613F.pdf], Accessed: 22 August 2014.
Oliphant, J. (2003). SPACE PROTM Installation and Operation Manual, Centre for Irrigation Technology, California State University, CATI Publication No. 991003, Fresno, CA.
Seginer, I., Kantz, D., Nir, D., Bernuth, R. (1992). “Indoor measurement of single-radius sprinkler patterns.” Transactions of the ASAE, 35(2)523 - 533.
Stambouli, T., Zapata, N., Faci, J. (2014). “Performance of new agricultural impact sprinkler fitted with plastic nozzles.” Biosystems Engineering, 118, 39-51.
Svubure, O., Mbavarira, H., Mutengu, S. (2010). “An investigation on the energy saving potential of mini-sprinkler irrigation systems.” International Journal of Engineering Science and Technology, 2(7), 3287-3296.
Tarjuelo, J. M., Montero, J., Carrion, P. A., Honrubia, F. T., Calvo, M.A. (1999). “Irrigation uniformity with medium size sprinklers part II: Influence of wind and other factors on water distribution.” Transactions of the ASAE, 42(3), 677-689.
Tedeschi, M., Bosio, J., Ciok, K., Cossman, H., Damme, J., Elskamp, H., …………, Vulovic, F. (2002). “Intercomparison exercise of high pressure gas flow test facilities within GERG.” Flow
Measurement and Instrumentation, 12, 397-410.
Zhang, L., Merkley, G., Pinthong, K. (2013). “Assessing whole-field sprinkler irrigation application uniformity.” Irrigation Science, 31:87-105.