HAL Id: hal-01476508
https://hal-amu.archives-ouvertes.fr/hal-01476508
Submitted on 30 Apr 2019
HAL is a multi-disciplinary open access
archive for the deposit and dissemination of
sci-entific research documents, whether they are
pub-lished or not. The documents may come from
teaching and research institutions in France or
abroad, or from public or private research centers.
L’archive ouverte pluridisciplinaire HAL, est
destinée au dépôt et à la diffusion de documents
scientifiques de niveau recherche, publiés ou non,
émanant des établissements d’enseignement et de
recherche français ou étrangers, des laboratoires
publics ou privés.
Mediterranean coastal wetland: regional vs. local
signatures
H Delattre, Christine Vallet-Coulomb, C Sonzogni
To cite this version:
H Delattre, Christine Vallet-Coulomb, C Sonzogni. Deuterium excess in the atmospheric water vapour
of a Mediterranean coastal wetland: regional vs. local signatures. Atmospheric Chemistry and
Physics, European Geosciences Union, 2015, 15 (17), pp.10167-10181. �10.5194/acp-15-10167-2015�.
�hal-01476508�
www.atmos-chem-phys.net/15/10167/2015/ doi:10.5194/acp-15-10167-2015
© Author(s) 2015. CC Attribution 3.0 License.
Deuterium excess in the atmospheric water vapour of a
Mediterranean coastal wetland: regional vs. local signatures
H. Delattre, C. Vallet-Coulomb, and C. SonzogniAix-Marseille Université, CNRS, IRD, CEREGE UM34, Europôle méditerranéen de l’Arbois, 13545 Aix-en-Provence, France
Correspondence to: C. Vallet-Coulomb (vallet@cerege.fr)
Received: 20 December 2014 – Published in Atmos. Chem. Phys. Discuss.: 20 January 2015 Revised: 17 August 2015 – Accepted: 30 August 2015 – Published: 14 September 2015
Abstract. Stable isotopes of water vapour represent a pow-erful tool for tracing atmospheric vapour origin and mixing processes. Laser spectrometry recently allowed high time-resolution measurements, but despite an increasing number of experimental studies, there is still a need for a better un-derstanding of the isotopic signal variability at different time
scales. We present results of in situ measurements of δ18O
and δD during 36 consecutive days in summer 2011 in at-mospheric vapour of a Mediterranean coastal wetland ex-posed to high evaporation (Camargue, Rhône River delta,
France). The mean composition of atmospheric vapour (δv)
is δ18O = −14.66 ‰ and δD = −95.4 ‰, with data plotting
clearly above the local meteoric water line on a δ18O-δD plot,
and an average deuterium excess (d) of 21.9 ‰. Important diurnal d variations are observed, and an hourly time scale analysis is necessary to interpret the main processes involved in its variability. After having classified the data according to air mass back trajectories, we analyse the average daily cy-cles relating to the two main meteorological situations, i.e. air masses originating from North Atlantic Ocean and Mediter-ranean Sea. In both situations, we show that diurnal fluctua-tions are driven by (1) the influence of local evaporation, cul-minating during daytime, and leading to an increase in
abso-lute water vapour concentration associated to a δvenrichment
and d increase; (2) vertical air mass redistribution when the Planetary Boundary Layer collapses in the evening, leading to a d decrease, and (3) dew formation during the night,
pro-ducing a δvdepletion with d remaining stable. Using a
two-component mixing model, we calculate the average
composi-tion of the locally evaporated vapour (δE). We find higher d(E)
under North Atlantic air mass conditions, which is consistent
with lower humidity conditions. We also suggest that δv
mea-sured when the PBL collapses is the most representative of a regional signal. Strong, cold and dry winds coming from the north bring an isotopically depleted vapour, while light, warm and wet winds coming from the south bring an isotopi-cally enriched vapour. Under northern conditions, a strong advection rate dilutes the contribution of the locally
evapo-rated vapour (δE) to the ambient moisture (δv). The higher d
values measured under northern conditions, compared to the Mediterranean situation, thus results from the combination of a higher d in both local and regional vapour. This depiction of typical daily cycles of water vapour isotopic composition can be used as a framework for further quantitative analyses of vapour sources during specific days.
1 Introduction
At the global scale, an acceleration of the hydrological cy-cle is expected in response to climate change, with an in-tensification of both precipitation and evaporation. This ef-fect has been recognized for the ocean (Dai et al., 2009), but less conclusive patterns appear for continental surfaces, especially because of the complex behaviour of land evap-otranspiration (Ohmura and Wild, 2002; Roderick and Far-quhar, 2002; Brutsaert, 2006; Roderick et al., 2007; Fu et al., 2009; Jung et al., 2010). The response of evapotranspiration to climate change is controlled both by climatic and by hy-drological parameters. Climate determines the atmospheric evaporative demand (potential evapotranspiration), while hy-drology controls surface water availability, thus limiting ac-tual evapotranspiration. In addition, continental vapour is in-volved in land–atmosphere feedbacks such as atmospheric
water recycling; high evapotranspiration may contribute to regional rainfall in contexts of tropical rainforest (Brubaker et al., 1993; Eltahir and Bras, 1996; van der Ent et al., 2010) or large scale irrigation (Boucher et al., 2004; Tuinenburg et al., 2012), or may even reduce potential evapotranspira-tion by lowering temperature and increasing humidities near the earth surface (Destouni et al., 2010; Tuinenburg et al., 2012). A better understanding of the atmospheric component of the water cycle and of the potential contribution of wet-lands evaporation to the regional water budget is thus impor-tant to anticipate the impact of global change, in particular in Mediterranean regions where more frequent droughts are expected.
Isotopic composition of atmospheric water vapour
(sub-sequently called δv) represents a great opportunity to
ex-plore land–atmosphere interactions, as the addition of mois-ture originating from evapotranspiration induces a modifica-tion of the isotopic content of the background vapour (Salati et al., 1979; Gat and Matsui, 1991; Gat et al., 1994; Gat, 2000; Worden et al., 2007; Yamanaka and Shimizu, 2007; Vallet-Coulomb et al., 2008; Risi et al., 2013). In addition, isotope tracers are now often incorporated into climate mod-els (Sturm et al., 2005; Werner et al., 2011; Risi et al., 2012, 2013) in order to improve the representation of land– atmosphere interactions and feedbacks. A major challenge is thus to propose robust databases, and associated methodol-ogy for data acquisition and interpretation.
Laser spectrometers recently opened the door towards the
high temporal resolution analysis of δvvariations, which was
not possible with the traditional cold trap method. Whereas cryogenic trapping provides grab samples generally averag-ing a couple of hours, laser spectrometry performs
continu-ous high frequency (up to ∼ 1 Hz) measurements of δv
(Kers-tel and Gianfrani, 2008). This technology offers new insights into processes that affect the isotopic composition of atmo-spheric water vapour and the number of studies based on continuous ground level isotope measurements over multi-week periods is continuously increasing, either using a tun-able diode laser (TDL) (Lee et al., 2006; Wen et al., 2010, 2012; Griffis et al., 2011; Welp et al., 2012), off-axis in-tegrated cavity output spectroscopy (OA-ICOS) (Sturm and Knohl, 2010; Sunmonu et al., 2012; Farlin et al., 2013; Steen-Larsen et al., 2013) or wavelength-scanned cavity ring-down spectroscopy (WS-CRDS) (Galewsky et al., 2011; Noone et al., 2011; Tremoy et al., 2012; Steen-Larsen et al., 2013, 2014). Among these experiments are some low latitude stud-ies which have focused on the tracing of tropical or sub-tropical convective activity in West Africa (Tremoy et al., 2012) or in South America (Galewsky et al., 2011). In mid latitudes (Noone et al., 2011; Farlin et al., 2013), or high latitudes (Steen-Larsen et al., 2013), several studies have ex-plored atmospheric mixing processes at different time scales. Isotopes have also been used for partitioning evapotranspi-ration into plant transpievapotranspi-ration and direct evapoevapotranspi-ration, as the associated fractionations are different (Yakir and Sternberg,
2000; Lai et al., 2006; Wang et al., 2010; Griffis et al., 2011; Sun et al., 2014), for a better understanding of the role of ecosystems in the hydrological cycle in the context of cli-mate change (Wang et al., 2013).
However, the number of studies remains limited because of technical difficulties associated with field-deployed long-term measurements. Except for some work based on cold trap sampling (Jacob and Sonntag, 1991; Williams et al., 2004; Angert et al., 2008), there are to our knowledge only three high time-resolution studies published from European sites (Iannone et al., 2010; Kurita et al., 2012; Aemisegger et al., 2014) and none at all treating Mediterranean areas. In addition, there is a need for dual tracer databases, in
or-der to use the deuterium excess signal (d = δD − 8 × δ18O;
Dansgaard, 1964) as an additional indicator of atmospheric processes. Indeed, d is often considered as a indicator of evaporation conditions, but its interpretation in continental vapour remains complex since it is affected by the multi-ple vapour sources, combining the initial oceanic vapour and evapotranspiration from different continental water sources (Gat et Matsui, 1991; Vallet-Coulomb et al., 2008; Lai and Ehleringer, 2011; Welp et al., 2012; Jouzel et al., 2013; Ae-misseger et al., 2014).
In this paper, we provide results obtained in Camargue on 36 consecutive days during summer 2011, using WS-CRDS technology. The Camargue region is emblematic of Mediter-ranean wetlands, with important water inflow requirements and strong evaporation losses, making it highly sensitive to climate change and human pressure on water resources. Our experimental site is located in the centre of Camargue, close
to the main lagoon (Vaccarès lagoon, 65 km2). Considering
the location of the site, and the important availability of open water in the surroundings, we expect a dominant contribu-tion of evaporacontribu-tion upon transpiracontribu-tion fluxes. This study will provide the opportunity to investigate how local evaporation combines and interact with the other regional vapour sources. We will focus on identifying the main drivers of deuterium excess variability at different time scales, and explore the rel-evance of using either relative humidity, as an indicator of evaporation conditions, or specific humidity (mixing ratio) as a proxy of mixing between different vapour sources. Be-fore analysing our results, we present technical aspects of measurement calibration and validation. We then analyse the
day-to-day variations of δvand d in relation to climatic
pa-rameters and the air mass back trajectories. Finally, average hourly variations are explored and we interpret the typical daily cycles according to the main regional meteorological conditions in order to depict their driving factors and the in-fluence of local processes.
Mediterranean Sea
Vaccarès lagoon
Saintes Maries de la Mer
Port Saint Louis du Rhône 8km Arles N Petit Rhône Rhône
1
3
2
Figure 1. Location of the experimental site (star) in Camargue
(Rhône River delta), 170 m from the Vaccarès lagoon and 12 km from the Mediterranean Sea. Coloured arrows represent the three main origins and trajectories of air masses affecting the study site, (1) North Atlantic, (2) Mediterranean and (3) Bay of Biscay.
2 Data acquisition
2.1 Protocols
Continuous in situ measurements of the isotopic
composi-tion of atmospheric water vapour (δ18O and δD) were
per-formed during summer 2011 between 20 July and 24 August, at 1.75 m height and approximately 170 m from the eastern border of the Vaccarès lagoon (Fig. 1), using Wavelength-Scanned Cavity Ring-Down Spectroscopy (WS-CRDS). The instrument we use is the Picarro L1102-i isotopic liquid wa-ter and wawa-ter vapour analyser (Picarro Inc., Sunnyvale, Cal-ifornia, USA), which measures the isotopic composition of atmospheric water vapour every 5 to 7 s. Installed in an air-conditioned room, the analyser is connected to an outside air intake. As water vapour may be sticky on the walls of any tubing, a bypass configuration is used to bring the air
in quickly, at a rate of 6 L min−1 (with a Laboport
vac-uum pump N86 KN.18) through PVC tubing, in order to minimise wall effects that lead to fractionation in the inlet. The analyser then subsamples this air at a rate lower than
0.04 L min−1.
Calibration of laser measurements is performed accord-ing to liquid laboratory standards, and a three-way valve al-lows switching between the introduction of ambient air and vapour from the liquid sample vaporizer (vaporization
mod-ule V1102-i adjusted to 110◦C for flash vaporization to avoid
fractionation). We used three laboratory standards whose iso-topic compositions span a range of values including the
com--180 -130 -80 -30 20 0 10000 20000 30000 R a w δ D (‰ ) [H2O] (ppmv) -20 -15 -10 -5 0 5 R a w δ 18O (‰ ) Standard 3 Standard 2 Standard 1 δ18O slope=-0.33*10-4, R2=0.75 δD slope=7.8*10-4, R2=0.98 δ18O slope=-0.05*10-4, R2=0.08 δD slope=8.1*10-4, R2=1.00 δ18O slope=-0.03*10-4, R2=0.02 δD slope=7.8*10-4, R2=0.99
Figure 2. Raw δ18O and δD of our three laboratory liquid stan-dards measured at various water vapour concentrations. Error bars are smaller than the symbols. Linear regressions within the concen-tration range encountered in Camargue during the field experiment and associated slopes and determination coefficients are shown.
position expected in the atmosphere of the Camargue (Ta-ble 1). 1.8 µL of water standards is injected into the vaporizer using an autosampler (CTC Analytics LEAP Technologies HTC PAL autosampler) with a SGE 5 µL syringe. We used synthetic air as the dry carrier gas (water content < 45 ppmv) delivered at a pressure of 2.5 ± 0.5 psi. The analyser takes about 9 min to perform approximately 40 measurements per injection, and these results are then averaged by the soft-ware. Between each injection, the syringe is cleaned with 1-methyl-2-pyrrolidinone (NMP) solvent wash. Our laboratory successfully participated in the IAEA 2011 proficiency test
on routine analysis of δ18O and δD in liquid water
(Wasse-naar et al., 2012).
Previous studies have shown that optical spectrometric methods can induce a dependence of isotopic measurements on water vapour concentration (Gupta et al., 2009; Schmidt et al., 2010; Johnson et al., 2011; Tremoy et al., 2011). This does not affect liquid sample measurements, since the water quantity introduced into the analyser through the vaporizer is nearly constant, but important variations of vapour con-tent do occur when analysing ambient atmosphere, making it necessary to correct optical measurements. We have evalu-ated the concentration dependence of our instrument for a large range of water concentrations, and for different iso-topic compositions using our three standards (Fig. 2). In ad-dition, for routine analyses, an evaluation of the water con-centration effect is performed at intervals of approximately 24 h with the more depleted standard (standard 1) whose isotopic composition is close to the atmosphere of the Ca-margue. The autosampler is set to perform six injections of 0.9, 1.6 and 2.0 µL in the vaporization module to obtain three water vapour concentrations ranging from about 8000 to 28 000 ppmv, comprising values expected in the study
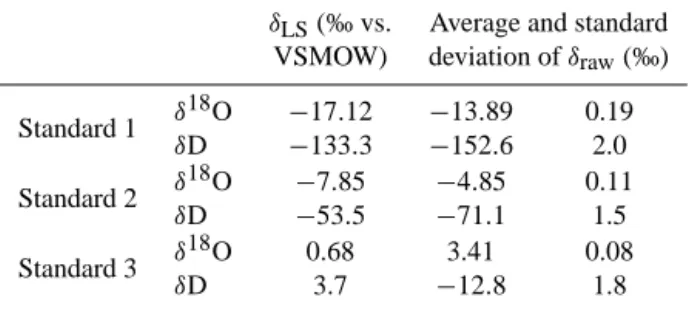
Table 1. Isotopic compositions of laboratory standards (δLS), and statistics on raw measurements from all calibrations (average and standard deviation of δrawfrom 40 data between 20 July to 24
Au-gust 2011).
δLS(‰ vs. Average and standard
VSMOW) deviation of δraw(‰)
Standard 1 δ 18O −17.12 −13.89 0.19 δD −133.3 −152.6 2.0 Standard 2 δ 18O −7.85 −4.85 0.11 δD −53.5 −71.1 1.5 Standard 3 δ 18O 0.68 3.41 0.08 δD 3.7 −12.8 1.8
area. In addition, calibration for isotopic composition is per-formed at least every 24 h with our three standards. For each standard, the autosampler is set to perform six injections of 1.8 µL in the vaporization module, corresponding to a wa-ter vapour concentration of approximately 20 000 ppmv. The first two injections are disregarded to remove the memory effect, and the last four injections are averaged to obtain the
δ18O and δD measurements of each standard.
Gaps in time series correspond to calibration periods, but may also reflect accidental power cuts or data eliminated dur-ing episodes of condensation in the tubdur-ing. This latter prob-lem was detected thanks to the use of transparent air tubing, and was easily recognizable a posteriori through the abnor-mally smooth shape of the water vapour concentration curve. A heating cable was then used to avoid any condensation such as may occur when a negative temperature gradient ex-ists between the sampling point and the inlet of the analyser.
2.2 Dependence on water vapour concentration
It has been shown that the dependence of WS-CRDS iso-topic measurements on water vapour concentration is spe-cific to the individual analyser (e.g. Johnson et al., 2011; Tremoy et al., 2011; Aemisegger et al., 2012). The concen-tration dependence of our instrument, evaluated for a large range of concentrations (Fig. 2), showed a linear response in the range of water vapour concentration measured in the atmosphere of the Camargue (from 9000 to 28 000 ppmv), with the relationship deviating slightly from the linear trend
at very low and high water vapour concentrations. For δ18O
of standards 2 and 3 there is no concentration effect, but a small dependence did appear for the more depleted standard
(−0.33 ‰ 10 000 ppmv−1; R2=0.75). For δD, we found
significant regression coefficients (R2=0.98, 0.99 and 1.00
for standards 1, 2 and 3 respectively), and the slope of the de-pendence was only slightly different between standards
(be-tween 7.8 and 8.1 ‰ 10 000 ppmv−1).
This justifies the use of only one standard (standard 1) to perform the very time-consuming daily calibration of the water concentration effect (160 min for a three-point
cali-bration). Measurements are corrected for concentration de-pendence before applying the isotopic calibration in order to drive back atmospheric measurements to the water vapour
concentration wreference at which standards are measured as
follows (Schmidt et al., 2010):
δreference=δobserved+m · (wreference−wobserved) , (1)
where δreference (‰) is the reference δ value at wreference
(20 000 ppmv in our case); δobserved (‰) is the observed
δ value at wobserved (ppmv) the observed concentration; m
(‰ ppmv−1) is the slope of the concentration dependence
(Table 2).
2.3 Instrument stability
To evaluate the long-term stability of our instrument, statis-tics were calculated on raw delta values measured on our three standards during the entire field measurements (Ta-ble 1). Results show that the long-term variability is very low, but a regular calibration is nevertheless performed. Vari-ability of both calibrations (for water vapour concentration
and isotopic composition) is shown in Table 2. For δ18O,
the calibration for concentration appears highly variable but often flat (no concentration effect), resulting in a linearity
which is not always significant (0.26 ≤ R2≤1.00). Thus,
δ18O was corrected only when the concentration
depen-dence was significant. For δD, the regression is slightly vari-able in the long-term, and its linearity is always significant
(0.89 ≤ R2≤0.99). For daily calibration in isotopic
com-position (normalization to the VSMOW2-SLAP2 scale), we used a three-point calibration, which allows to check for the linearity of the calibration. Linear regressions between raw measured values and absolute standard compositions are
es-tablished as follows for δ18O and δD:
δcalibrated=slope · δmeasured+intercept. (2)
Regressions are stable in the long-term (Table 2), and their
linearity is always significant (R2=1.00). Accuracy and
precision of our instrument, estimated by considering stan-dard 2 as a sample which has been calibrated with stanstan-dards 1 and 3, show good results (Table 3). These performances are estimated on liquid measurements, and are probably lower for vapour measurements.
3 Local atmospheric data
Hourly air temperature and relative humidity were mea-sured at the study site. Hourly wind speed and daily PET (Potential Evapotranspiration calculated from the Penman-Monteith formula (Penman-Monteith, 1965)) were obtained from a meteorological station located 400 m far from the site of iso-topic measurements. In addition, surface temperature was also measured in the main pond of the Vaccarès lagoon sys-tem at hourly time step.
Table 2. Evaluation of the stability of the calibrations in water vapour concentration and isotopic composition, with mean slope and mean
intercept ±1 standard deviation obtained for δ18O and δD with n calibrations performed from 20 July to 24 August 2011.
δ18O δD
Water vapour concentration
Slope −0.16 × 10⁻⁴±0.13 × 10⁻⁴ 6.08 × 10⁻⁴±0.99 × 10⁻⁴ Intercept −13.68 ± 0.25 −165.4 ± 2.0 R2(n = 23) 0.26 ≤ R2≤1.00 0.89 ≤ R2≤0.99 Isotopic composition Slope 1.03 ± 0.01 0.98 ± 0.01 Intercept −2.83 ± 0.07 16.3 ± 1.7 R2(n = 40) 1.00 1.00
Table 3. Results of standard 2 measurements (δstd2−m) normalized
to the VSMOW2-SLAP2 scale by using standards 1 and 3 as work-ing standards, followwork-ing the IAEA Reference Sheet (IAEA, 2009). Statistics are calculated from the set of 40 calibrations. Standard de-viation provides the reproducibility, and the root mean square devi-ation from the known value (RMSE) provides the accuracy of liquid measurements. δ18O δD d (‰ VSMOW) (‰ VSMOW) (‰) Average of δstd2−m −7.82 −53.4 9.16 Standard deviation 0.117 0.89 1.29 RMSE 0.121 0.89 1.30
Regional advection conditions were determined for each individual day by computing backward three-dimensional trajectories with the Internet-based NOAA HYSPLIT Trajec-tory Model (http://ready.arl.noaa.gov/HYSPLIT.php). The HYSPLIT (Hybrid Single-Particle Lagrangian Integrated Trajectory) model is a complete system, which allows com-puting simple air parcel trajectories using GDAS (Global Data Assimilation System) meteorological data. Trajecto-ries were initialized at the station location every 24 h at 12:00 UTC, at three heights (50, 100 and 500 m) above ground level. A minimum back-run time of 72 h was com-puted, and extended, when necessary, in order to reach either the Mediterranean Sea, or the Atlantic ocean (depending of the wind regime, a maximum of 144 h was computed). The air mass trajectories were consistent between the three differ-ent initial altitudes, and hourly data were then classified, on a daily basis (i.e. from 00:00 to 23:00 UTC), according the three air mass origins represented in Fig. 1: Mediterranean, North Atlantic, or Bay of Biscay.
Planetary boundary layer heights were obtained from GDAS meteorological data (3 h time step). They were ex-tracted and interpolated to our specific station using the Me-teoInfo software (www.meteothinker.com).
In addition, we collected and analysed three rainfall sam-ples corresponding to four small rainfall events (25, 26, 27 July, 7 August 2011). These samples account for a total of 7.6 mm of the 9.6 mm of cumulated rainfall during the mea-surement campaign; the remaining 2 mm correspond to eight very small events between 14 and 23 August (not sampled).
4 Results and discussion
The mean composition of atmospheric water vapour
during the campaign is δ18O = −14.66 ‰, δD = −95.4
and d = 21.9 ‰, with significant daily variations, from
δ18O = −19.22 to −9.96 ‰ and δD = −125.2 to −61.7 ‰,
while d varies between 7.8 and 31.2 ‰ (Fig. 3). These deu-terium excess values are higher than those of our three
rain-fall samples: 5.6, 4.5 and 7.0 ‰, (for δ18O = −3.89, −3.7,
and −0.66 ‰ respectively), and also higher than the long-term average composition of regional precipitation in the neighbouring GNIP (Global Network of Isotopes in Precip-itation) station (Avignon, ≈ 50 km far from the experimen-tal site; d = 9.2 ‰). The composition of vapour in equilib-rium with rainfall is plotted for comparison (Fig. 3). Values
slightly enriched in18O compared to measured δvsuggest a
probable evaporation of rainfall in the atmosphere, a classical feature for small summer rainfall events (Celle-Jeanton et al., 2001), while values slightly depleted in deuterium compared
to measured δvpoints to the influence of an enriched vapour
at ground level.
In measured atmospheric vapour composition, substantial
day-to-day variations of δv are observed, while d presents
high hourly variations (Fig. 3). In order to explore the rele-vant time scales to interpret isotopic data in terms of synop-tic and mesoscale meteorology vs. local influences, we first analyse the relations of our data to daily climatic variables and air mass origins. Then, we focus on average diurnal vari-ations to identify the local influences.
Table 4. Determination coefficients (R2) and slopes (S) of linear correlations between daily means of water vapour composition (δ18O, δD,
d) and air temperature (Ta), mixing ratio (q), relative humidity at air temperature (RHa) and relative humidity at water surface temperature
(RHs). δ18O (‰) δD (‰) d(‰) R2 S R2 S R2 S Ta(◦C) 0.30 +0.54 0.27 +3.48 0.20 −0.88 q(mmol mol−1) 0.72 +0.38 0.62 +2.39 0.54 −0.66 RHa(%) 0.64 +0.13 0.55 +0.80 0.51 −0.23 RHs(%) 0.33 +0.13 0.31 +0.83 0.19 −0.19 10 15 20 25 30 35 T ( ° C)
North Atlantic conditions Mediterranean conditions
Bay of Biscay conditions Vapor in isotopic equilibrium with precipitation
5 10 15 20 25 30 q (m m o l.m o l-1) -126 -116 -106 -96 -86 -76 -66 δD vs V SM OW (‰ ) 200 205 210 215 220 225 230 235 Day of year -20 -18 -16 -14 -12 -10 δ 18 O vs V SM OW (‰ ) 5 10 15 20 25 30 35 d vs V SM OW (‰ )
Figure 3. Hourly time series of air temperature (T ), mixing ratio
(q), δ18O, δD, deuterium excess (d) from 20 July to 24 August 2011 at the experimental site according to air mass origin (see Fig. 1). Grey dots are δvand d values calculated from the isotopic
equilib-rium with precipitation.
4.1 Correlations between isotope data and local
climatic parameters
Quite good correlations are found between daily values of
δv and local climatic parameters (Table 4), the best fit
be-ing with the mixbe-ing ratio q, (R2=0.72 and 0.62 for δ18O
and δD respectively). Such a correlation could result from the case of simple Rayleigh rainout processes, where condensa-tion phases progressively remove water from the atmosphere and deplete the remaining atmospheric vapour in heavy
iso-topes (Dansgaard, 1964; Lee et al., 2006; Wen et al., 2010). The progressive rainout follows a temperature decrease, and
should also result in a correlation between δv and T , and
subsequently between rainfall isotope content (δp) and T ,
which has led to the establishment of the isotopic thermome-ter (Dansgaard, 1964; Jouzel et al., 1997). Our data show
a relation between δv and T (Table 4, Fig. 3) close to the
isotopic thermometer: 1δ18O/1T = 0.53 ‰◦C−1(Jouzel et
al., 1997), but the correlation is relatively poor (R2=0.30),
indicating more complex processes, as was observed
dur-ing a long-term German survey in which δv–T correlation
was degraded during summer because of the admixture of vapour originating from plant transpiration (Jacob and
Son-ntag, 1991). Since the correlation between δvand q is much
stronger than the δv–T correlation, it indicates a mixing
be-tween air masses characterized by different vapour concen-trations, as could result from different marine origins and/or from the addition of continental vapour into the atmosphere. With respect to deuterium excess, we found that q is also the best predictor of d variations at a daily time step
(R2=0.54, Table 4). In addition, we observed a correlation
between d and RHa (R2=0.51), consistent with Welp et
al. (2012), but the correlation becomes very low (R2=0.19)
when using relative humidity at surface temperature (RHs).
The significance of deuterium excess in terms of a proxy for the conditions at the vapour sources comes from the fact that it is determined by the kinetic isotopic fractionation that oc-curs during evaporation. The kinetic fractionation mainly de-pends on relative humidity at the water surface, which repre-sents the vapour concentration gradient between the liquid-vapour interface and free air (Craig and Gordon, 1965; Gon-fiantini, 1986; Pfahl et Wernli, 2008; Uemura et al., 2008). Relative humidity is not conservative during air mass trans-port, as temperature changes modify the saturated vapour pressure, and the value measured at the meteorological sta-tion has to be reported at surface temperature.
Starting from a value around d = 0 ‰ in ocean water, the kinetic fractionation associated to the initial seawater evapo-ration produces an increase in d in oceanic vapour inversely related to humidity conditions (Merlivat and Jouzel, 1979; Armengaud et al., 1998; Pfahl et Wernli, 2008; Uemura et al., 2008; Jouzel et al., 2013; Steen-Larsen et al., 2013).
-126 -116 -106 -96 -86 -76 -66 -20 -18 -16 -14 -12 -10 δD vs V SM OW (‰ ) δ18O vs VSMOW (‰) GMWL LMWL
Day-time vapor under North Atlantic conditions Night-time vapor under North Atlantic conditions Day-time vapor under Mediterranean conditions Night-time vapor under Mediterranean conditions Day-time vapor under Bay of Biscay conditions Night-time vapor under Bay of Biscay conditions δD=8*δ18O+10
δD=(7.6±0.1)*δ18O+(6.4±0.5) (Celle et al., 2000) δD=7.0*δ18O+9.3, R2=0.88 δD=5.7*δ18O-15.2, R2=0.88 δD=7.1*δ18O+9.8, R2=0.82 δD=7.9*δ18O+13.2, R2=0.91 δD=7.5*δ18O+16.2, R2=0.95 δD=6.4*δ18O-3.8, R2=0.95
Figure 4. Hourly daytime and night-time isotopic composition of
atmospheric water vapour according to air mass origins. For refer-ence, the Global Meteoric Water Line (GMWL) and Local Meteoric Water Line (LMWL) are also plotted.
During the air mass trajectory over land, d may be further in-creased by the addition of vapour of continental origin (Gat and Matsui, 1991; Gat et al., 1994; Angert et al., 2008; Lai and Ehleringer, 2011; Welp et al., 2012). This “secondary” vapour is also expected to carry a d value inversely related to humidity conditions at the vapour source (Aemisseger et al.,
2014). However, the lack of correlation between d and RHs
in our data, whilst the d–q correlation is stronger, suggests,
as was the case for the δv–q correlation, that mixing
pro-cesses between air masses characterized by different vapour
origins and concentrations have weakened the d-RHs
rela-tion.
Since it is hardly modified by equilibrium condensation, d can be considered as a conservative tracer of vapour sources during mixing processes. Nevertheless, the conservative be-haviour of d during rainout is perturbed by the non-linearity in the definition of deuterium excess: the delta-notation ap-proximation induces a small shift in d when there is a large
decrease in δ18O and δD (Gat et al., 1996; Angert et al., 2008;
Welp et al., 2012). In the observed range of δ18O (from −11
to −18 ‰), we have estimated this effect to induce a 2.5 ‰ increase in d, while the substantial variations in d observed in our daily data are significantly higher (from 15 to 26 ‰), allowing the use of d as a tracer of different vapour pools.
4.2 Regional isotopic signatures
In order to examine the link between the isotopic character-istics of vapour and the air mass origin, we analyse the data classified according to the three main backward trajectories schematically represented in Fig. 1 (see Sect. 3).
Correspond-ing hourly data are scattered in the δ18O-δD plot distinctly
above the local meteoric water line (LMWL, Fig. 4), and show isotopically depleted compositions for air masses com-ing from the North Atlantic, while air masses comcom-ing from the Mediterranean Sea display isotopically enriched vapour (Table 5, Fig. 4). For air masses coming from Bay of Bis-cay, hourly data encompass the entire isotopic range. Local
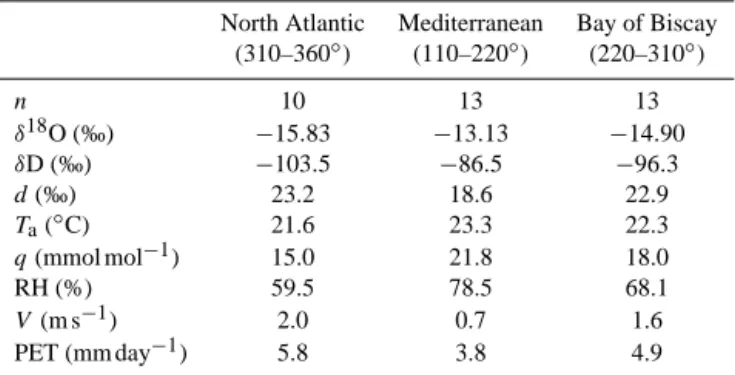
Table 5. Number of days (n) associated with the different origins
of air masses (Fig. 1). Corresponding mean values of δ18O, δD, deuterium excess (d), air temperature (Ta), mixing ratio (q),
rela-tive humidity (RH), wind speed (V ) and potential evapotranspira-tion (PET) measured in the experimental site.
North Atlantic Mediterranean Bay of Biscay
(310–360◦) (110–220◦) (220–310◦) n 10 13 13 δ18O (‰) −15.83 −13.13 −14.90 δD (‰) −103.5 −86.5 −96.3 d(‰) 23.2 18.6 22.9 Ta(◦C) 21.6 23.3 22.3 q(mmol mol−1) 15.0 21.8 18.0 RH (%) 59.5 78.5 68.1 V(m s−1) 2.0 0.7 1.6 PET (mm day−1) 5.8 3.8 4.9
climatic data associated with the three meteorological situa-tions reflect synoptic weather condisitua-tions related to air mass origins. Air masses coming from the North Atlantic are as-sociated with strong, cold and dry winds, while those from the Mediterranean are associated on the contrary with light, warm and wet winds (Table 5). The Bay of Biscay is an inter-mediate situation. It thus appears that the greater the distance
over land (Fig. 1), the more depleted δv. The northern
tra-jectory corresponds to a “Mistral” situation: a typical strong north–northwest wind that affects the north of the occiden-tal Mediterranean basin 130 days a year on average. The air mass is gradually dried out by rainout processes over land and accelerated in the Rhône River valley and acquires a de-pleted isotopic signature. On the contrary, an air mass travel-ling over the Mediterranean Sea with the slight thermal wind or sea breeze coming from the south is moistened and ac-quires and maintains an enriched isotopic signature.
With respect to d, North Atlantic air masses bring higher values (23.2 ‰) than Mediterranean air masses (18.6 ‰),
but the main feature, which appears on the δ18O-δD plot
(Fig. 4), is the distinct separation between nocturnal and di-urnal hourly data, with the latter plotting higher above the meteoric lines. This feature is observed for each of the three air mass origins.
Within these three classes of data, strong linear relation-ships are observed (Fig. 4), with slopes lower than eight, a value attributed to thermodynamic equilibrium, as it ap-proximately represents the average ratio between D and
18O liquid-vapour equilibrium fractionation. Such low slopes
have also been observed in atmospheric vapour from Hawaii (7.02 (Bailey et al., 2013)), Greenland (between 6.47 and 7.44 (Steen-Larsen et al., 2013)), western Siberia (between 5.6 and 7.7 (Bastrikov et al., 2014)), and in North America (7.5 (Berkelhammer et al., 2013)). The previously described shift in d during Rayleigh-type rainout, due to the non-linearity in the deuterium excess definition, is not sufficient to explain these low slopes, and non-equilibrium processes
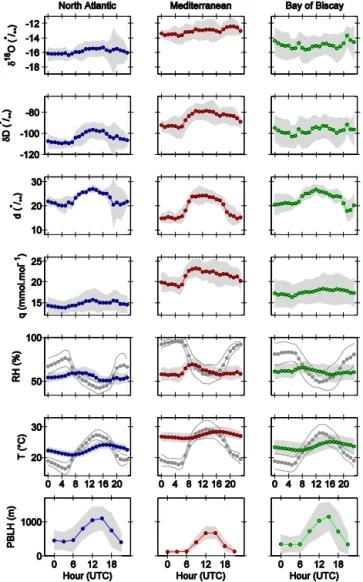
Figure 5. Average daily cycles of δ18O, δD, deuterium excess (d), relative humidity at surface (RHs) and air (RHa, grey symbols)
tem-perature, surface (Ts) and air (Ta, grey symbols) temperature,
mix-ing ratio (q) and planetary boundary layer height (PBLH) calculated from 20 July to 24 August 2011 according to the three air mass origins. Grey shading indicates standard deviation of each average value.
such as evaporation are also probably involved (Gibson et al., 2008).
4.3 Analysis of average daily cycles
In order to observe the diurnal variations suggested by the night–day separation, average daily cycles of isotopic and climatic data are plotted for the three air mass origins (Fig. 5). A well-pronounced cyclicity appears for d in each meteorological condition. For the Bay of Biscay origin, the average d cycle is very similar to the North Atlantic case, with larger standard deviations, reflecting a more variable climatic situation. For Mediterranean conditions, the d cy-cle is higher in amplitude than for North Atlantic conditions,
and lower in absolute values, especially during the night. The high standard deviations observed during the last hours of the day correspond to calibration periods for which there are fewer data, but may also be due to variations in the timing of the PBL evening transition. The increase in d during the
morning is mainly associated with a δD increase, while δ18O
variations are smoother. Amplitudes of daily isotopic varia-tions are higher for Mediterranean condivaria-tions (9.7, 16.2 and
1.3 ‰ for d, δD and δ18O respectively) than for North
At-lantic ones (7.0, 13.1 and 1.1 ‰ for d, δD and δ18O
respec-tively).
From a climatic point of view, we observe high diurnal
variations in RHa, mainly driven by the large amplitude of
air temperature variations between night and day (Fig. 5). As discussed above, the significance of relative humidity con-ditions in terms of evaporation concon-ditions – and deuterium excess control – is only relevant at surface temperature. The
variations are smoother for RHs, and it more or less follows
the absolute amount of water (Fig. 5). Under Mediterranean conditions, a distinct increase of q occurs in the morning, in-dicating a net addition of vapour in the atmosphere. Under North Atlantic conditions, the q increase is lower, but still detectable.
The daily cyclicity of the planetary boundary layer height (PBLH) is specifically related to the different atmospheric conditions. The PBLH attains around 1100 m on average during the afternoon under North Atlantic and Bay of Bis-cay conditions, with a significant standard deviation. Under Mediterranean conditions, the PBLH is less variable and re-mains at almost 700 m. Nocturnal values are also very low – less than 100 m – in Mediterranean conditions, compared to 400–500 m in the other weather situations (Fig. 5). Low PBLH in Mediterranean conditions corresponds to weak tur-bulence and air stability resulting from light winds, while northerly advection transports a relatively cold air mass over a warmer surface, leading to a weaker stratification.
4.3.1 Daytime processes: contribution of local
evaporation
The diurnal increase in d is a widely observed feature, which reflects the diurnal variation of the water and air mass bal-ances of the planetary boundary layer (Lai and Ehleringer, 2011). This increase can be caused by the entrainment of free atmosphere into the boundary layer (Zhang et al., 2011; Welp et al., 2012; Berkelhammer et al., 2013), but also by the addition of locally evaporated vapour. The direction of vapour concentration changes associated with these d vari-ations can help to identify which of these two processes dominates the PBL water mass budget. Entrainment brings a dryer air into the PBL, and thus causes a daytime decrease in vapour concentration, while an increase in mixing ratio in-dicates the addition of an evaporation flux. Note that the tran-spiration component of evapotrantran-spiration is not expected to carry high d, as it has the same isotopic composition as the
soil water at steady state (Yakir and Wang, 1996; Williams et al., 2004). In addition, the free atmospheric air is charac-terized by a isotopically lighter vapour (He and Smith, 1999; Bailey et al., 2013; Berkelhammer et al., 2013), and the dom-inance of entrainment during daytime is generally associated
with a δv depletion (Lai et al., 2006; Lai and Ehleringer,
2011; Tremoy et al., 2012; Bailey et al., 2013; Berkelham-mer et al., 2013). Welp et al. (2012) compared six measure-ment locations and found that both local evapotranspiration and entrainment were involved: in some of their sites, the d
daily increase was associated with a δ18O decrease during
the early morning due to entrainment of free atmosphere into the boundary layer during convective mixing, while the
sub-sequent slight δ18O increase came from evapotranspiration.
Our data display a simultaneous increase in q, δ18O and δD
(Fig. 5), and thus indicate that the addition of surface vapour is the dominant process governing the d cyclicity during the day.
4.3.2 Nocturnal processes: dew formation
In each meteorological situation, d displays an abrupt de-crease at around 20:00 UTC, which corresponds to the timing of sunset. Afterwards, during the 20:00–06:00 UTC period, d
remains low, while δvfollows a gradual depletion associated
with a q decrease (Fig. 5). This corresponds to the effect of a progressive Rayleigh-condensation process, and indicates the formation of dew induced by the nocturnal cooling of soil and/or leaves surfaces, as was observed by Berkelhammer et al. (2013).
A small nocturnal evaporation of the lagoon water could nevertheless occur since the water surface temperature
re-mains high and maintains RHsbelow saturation (Fig. 5), but
it is expected to remain low compared to daytime fluxes. During the night, the PBL subsidence corresponds to the re-duction of both the surface heat fluxes and entrainment, and the addition of water vapour to the atmosphere, if any, re-mains low. The large-scale motion becomes dominant and, without changing the total PBL mass, redistributes it hor-izontally (Medeiros et al., 2005). The nocturnal isotopic values thus represent the average composition of the PBL, onto which are superimposed daytime fluxes. More precisely, since dew formation is a local process, the value measured just after the sunset (20:00 UTC), when the PBL collapses, is probably the most representative composition of the av-erage PBL, with the greater proportion of regional water vapour. The high d values observed during the night (on average 15.1 ± 0.5 ‰ under Mediterranean conditions and 20.9 ± 0.7 ‰ under North Atlantic conditions), thus result from the remaining imprint of local evaporation, combined with the signature of the regional atmosphere.
4.4 Local isotopic signatures
The concomitant increase of q and d during daytime in our average diurnal cycles indicates that the d cyclicity is mainly driven by the addition of surface vapour fluxes. As stated above, the location of the experimental site close to the main lagoon, and the availability of large open water areas in the surroundings point to a dominant contribution of evaporation over transpiration. In order to calculate the isotopic
compo-sition of the locally evaporated vapour (δE), we use a
two-component mixing model based on the linear correlation
be-tween 1/q and δv, derived from the “Keeling plot” method.
The ability of this simple model to describe our data and the possible contribution of regional advection is then dis-cussed. The original Keeling approach (Keeling, 1958) was
initially proposed to describe the addition of CO2 into the
atmosphere, and then further used to determine the isotopic composition of evapotranspired vapour flux (Yakir and Stern-berg, 2000; Yepez et al., 2003; Williams et al., 2004; Wang et al., 2010; Zhang et al., 2010; Noone et al., 2011, 2013; Lee et al., 2012; Griffis et al., 2013). Assuming a background
rep-resented by an initial air quantity with a mixing ratio qBG
(mmol mol−1), and taking nA (mol) the corresponding dry
air amount, the addition of water vapour nE(mmol) leads to
the following mixing equation:
q = qBG+
nE
nA
, (3)
where q is the mixing ratio (mmol mol−1) of the resulting
humid air (note that nE/nAdoes not represent a mixing ratio
despite same units). Attributing an isotopic composition to
each of these vapour pools, δBGfor the background vapour
and δEfor the added vapour, the corresponding isotopic mass
balance is
δv=(δBG−δE) ·
qBG
q +δE, (4)
where δv is the vapour composition of the resulting
atmo-sphere. In a data set tracing the progressive addition of pure vapour in a closed system, and assuming an isotopically
sta-ble background, the δvvs. 1/q relationship displays a linear
trend. The composition of the added vapour δEis therefore
deduced from the intercept (for q →∝).
However, when the increase in water vapour concentra-tion results from the mixing with a humid air mass, Eq. (3) becomes
q = xqBG+(1 − x)qE, (5)
where x is the fraction of the initial background air, and qEis
the mixing ratio of the added air mass (mmol mol−1). Thus,
the corresponding expression for δvis
δv=(δBG−δE) ·
xqBG
-18 -16 -14 -12 -10 δ 18O vs V SM OW (‰
) North Atlantic conditions:
05:00 to 13:00 UTC 14:00 to 19:00 UTC 20:00 to 04:00 UTC
Corresponding local vapor end-member
Mediterranean conditions:
05:00 to 10:00 UTC 11:00 to 19:00 UTC 20:00 to 04:00 UTC
Corresponding local vapor end-member
-120 -100 -80 -60 -40 -20 0.02 0.03 0.04 0.05 0.06 0.07 0.08 δD vs V SM OW (‰ ) 1/q (mol.mmol-1)
Figure 6. Relationships between hourly average values of δvand
1/q over a daily cycle according to the two main air mass origins, and corresponding linear regressions for the period of q increase (δ18O = −98.1 · (1/q) − 9.2 (R2=0.84), δD = −1606.7 · (1/q) + 6.3 (R2=0.93) for North Atlantic conditions, and δ18O = −72.4 ·
(1/q) − 9.9 (R2=0.89), δD = −1444.8 · (1/q) − 18.7 (R2=0.96) for Mediterranean conditions). Squares indicate the isotopic com-position of the local end-member (δE) calculated for a mixing ratio
corresponding to saturation at the water surface temperature.
The composition of the added vapour is then deduced from
the δvvs. 1/q plot for x = 0, i.e. for q = qE, and the mixing
ratio of the added air (qE) is a prerequisite for applying this
two-component mixing model. For a humid air mass coming from open water evaporation, a mixing ratio corresponding to
saturation conditions at the liquid-vapour interface (qE=qs)
can be considered as representing the limit condition (Craig and Gordon, 1965; Noone et al., 2011; Noone, 2012).
Our discussion will focus on the two most contrasted meteorological situations, i.e. Mediterranean and North At-lantic air mass origins. Strong correlations are found
be-tween average values of δvand 1/q for the period of q
in-crease, i.e. 05:00–13:00 UTC for North Atlantic situations
and 05:00–10:00 UTC for Mediterranean situations (R2
val-ues are between 0.85 and 0.96, see Fig. 6). The local end-members are calculated for the average value of saturation
mixing ratio at the water surface temperature (qs), during
the daily maximum air water concentrations (at 13:00 or 10:00 UTC). Uncertainties are determined as resulting from
error propagation of the linear model in the whole range of qs
standard deviation. The resulting compositions of local
end-members (δE) are δ18O = −12.5 ‰ (−11.0 to −13.9 ‰);
δD = −48 ‰ (−30 to −64 ‰) for North Atlantic
condi-tions, δ18O = −11.8 ‰ (−11.0 to −12.5 ‰); δD = −58 ‰
(−46 to −68 ‰) for Mediterranean conditions (Fig. 7). High deuterium excess values characterize the surface vapour for North Atlantic (d = 52 ± 29 ‰) and Mediterranean condi-tions (37±17 ‰), which is consistent with previous estimates from the Craig and Gordon model (Craig and Gordon, 1965; Gat et al., 1994). Such high d is a characteristic of vapour coming from continental evaporation and allowed to detect the contribution of continental vapour to regional
precipita--120 -100 -80 -60 -40 -18 -16 -14 -12 -10 δD vs V SM OW (‰ ) δ18O vs VSMOW (‰) LMWL
North Atlantic conditions:
05:00 to 13:00 UTC 14:00 to 19:00 UTC 20:00 to 04:00 UTC
Corresponding local vapor end-member
Mediterranean conditions:
05:00 to 10:00 UTC 11:00 to 19:00 UTC 20:00 to 04:00 UTC
Corresponding local vapor end-member
A B
C
Figure 7. Hourly average values of δD vs. δ18O over a daily cycle, according to the two main air mass origins, corresponding linear regressions for the period of q increase (see text), and calculated local end-member (δE). For reference, the LMWL is also plotted.
tion (Gat et Matsui, 1991; Gat et al., 1994; Vallet-Coulomb et al., 2008). In our case, these high d values confirm that evap-oration is largely dominant over transpiration, and that the higher d under North Atlantic air mass conditions is
consis-tent with lower RHs, compared to Mediterranean conditions
(Fig. 5, Table 5).
Going on with the two end-member mixing assumption,
this δE composition could be used to interpret the
ampli-tude of diurnal δv variations in terms of the daily addition
of locally evaporated vapour to the nocturnal background. The lower amplitude of diurnal variations observed under North Atlantic condition (Fig. 7) would then indicate a lower proportion of locally evaporated vapour in ambient mois-ture. However, this is not consistent with the stronger aver-age potential evapotranspiration rates under North Atlantic conditions, compared to the Mediterranean situation: 5.8 vs.
3.8 mm day−1 (Table 5). This apparent contradiction
indi-cates that the isotopic imprint of local evaporation is diluted by advection, with a greater extend under Northern condi-tions than under Mediterranean condicondi-tions. This is fully con-sistent with the high wind speed characterizing North
At-lantic conditions: an average value of 2.0 m s−1compared to
0.7 m s−1for Mediterranean conditions. Local vapour is thus
flushed by advection of dry northward air masses, and since this advected vapour may carry a different isotopic signa-ture than the nocturnal background, a simple two-component mixing model is not sufficient to describe the PBL water bal-ance.
We have evaluated the impact of regional advection on
the determination of δE, by testing different simulations of
a three-component mixing process. Starting from the
ini-tial background (δBG=average δvvalue at 05:00 UTC), we
simulate the progressive addition of both regional advected
vapour (δR) and locally evaporated vapour (δE), and we
com-pare the resulting composition with observed δv during the
q-increase period of the day. For each simulation, we choose
a hypothetical value of δR, and we adjust δEin order to match
the observed data on the δvvs. 1/q relationship, using a
sim-ple trial-and-error procedure, successively for δ18O and δD.
observed during sunset, on the δ18O-δD plot (Fig. 7). As
discussed previously, the δv value measured at 20:00 UTC
is expected to carry the lowest proportion of locally evapo-rated vapour. We thus postulate that the shift in d observed at 20:00 (“B” arrow in Fig. 7) is “dragged” by the composition of a more regional vapour. We have then explored a domain
of δRvalues limited by (1) the 20:00 UTC value as an upper
limit for δD; (2) the 20:00 UTC (05:00 UTC) value as a lower
limit for δ18O under Mediterranean (North Atlantic)
condi-tions and (3) the LMWL. For each δRvalue, different mixing
ratio were tested (qR), chosen to remain compatible with the
midday–20:00 UTC trend observed on the 1/q − δvplot. We
found that in all cases, the δEvalues remain in the range of
the error bars shown in Fig. 7, with slightly lower δ18O and
higher d.
The processes involved in the diurnal isotopic behaviour of
atmospheric vapour can be summarized in the δ18O-δD plot,
which is a good mean to understand the drivers of d varia-tions (Fig. 7). The two clusters of average vapour data are distributed along two linear trends defined by the q-increase period of the day (“A” arrow in Fig. 7), which also meet the
calculated value of δE. These trends result from the addition
of locally evaporated vapour into the ambient air, but, as dis-cussed above, are also influenced by the input of (and flush-ing by) regional advection. The daytime vapour composition
then oscillates, but stays around the maximum δvvalue,
un-til the abrupt shift that occurs at 20:00 UTC, during sunset, consistently for both meteorological situations (“B” arrow in Fig. 7). The d decrease observed when the PBL collapses, during sunset, corresponds to the weakening of surface evap-oration, and to an increasing proportion of a more regional
atmosphere. The night-time δvevolves closer to the meteoric
water line, compared to daytime compositions. The progres-sive condensation occurring between 20:00 and 05:00 UTC
maintains the δv along a regression line roughly parallel to
the LMWL (“C” arrow in Fig. 7).
The stronger advection rate which prevails under North Atlantic conditions, and which smoothed the diurnal
ampli-tude of δvvariation, suggests that the higher d signature of
water vapour (Table 5) results from the combined influences of higher d in the locally evaporated vapour and in the re-gional vapour, consistently with the longer continental tra-jectory. A more precise determination of the regional vapour isotopic composition would rely on the quantification of ad-vection fluxes and on a full PBL mass balance estimate.
5 Conclusion
Our results show that both local and regional isotopic signa-tures are recorded in the ground level atmospheric vapour composition, and that a sub-daily analysis is necessary to decipher these influences. After having classified the data according to air mass origins and trajectories, we found strong diurnal variations of d, with lower amplitude
varia-tions under the influence of northern air masses than under Mediterranean influences. The higher average d observed un-der northern conditions (23.2 ‰ compared to 18.6 ‰ for the Mediterranean situations) is mainly due to higher nocturnal values, while the daytime maxima are similar. However, the drivers of these diurnal variations have to be understood to interpret the isotopic signal with respect to its relevant spa-tiotemporal scales, and it is essential to understand and
com-pare the behaviour of both δ18O and δD (referred to as δv) to
understand d.
A diurnal increase in d can be caused by entrainment of free atmospheric air, by surface evaporation, or by a com-bination of both processes. Unlike evaporation, the contri-bution of free atmospheric air would induce a decrease in absolute vapour concentration. Therefore, our average daily cycles clearly indicate that the diurnal increase in d is es-sentially driven by local evaporation. Based on the robust
alignment of average hourly data in a δvvs. 1/q plot for the
q-increase period of the day, we applied a two-component
mixing model to estimate the composition of locally
evapo-rated vapour (δE). Then, since regional advection modulates
the amplitude of diurnal δvvariations, we discussed the
two-component mixing assumption and evaluate the influence of
a third component on the determination of δE. We show that
it remains low, because the composition of regional advec-tion is expected to be close to the nocturnal values. We found higher d for the locally evaporated vapour under North At-lantic air mass conditions, which is consistent with lower
hu-midity conditions, while the corresponding δ18O
composi-tions are very similar between the two meteorological situa-tions, with a difference of about 0.7 ‰.
In contrast, there is an important difference in the δ18O
compositions between the two meteorological situations when considering the nocturnal values. More specifically, it is interesting to consider the ambient vapour composition measured at 20:00 UTC when the PBL collapses, and be-fore the progressive influence of dew formation during the night. This 20:00 UTC composition is the least influenced by locally evaporated vapour, and the most representative of
a regional signal. The difference in δ18O between the two
main meteorological situations (upper than 3 ‰) reflects the influence of synoptic and mesoscale weather conditions, re-lated to air mass origin and trajectory. Strong, cold and dry winds coming from the north bring an isotopically depleted vapour. Conversely, light, warm and wet winds coming from the south bring an isotopically enriched vapour. In addition, the strong advection rate that prevails under North Atlantic conditions suggests that, in this situation, the high average d of water vapour at 20:00 UTC also reflects the signature of regional vapour.
In general, our data showed that the mixing ratio is a bet-ter predictor of deubet-terium excess variations than relative hu-midity, at both daily and sub-daily time scales, since mix-ing processes between different vapour sources weakened the relevance of relative humidity as an indicator of evaporation
conditions. At the daily time step, the mixing ratio is a proxy for the air mass origin, since there is a huge contrast between water content of northern and Mediterranean air masses. At
the sub-daily time step, a δv–q correlation, and subsequently
a d–q correlation, during the q-increase period of the day, results from the addition of locally evaporated vapour. The general framework proposed in this study, for typical daily cycles of water vapour isotopic composition under different meteorological conditions, could be used in further quantita-tive analyses of vapour sources during specific days.
Acknowledgements. This work was performed in the framework
of Hélène Delattre’s PhD. It was supported by CNRS-INSU (EC2CO-VISOTOP project, and contribution to the thesis grant), by “Region PACA” (contribution to the thesis grant, and to the Picarro instrument), by the Fédération de Recherche ECCOREV (contribution to the Picarro instrument and Eau-Trace project). We thank the “Réserve Nationale de Camargue” warmly for having welcomed our experiments and contributing to the sampling. We are grateful to the anonymous referees for their detailed and constructive comments, which have contributed to significantly improve this manuscript.
Edited by: H. Wernli
References
Aemisegger, F., Sturm, P., Graf, P., Sodemann, H., Pfahl, S., Knohl, A., and Wernli, H.: Measuring variations of δ18O and δ2H in at-mospheric water vapour using two commercial laser-based spec-trometers: an instrument characterisation study, Atmos. Meas. Tech., 5, 1491–1511, doi:10.5194/amt-5-1491-2012, 2012. Aemisegger, F., Pfahl, S., Sodemann, H., Lehner, I., Seneviratne, S.
I., and Wernli, H.: Deuterium excess as a proxy for continental moisture recycling and plant transpiration, Atmos. Chem. Phys., 14, 4029–4054, doi:10.5194/acp-14-4029-2014, 2014.
Angert, A., Lee, J.-E., and Yakir, D.: Seasonal variations in the isotopic composition of near-surface water vapour in the east-ern Mediterranean, Tellus B, 60, 674–684, doi:10.1111/j.1600-0889.2008.00357.x, 2008.
Armengaud, A., Koster, R. D., Jouzel, J., and Ciais, P.: Deuterium excess in Greenland snow: Analysis with simple and complex models, J. Geophys. Res., 103, 8947–8953, 1998.
Bailey, A., Toohey, D., and Noone, D.: Characterizing moisture exchange between the Hawaiian convective boundary layer and free troposphere using stable isotopes in water, J. Geophys. Res.-Atmos., 118, 8208–8221, doi:10.1002/jgrd.50639, 2013. Bastrikov, V., Steen-Larsen, H. C., Masson-Delmotte, V.,
Grib-anov, K., Cattani, O., Jouzel, J., and Zakharov, V.: Continuous measurements of atmospheric water vapour isotopes in west-ern Siberia (Kourovka), Atmos. Meas. Tech., 7, 1763–1776, doi:10.5194/amt-7-1763-2014, 2014.
Berkelhammer, M., Hu, J., Bailey, A., Noone, D. C., Still, C. J., Barnard, H., Gochis, D., Hsiao, G. S., Rahn, T., and Turnipseed, A.: The nocturnal water cycle in an open-canopy forest, J. Geo-phys. Res.-Atmos., 118, 10225–10242, doi:10.1002/jgrd.50701, 2013.
Boucher, O., Myhre, G., and Myhre, A.: Direct human influence of irrigation on atmospheric water vapour and climate, Clim. Dy-nam., 22, 597–603, doi:10.1007/s00382-004-0402-4, 2004. Brubaker, K. L., Entekhabi, D., and Eagleson, P. S.: Estimation of
Continental Precipitation Recycling, J. Climate, 6, 1077–1089, 1993.
Brutsaert, W.: Indications of increasing land surface evaporation during the second half of the 20th century, Geophys. Res. Lett., 33, L20403, doi:10.1029/2006GL027532, 2006.
Celle, H., Daniel, M., Mudry, J., and Blavoux, B: Signal pluie et traçage par les isotopes stables en Méditerranée occidentale. Ex-emple de la région avignonnaise (Sud-Est de la France), C. R. Acad. Sci. Paris, Earth Planet. Sci., 331, 647–650, 2000. Celle-Jeanton, H., Travi, Y., and Blavoux, B.: Isotopic typology of
the precipitation in the Western Mediterranean region at three different time scales, Geophys. Res. Lett., 28, 1215–1218, 2001. Craig, H. and Gordon, L. I.: Deuterium and oxygen 18 variations in the ocean and the marine atmosphere, in: Stable Isotopes in Oceanographic Studies and Paleotemperatures, edited by: Ton-giorgi, E., p. 9–130, Spoleto, Italy, 1965.
Dai, A., Qian, T., Trenberth, K. E., and Milliman, J. D.: Changes in Continental Freshwater Discharge from 1948 to 2004, J. Climate, 22, 2773–2792, doi:10.1175/2008JCLI2592.1, 2009.
Dansgaard, W.: Stable isotopes in precipitation, Tellus, 16, 436– 468, 1964.
Destouni, G., Asokan, S. M., and Jarsjö, J.: Inland hydro-climatic interaction: Effects of human water use on regional climate, Geophys. Res. Lett., 37, L184402, doi:10.1029/2010GL044153, 2010.
Eltahir, E. A. B. and Bras, R. L.: Precipitation recycling, Rev. Geo-phys., 34, 367–378, 1996.
Farlin, J., Lai, C.-T., and Yoshimura, K.: Influence of synoptic weather events on the isotopic composition of atmospheric mois-ture in a coastal city of the western United States, Water Resour. Res., 49, 3685–3696, doi:10.1002/wrcr.20305, 2013.
Fu, G., Charles, S. P., and Yu, J.: A critical overview of pan evapo-ration trends over the last 50 years, Clim. Change, 97, 193–214, doi:10.1007/s10584-009-9579-1, 2009.
Galewsky, J., Rella, C., Sharp, Z., Samuels, K., and Ward, D.: Sur-face measurements of upper tropospheric water vapor isotopic composition on the Chajnantor Plateau, Chile, Geophys. Res. Lett., 38, L17803, doi:10.1029/2011GL048557, 2011.
Gat, J. R.: Oxygen and hydrogen isotopes in the hydrologic cycle, Annu. Rev. Earth Planet. Sci., 24, 225–262, 1996.
Gat, J. R.: Atmospheric water balance – the isotopic perspective, Hydrol. Processes, 14, 1357–1369, 2000.
Gat, J. R. and Matsui, E.: Atmospheric water balance in the Amazon basin: an isotopic evapotranspiration model, J. Geophys. Res., 96, 13179–13188, 1991.
Gat, J. R., Bowser, C. J., and Kendall, C.: The contribution of evap-oration from the Great Lakes to the continental atmsophere: esti-mate based on stable isotope data, Geophys. Res. Lett., 21, 557– 560, 1994.
Gat, J. R., Shemesh, A., Tziperman, E., Hecht, A., Georgopoulos, D., and Basturk, O.: The stable isotope composition of waters of the eastern Mediterranean Sea, J. Geophys. Res., 101, 6441– 6451, 1996.
Gibson, J. J., Birks, S. J., and Edwards, T. W. D.: Global pre-diction of δA and δ2H-δ18O evaporation slopes for lakes and
soil water accounting for seasonality, Tellus, 16, 436–468, doi:10.1111/j.2153-3490.1964.tb00181.x, 2008.
Gonfiantini, R.: Environmental isotopes in lake studies, in: Hand-book of Environmental Isotope geochemistry, 2, edited by: Fritz, P. and Fontes, J. C., Elsevier, Amsterdam, 113–163, 1986. Griffis, T. J.: Tracing the flow of carbon dioxide and water vapor
be-tween the biosphere and atmosphere: A review of optical isotope techniques and their application, Agric. For. Meteorol., 174–175, 85–109, doi:10.1016/j.agrformet.2013.02.009, 2013.
Griffis, T. J., Lee, X., Baker, J. M., Billmark, K., Schultz, N., Erick-son, M., Zhang, X., Fassbinder, J., Xiao, W., and Hu, N.: Oxygen isotope composition of evapotranspiration and its relation to C4 photosynthetic discrimination, J. Geophys. Res., 116, G01035, doi:10.1029/2010JG001514, 2011.
Gupta, P., Noone, D., Galewsky, J., Sweeney, C., and Vaughn, B. H.: Demonstration of high-precision continuous measurements of water vapor isotopologues in laboratory and remote field deploy-ments using wavelength-scanned cavity ring-down spectroscopy (WS-CRDS) technology, Rapid Commun. Mass Spectrom., 23, 2534–2542, doi:10.1002/rcm.4100, 2009.
He, H. and Smith, R. B.: Stable isotope composition of water va-por in the atmospheric boundary layer above the forests of New England, J. Geophys. Res., 104, 11657–11673, 1999.
IAEA: Reference Sheet for International Measurement Standards, 5 p., issued 5 May 2009, available at: https://nucleus.iaea.org/rpst/ documents/vsmow2_slap2.pdf (last access: 10 September 2015), 2009.
Iannone, R. Q., Romanini, D., Cattani, O., Meijer, H. A. J., and Kerstel, E. R. Th.: Water isotope ratio (δ2H and δ18O) measure-ments in atmospheric moisture using an optical feedback cavity enhanced absorption laser spectrometer, J. Geophys. Res., 115, D10111, doi:10.1029/2009JD012895, 2010.
Jacob, H. and Sonntag, C.: An 8-year record of the seasonal varia-tion of2H and18O in atmospheric water vapour and precipitation at Heidelberg, Germany, Tellus B, 43, 291–300, 1991.
Johnson, L. R., Sharp, Z. D., Galewsky, J., Strong, M., Van Pelt, A. D., Dong, F., and Noone, D.: Hydrogen isotope correction for laser instrument measurement bias at low water vapor concentra-tion using convenconcentra-tional isotope analyses: applicaconcentra-tion to measure-ments from Mauna Loa Observatory, Hawaii, Rapid Commun. Mass Spectrom., 25, 608–616, doi:10.1002/rcm.4894, 2011. Jouzel, J., Alley, R. B., Cuffey, K. M., Dansgaard, W., Grootes, P.,
Hoffmann, G., Johnsen, S. J., Koster, R. D., Peel, D., Shuman, C. A., Stievenard, M., Stuiver, M., and White, J.: Validity of the temperature reconstruction from water isotopes in ice cores, J. Geophys. Res., 102, 26471–26487, 1997.
Jouzel, J., Delaygue, G., Landais, A., Masson-Delmotte, V., Risi, C., and Vimeux, F.: Water isotopes as tools to document oceanic sources of precipitation, Water Resour. Res., 49, 7469–7486, doi:10.1002/2013WR013508, 2013.
Jung, M., Reichstein, M., Ciais, P., Seneviratne, S. I., Sheffield, J., Goulden, M. L., Bonan, G., Cescatti, A., Chen, J., de Jeu, R., Dolman, A. J., Eugster, W., Gerten, D., Gianelle, D., Gobron, N., Heinke, J., Kimball, J., Law, B. E., Mon-tagnani, L., Mu, Q., Mueller, B., Oleson, K., Papale, D., Richardson, A. D., Roupsard, O., Running, S., Tomelleri, E., Viovy, N., Weber, U., Williams, C., Wood, E., Zaehle, S., and Zhang, K.: Recent decline in the global land
evapotranspira-tion trend due to limited moisture supply, Nature, 467, 951–954, doi:10.1038/nature09396, 2010.
Keeling, C. D.: The concentration and isotopic abundances of at-mospheric carbon dioxide in rural areas, Geochim. Cosmochim. Acta, 13, 322–334, 1958.
Kerstel, E. and Gianfrani, L.: Advances in laser-based isotope ratio measurements: selected applications, Appl. Phys. B-Lasers O., 92, 439–449, 2008.
Kurita, N., Newman, B. D., Araguas-Araguas, L. J., and Aggar-wal, P.: Evaluation of continuous water vapor δD and δ18O mea-surements by off-axis integrated cavity output spectroscopy, At-mos. Meas. Tech., 5, 2069–2080, doi:10.5194/amt-5-2069-2012, 2012.
Lai, C.-T. and Ehleringer, J. R.: Deuterium excess reveals diurnal sources of water vapor in forest air, Oecologia, 165, 213–223, doi:10.1007/s00442-010-1721-2, 2011.
Lai, C.-T., Ehleringer, J. R., Bond, B. J., and Paw U, K. T.: Con-tributions of evaporation, isotopic non-steady state transpiration and atmospheric mixing on the δ18O of water vapour in Pacific Northwest coniferous forests, Plant, Cell Environ., 29, 77–94, 2006.
Lee, X., Smith, R., and Williams, J.: Water vapour18O/16O isotope ratio in surface air in New England, USA, Tellus B, 58, 293–304, doi:10.1111/j.1600-0889.2006.00191.x, 2006.
Lee, X., Huang, J., and Patton, E. G.: A Large-Eddy Simulation Study of Water Vapour and Carbon Dioxide Isotopes in the At-mospheric Boundary Layer, Bound.-Lay. Meteorol., 145, 229– 248, doi:10.1007/s10546-011-9631-3, 2012.
Medeiros, B., Hall, A., and Stevens, B.: What Controls the Mean Depth of the PBL?, J. Climate, 18, 3157–3172, 2005.
Merlivat, L. and Jouzel, J.: Global Climatic Interpretation of the Deuterium-Oxygen 18 Relationship for Precipitation, J. Geo-phys. Res., 84, 5029–5033, 1979.
Monteith, J. L.: Evaporation and environment, Symposia of the So-ciety for Experimental Biology, 19, 205–224, 1965.
Noone, D.: Pairing Measurements of the Water Vapor Isotope Ratio with Humidity to Deduce Atmospheric Moistening and Dehydra-tion in the Tropical Midtroposphere, J. Climate, 25, 4476–4494, doi:10.1175/JCLI-D-11-00582.1, 2012.
Noone, D., Galewsky, J., Sharp, Z. D., Worden, J., Barnes, J., Baer, D., Bailey, A., Brown, D. P., Christensen, L., Crosson, E., Dong, F., Hurley, J. V., Johnson, L. R., Strong, M., Toohey, D., Van Pelt, A., and Wright, J. S.: Properties of air mass mixing and humidity in the subtropics from measurements of the D/H isotope ratio of water vapor at the Mauna Loa Observatory, J. Geophys. Res., 116, D22113, doi:10.1029/2011JD015773, 2011.
Noone, D., Risi, C., Bailey, A., Berkelhammer, M., Brown, D. P., Buenning, N., Gregory, S., Nusbaumer, J., Schneider, D., Sykes, J., Vanderwende, B., Wong, J., Meillier, Y., and Wolfe, D.: De-termining water sources in the boundary layer from tall tower profiles of water vapor and surface water isotope ratios after a snowstorm in Colorado, Atmos. Chem. Phys., 13, 1607–1623, doi:10.5194/acp-13-1607-2013, 2013.
Ohmura, A. and Wild, M.: Is the Hydrological Cycle Accelerating?, Science, 298, 1345–1346, doi:10.1126/science.1078972, 2002. Pfahl, S. and Wernli, H.: Air parcel trajectory analysis of stable
iso-topes in water vapor in the eastern Mediterranean, J. Geophys. Res., 113, D20104, doi:10.1029/2008JD009839, 2008.