HAL Id: hal-01992320
https://hal.archives-ouvertes.fr/hal-01992320
Submitted on 24 Jan 2019
HAL is a multi-disciplinary open access
archive for the deposit and dissemination of sci-entific research documents, whether they are pub-lished or not. The documents may come from teaching and research institutions in France or abroad, or from public or private research centers.
L’archive ouverte pluridisciplinaire HAL, est destinée au dépôt et à la diffusion de documents scientifiques de niveau recherche, publiés ou non, émanant des établissements d’enseignement et de recherche français ou étrangers, des laboratoires publics ou privés.
Influence of Microstructure and Surface Roughness on
Oxidation Kinetics at 500–600 °C of Ti–6Al–4V Alloy
Fabricated by Additive Manufacturing
Antoine Casadebaigt, Jonathan Hugues, Daniel Monceau
To cite this version:
Antoine Casadebaigt, Jonathan Hugues, Daniel Monceau. Influence of Microstructure and Surface Roughness on Oxidation Kinetics at 500–600 °C of Ti–6Al–4V Alloy Fabricated by Additive Manufac-turing. Oxidation of Metals, Springer Verlag, 2018, 90 (5-6), pp.633-648. �10.1007/s11085-018-9859-0�. �hal-01992320�
OATAO is an open access repository that collects the work of Toulouse
researchers and makes it freely available over the web where possible
Any correspondence concerning this service should be sent
to the repository administrator:
tech-oatao@listes-diff.inp-toulouse.fr
This is an author’s version published in: http://oatao.univ-toulouse.fr/21418
To cite this version:
Casadebaigt, Antoine
and Hugues, Jonathan and Monceau, Daniel
Influence
of Microstructure and Surface Roughness on Oxidation Kinetics at 500–600 °C
of Ti–6Al–4V Alloy Fabricated by Additive Manufacturing. (2018) Oxidation of
Metals, 90 (5-6). 633-648. ISSN 0030-770X
https:/ /doi.org/10.1007 /s 11085-018-9859-0
Influence of Microstructure and Surface Roughness
on Oxidation Kinetics at 500-600 °C ofTi-6Al-4V Alloy
Fabricated by Additive Manufacturing
Antoine Casadebaigt 1,2 • Jonathan Hugues 1 • Daniel Monceau2
Abstract
Ti-6Al-4V alloy (TA6V) is the most commonly used titanium-based alloy and is usually manufactured by casting, forging or rolling. Additive manufacturing is a new way of processing metal alloys; it is currently used for production purposes. This study focuses on the microstructure and oxidation kinetics of Ti-6Al-4V fab ricated by laser beam melting. Sorne samples were HIP-treated (hot isostatic pres sure). Ti-6Al-4V rolled and annealed was used as a reference material. Ti-6Al-4V fabricated by LBM exhibited prior p grains elongated in the building direction with fully acicular martensite, a'. Isothermal oxidations were performed at 500, 550 and 600
°C for durations of 100, 200 and 500 h. The oxidation kinetics followed a parabolic law. The weight gain of as-built LBM samples was twice as high as that of ground LBM samples of Ti-6Al-4V, although both sets had the same oxide layer thickness and depth of oxygen diffusion in the alloy. Ground LBM samples presented an oxidation rate close to that of conventional rolled and annealed Ti-6Al-4V alloys. It was shown the higher weight gain of LBM-produced Ti-6Al-4V samples was mainly due to their higher specific area and to the oxidation of partially melted powder on their surface.
l8J Antoine Casadebaigt
antoine. casadebaigt@ensiacet.fr
1 IRT Saint Exnpéry, 3 rue Tarfaya, 31405 Toulonse Cedex 4, France
2 CIRIMAT, CNRS, INPT, UPS, ENSIACET, Université de Toulouse, 4 allée Emile Monso, BP-44362, 31030 Toulouse Cedex 4, France
Graphical Abstract
As-built Laser Bearn Melted (LBM) surface state
4.0 lS ,:--3,0 52.5 ]'. 2.0 -� 1.5 i1.o � 0.5 0.0
Ti-6Al-4V alloys oxidized at 600°C
0
• As-bt1ilt LBM • LBM gro und rGOO x Powder
10 15 20 25
Squ�r(' rôôt of tirne (h?/2)
As-built LBM oxidized 500h at 600°C
Keywords SLM · TA6V · Oxidation · Titanium · High temperature · Additive
manufacturing
Introduction
Titanium alloys are widely used in aeronautic applications due to their good density specific mechanical properties and aqueous corrosion resistance. However, applica tions for titanium alloys are often limited to temperatures below 550 °C, e.g. 400 °C for Ti-6Al-4V (wt%) [1]. This is due to the relatively fast rate of external oxide layer (OL) growth at high temperature and more importantly to the very high oxy gen solubility in the metal. This high oxygen solubility leads to an oxygen diffusion zone (ODZ) beneath the external oxide scale provoking a loss of ductility [2, 3]. Ti-6Al-4V represents nearly 60% of titanium alloys produced [1] and is frequently used injet-engine components and aircraft structural components [4].
Laser beam melting (LBM) also named selective laser melting (SLM) is one of the additive manufacturing processes that emerged in the late 1980s and early 1990s [5]. The process bas been widely described in the literature [6-8]. This technique enables the manufacturing of nearly dense metal parts with complex geometries and is currently under development for mass production [9-12]. The layer-by-layer pro cess of the LBM allows the manufacturing of complex geometry parts, which are
impossible to build with more conventional manufacturing processes such as forging or casting [13]. Moreover, hot working and machining used in traditional processes result in a high buy-to-fly ratio-defined as the mass of raw material purchased to manufacture a part compared to the final part's mass in flight-e.g. the mid-fuselage bulkhead of the USF-22 [14]. LBM process reduces the amount of wasted matter compared to machining processes.
Most reports involving titanium alloys fabricated by LBM concentrate on micro structure and mechanical properties [9, 11, 12, 15-18]. Up to now, no study has focused on high-temperature oxidation behaviour of LBM-produced Ti-6Al-4V alloy. A single study discussing the high-temperature oxidation behaviour of a tita nium alloy (Ti-5.5Al-3.4Sn-3.0Zr-0.7Mo--0.3Si-0.4Nb-0.35Ta wt%) fabricated by LBM could be found in the open literature [ 19]. The microstructure of this titanium alloy fabricated by LBM was an acicular martensitic a' phase with 0.5-µm-wide
laths, and its oxidation resistance was higher than that of the as-casted alloy. But the mechanisms of oxidation and the kinetics data were poorly described. In the following paper, the effects of the specific microstructure and surface of as-built LBM samples and the high-temperature oxidation behaviour of the titanium alloy Ti-6Al-4V fabricated by LBM have been studied and compared to Ti-6Al-4V fab ricated by conventional rolling. Moreover, influence of hot isostatic pressure, HIP, treatrnent on the microstructure and oxidation behaviour of Ti-6Al-4V fabricated by LBM has been investigated.
Experimental Procedures
Ti-6Al-4V alloy samples were produced by LBM using an EOS M280 machine equipped with an Yb-fibre laser working at a wavelength between 1060 and 1100 µm. The LBM was processed under argon atrnosphere to limit thermal oxida tion. Process parameters were optimized to obtain fully dense parts. The powder used, supplied by AP&C, was plasma atomized Ti-6Al-4V with a particles size of 15-45 µm and was recycled 21 times before the making of our samples. The chem ical composition of the unused powder according to ASTM B348 is presented in Table 1.
Tablel Chemical composition of Ti-6Al--4V alloys (Al, V and Fe measured by ICP-OES; C, N, 0, S
and H measured by IGA)
Al V C 0 N H Fe Other Ti
Unused LBM powder (wt%) 6.5 3.9 0.02 0.12 0.02 0.0023 0.19 <0.4 Bal
Unused LBM powder (at.%) 10.97 3.48 0.08 0.34 0.06 0.10 0.15 Bal
LBM sample (wt%) 6.4 4.0 0.16 0.0048 0.21 <0.4 Bal
LBM sample (at.%) 10.8 3.6 0.46 0.22 0.17 Bal
Rolled sample (wt%) 6.41 3.93 0.004 0.18 0.008 0.0039 0.16 <0.4 Bal
Sorne of the samples were HIP-treated after LBM to reduce residual poros ity thereby improving structural integrity. A rolled Ti-6Al-4V annealed above the
a ➔ p phase transformation temperature, Tp=980 °
C, was used as the reference material [20].
Spherical Ti-6Al-4V powder produced by AP&C with a particle size between 15 and 45 µm and 0.10--0.12 wt% of oxygen content according to standard ASTM E1409 was used for oxidation study.
Examination of the microstructure was done after samples were ground with SiC abrasive paper of P2400 grit size and polished with SiO2 solution. To reveal the microstructure, samples were etched in a solution of 100 ml of water, 2 ml of HF (75%) and 4 ml ofHNO3 (65%). Two cross sections were examined to study the ani
sotropy of the microstructure. One is the plane parallel to the building direction, and the other one is the plane perpendicular to the building direction. Micrographs were taken using Wild M420 binocular microscope and Nikon ECLIPSE MA200 optical microscope (OM). FEI Quanta 450 and LEO 435 VP scanning electron microscopes (SEM) were used at 15 kV for high-magnification micrographs. Chemical compo sition was measured by inductively coupled plasma-optical emission spectrometry (ICP-OES), instrumental gas analysis (IGA) and inert gas fusion (IGF). Phases were identified by X-ray diffraction (XRD) at room temperature with a Bruker D8-2 using Cu-Ka radiation in the 20 range from 20° to 80° with a step size of 0.02° and a scan step time of 2 s. The relative density was measured using the Archimedes method. An average of three measurements was taken for each sample.
Nine samples were fabricated by LBM in net shape with dimensions of 15x10x2 mm3• Three samples were kept in as-built LBM conditions, three sam ples were ground to a P600-grit finish (LBM P600), and three samples were HIP treated and ground to a P600-grit finish (HIP P600). Three additional samples rolled and annealed above Tp were added as references materials and were also ground to
a P600-grit finish (Rolled P600). Grinding was carried out to assess the influence of metallurgical state on oxidation behaviour, independently of the effect of surface roughness of as-built LBM samples.
Ti-6Al-4V samples were inserted in a pre-heated Carbolite furnace LHT 6/60 with forced convection. An opening, which allowed atmosphere renewal, was pre sent in the top wall of the furnace. Oxidations were performed at 500, 550 and 600 °C, for 500 h and cooled at room temperature. Sample weights were measured before and after oxidation using a Sartorius® LA 75 3200D balance with an accu racy of ± 20 µg. For each of the 12 samples, weight gain values were averaged on three measurements for every oxidation condition. The samples oxidized during 500 h were prepared for microstructure characterization. Ti-6Al-4V powder was both oxidized in a SETARAM TAG24 s thermobalance at 600 °C for 100 h and in the pre-heated Carbolite furnace LHT 6/60 with forced convection at 600 °C for 300 h to study the oxidation kinetics of the powder. A mass of 7 mg of powder was used.
The thickness of the oxide layer of oxidized samples was assessed by optical microscopy measurement. For each sample, 20 images of cross sections were per formed. For each image, 50 punctual measurements of oxide layer thickness were taken along the image. For each sample, oxide layer thickness corresponds to the
mean value out of these 1000 punctual measures. Oxygen concentration profiles were measured by electron probe microanalyzer (EPMA) with a CAMECA SXFive microprobe operating at 15 kV and 20 nA. Two profiles were performed on each tested sample with a standard deviation of 6000 ppm on oxygen concentration meas urement. Moreover, EPMA results were corrected by removing the oxygen concen tration corresponding to the non-heat-treated zone and the oxygen contamination on the surface of the sample. Oxide layers were assayed using XRD-20 range from 20° to 80°, step size of 0.04 °, scan step time of 6 s-and energy-dispersive analysis (EDS).
Results and Discussion
Microstructure Characterization
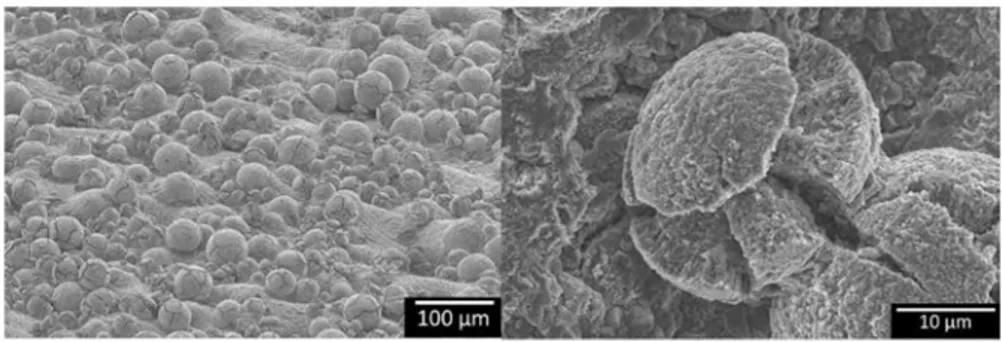
Figure 1 shows the surface state of Ti-6Al-4V samples fabricated by LBM. Sorne powder grains have been partially melted and remain on the surface of the sample, thereby increasing its roughness and specific area. The relative density of samples measured using the Archimedes method is 99.5%. Sample density was determined relatively to the theoretical Ti-6Al-4V density value of 4.43 g cm-3 [21]. Two kinds of pores are observed in the microstructure. Figure 2a, b presents large and non spherical pores of 10--50 µm located at 100 µm under the surface, and small and spherical pores of 2-3 µm all over the bulk.
LBM alloy microstructure was characterized before and after HIP treat ment and compared to conventional alloy microstructure obtained after roll ing and annealing treatment in the p field. Figure 2 shows the microstructure of Ti-6Al-4V produced by LBM. Figure la, c, respectively, presents a view perpen dicular (XY plane) and parallel (XZ plane) to the building direction, defined as the
Z axis. The XZ plane indicates that prior p grains (130 ± 20 µm in width) grew
Non spherical pore 10- 50 µm X. Building direction z
@-,
Fig. 2 Optical and high-resolution metallographic views of Ti-6Al--4V alloys fabricated by LBM. a prior � grain perpendicular to the building direction, b macroscopic and microscopie porosities, c elon gated prior � grain parallel to the building direction and d acicular a' martensite
epitaxially during the process (up to 748 ± 244 µm in length) along the building direction due to the direction of the thermal gradient. In the XY plane, the laser scanning strategy is visible with a shift between subsequent layers. Prior p grains appeared as squares of 130 ± 30 µm in width. Figures 2b, d and 3a, respectively, show a higher magnification micrograph, a dark field optical micrograph and a bright field optical micrograph showing fully acicular a' martensitic microstruc
ture. This microstructure was found for alloy Ti-6Al-4V built by LBM [15] due to a high cooling rate, estimated around 105 K s-1 [22]. The average width of
laths obtained by the method ofintercepts is (640± 130) nm.
The X-ray diffraction pattern in Fig. 4 indicates the presence of an hexagonal phase corresponding to the martensitic phase a', but does not indicate the pres
ence of P-phase.
Fig. 3 Optical metallographic views of Ti-6Al--4V alloys fabricated by LBM before HIP treatment (a), fabricated by LBM after HIP treatment (b) and rolled and annealed ( c)
2.5 2 1.5 { 100) a(a')
.€
1 ] 0.5 {100) Cl 0 34 35 36 {002} a(o') {002) 0 37 38 39 20 (deg) {101} a(a') 40 Laser Beam Melling Laser Beam Mclting + HIP 41 42Fig. 4 X-ray diffraction pattern of Ti-6Al-4V fabricated by LBM before and after HIP treatment
Figure 3b shows the microstructure of a sample fabricated by LBM- and HIP treated. HIP treatment at 920 °C under 1000 bar for 2 h in argon atmosphere with a cooling rate of 4 K min-1 induced the decomposition of acicular a' martensitic
laths into a a+
fJ
lamellar structure with a laths of 2 ± 0.5 µm wide surrounded by /J matrix. HIP treatment allowed closing the large and non-spherical pores. XRD anal ysis in Fig. 4 confirmed the presence of /J-phase. Figure 3c shows the a+/J lamel lar Widmanstatten-like microstructure of the reference material fabricated by rolling followed by an annealing treatrnent in the /J field and either an air cooling or a fur nace cooling [ 4].Oxidation Behaviour
Figure 5 indicates weight gains of samples after exposure to air at 500, 550 and 600 °C of Ti-6Al-4V alloys with different metallurgical and surface states. Each specimen's weight gain was divided by its specific surface area; values are expressed in mg/cm2• The weight gain value of the Rolled P600 sample oxidized for 500 h at
600 °C is not included in Fig. 5c, and the weight gain value of the LBM P600 sam ple oxidized for 500 h at 600 °C was underestimated, both due to the spalling of the oxide layer. Figure 5a shows that weight gains of Ti-6Al-4V alloy at 500 °C are very low, and error bars show the difficulty of measuring weight gain before 500 h of oxidation due to very low weight gain values and to balance accuracy of ± 20 µg.
After 500 h of oxidation at 500, 550 and 600 °C, LBM P600 and Rolled P600 samples present a similar weight gain, as depicted in Fig. 5a--c. The metallurgical state of LBM samples exhibits oxidation kinetics similar to the rolled Ti-6Al-4V alloy used as reference material. However, HIP P600 samples present the low est weight gain after 500 h of oxidation at every temperature. This could be due to the formation of a partially protective alumina diffusion barrier. However, this
Fig. 5 Variation of normalized weight gain (�W /A) at 500 °C (a), 550 °C (b) and 600 °C (c) as a function of oxidation time (t) depending on surface and metallurgical state of Ti---6Al-4V alloys (a) 0.09 0.08 N 0.07
E
u 0.06 110.s
·=
0.05 0.04...
0.03 .!!? 0.02 3: 0.01 0.00 (b) o.6 0.5..
E
0.4 u 0.3 'èij 110 0.2 0.1 0.0 0 0 • As-built LBM •HIP P600 .a. LBM P600 •Rolled P600 10 20Square root of time (h112) ■ As-built LBM .a. LBM P600 •HIP P600 •Rolled P600
+
;
s
10 15 20Square root of time (h112) (c) 4.o • As-built LBM 3.5 .a. LBM PG00 •HIP P600 N 3.0 • Rolled P600 2.5 x Powder C 2.0 ' 'èij 1.5 �
+
'ai 1.0 3:*
0.5 0.0 0 5 10 15 20Square root of time (h112)
+
+
25
+
assmnption could not be addressed in the present work. Moreover, after 500 h of oxidation at 500, 550 and 600 °C, as-built LBM samples present a weight gain two times higher than LBM P600 samples. As shown in Fig. 1, the surface state of as-built LBM samples displays large amounts of partially melted powder parti cles which increase the specific area of the sample. In order to evaluate the effect of these powder particles on the surface of as-built samples, a Ti-6Al-4V powder with the same particle size as the powder on as-built LBM surfaces was oxidized. The amount of partially melted powder on as-built LBM samples was quantified by image analysis of scanning electron micrographs such as the one displayed in Fig. 1. As-built LBM samples present about 60,000 powder particles per cm2 of sample
surface with a diameter of 15-45 µm. Figure 5c shows the oxidation of Ti-6Al-4V powder at 600 °C for 100 h. Weight gains were calculated in proportion to the amount of powder particles present on the surface of as-built LBM samples. After 100 h at 600 °C, the weight gain of as-built LBM sample is close to the sum of the weight gain of the LBM P600 sample and of the Ti-6Al-4V powder. This proves that the higher weight gain of as-built LBM samples is mainly due to the presence of powder at the surface of the samples. These powder grains increase the surface area for oxidation, but they also oxidize faster than a fiat surface, with non-parabolic kinetics as shown in Fig. 5c. Weight gain measurements for the powder oxidized during 100 h at 600 °C in the TAG apparatus showed a linear-like oxidation kinet ics. Sharp et al. [23] reviewed the oxidation kinetics models for powders. They con cluded that oxidation kinetics of a spherical powder can be fitted by different models where the oxidation progress is limited by the diffusion in the reaction product layer at the surface of a spherical particle (D4) or limited by the reaction for a sphere (R3).
In both models, oxidation kinetics of the powder should be, respectively, sub-para bolic or sub-linear because the area for oxidation decreases. Figure 5c presents the oxidation kinetics of Ti-6Al-4V powder in a parabolic plot. It shows that the initial kinetics (first 100 h) is not sub-parabolic, but the kinetics increases from a para bolic rate to a linear rate. This phenomenon could be due to the cracking of powder grains, as observed in Fig. 6. After 500 h of oxidation at 600 °C, almost all oxi dized powder grains are cracked. This was expected because of the anionic growth of TiO2 oxide layer and because of the high value of the Pilling and Bedworth ratio
(PBR= 1.77 for Ti-a and PBR= 1.74 for Ti-/J in pure titanium; PBR= 1.81 for
Ti-a and PBR= 1.89 for Ti-Pin Ti-6Al--4V alloy) between titanium and rutile lat tices. The Pilling and Bedworth ratio (PBR) was calculated by the authors from the crystallographic data for rutile TiO2 and Ti-a and Ti-P phases measured by XRD
(a=2.95 À and c=4.68 À for Ti-a and a=3.30 À for Ti-Pin pure titanium and
a=2.92 À and c=4.67 À for Ti-a and a=3.21 À for Ti-Pin Ti-6Al--4V titanium
alloy). The PBR is equal to the volume of TiO2 formed for each atom of Ti divided
by the volume of a metallic site in the a or p titanium phase. And radial cracks in
the rutile layer give oxygen an easy access to the unreacted core of the particles and
maintain a fast reaction rate.
Figure 5 shows that oxidation kinetics can be approximated with parabolic kinet ics presented in Eq. 1 and the weight gain data can be fitted as:
(1)
where kp is the parabolic rate constant, D. W the weight gain and t the time. A is the surface area of a sarnple calculated from its dimensions. For the powder, the weight gain is given for the quantity of powder present on 1 cm2 of sarnple. Temperature
dependence of the parabolic rate constant can be observed, Fig. 5, as weight gain increases with temperature. Figure 7 shows that kp follows an Arrhenius law Eq. 2:
kp
=
ki · exp ( - :; ) (2) where Ea is the activation energy, R the gas constant and T the reaction temperature.o_ -""-0 -2
_g
-8 -10•
800·c
700·c
--...•
!::::::,._ ·-.. , Ea =252 t ...... kJ/mol ÀGoo·c
500·c
450·c
• Guleryuz, Clmenoglu, 2009(circulating laboratory air)
• Du, Datta, Lewis, Burnell-Gray, 1994 (circulating air environment)
- Gaddam, Sefer, Pederson, Antti 2013
(Amblent air)
■ Frangini, 1994 (synthetic air)
À Poquillon, Armand, Huez, 2013
(amblent and synthetic air) O Ciszak, Papa, Brossard, Monceau,
Chevalier, 2016 (laboratory air) +As-built LBM
:t: LBM P600
x HIP P600
-Rolled P600
Figure 7 indicates parabolic rate constant values (kp) extracted from the litera ture and the present study. kP values from the present study were obtained through the linear regression of�; = f(t112) curves. All kP values from the literature were recalculated from initial weight gain values by fitting \w = f (t112) and forcing the fitting curve to pass through zero. In order to compare only parabolic oxidation rates, weight gain values from Guleryuz [3] above 36 h at 700 °C and the last value at 750 °C were excluded from oxidation kinetics calculations. Experimental results from this study seem to be in good agreement with the literature for oxida tions at 600 °C. However, activation energies (Ea) calculated from the experimen tal results of this study are much higher than the activation energy obtained from literature values obtained at higher temperatures. kp values at 500 °C present large uncertainties, which increases the error of the calculated Ea. The literature survey produces only few data that could allow us to compare our experimental data on Ti-6Al-4V for temperatures lower than 550 °C. Activation energies calculated from our experimental data at low temperatures are much higher than activation energies of oxygen diffusion in rutile (� 250 kJ mo1-1 [24]) and of oxygen diffu sion in titanium (�200-250 kJ mo1-1 [24]). They cannot correspond to the sum of the two phenomena-i.e. external scale formation and oxygen dissolution which should have an activation energy value between 200 and 250 kJ mo1-1.
Therefore, the fact that low-temperature mass gains were found lower than what was expected from the extrapolation of high-temperature values may be the sign that the composition of the external scale differs depending on temperature. We can assume for example that, at low temperatures, it could be enriched in alumina and a diffusion barrier for the diffusion of oxygen in the metal could be present. The very thin scales formed at the lowest temperatures are currently under study.
X-ray diffraction was carried out on as-built LBM sample oxidized for 500 h at 600 °C; results are summarized in Fig. 8a. Peaks of Ti-a phase are visible due to the thin thickness of the oxide layer. The oxide layer of LBM-produced Ti-6Al-4V after 500 h of oxidation at 600 °C is mainly composed of rutile (TiO2) phase. However, some peaks can be identified as a-alumina phase (Al2O3). The EDS cartography, Fig. 8b, confirmed the presence of alumina in the outer oxide layer at the interface between the oxide and the environment [20, 30].
� 1.2 (a) 1101) R � 0.8 .�0.6 � {2-lO) � 0.4 Al.:,01 0.2 0 34 36 u= Ti- u phase (b) R = Rutile (TiO2) Al2O3 = a-alumina (OOZ} {Ill} R (2;0) {IOl)A A1!)1 {200} R a {210} R
--
�
�
... A ...
-38 40 42 44 20 (dcg) 10 µm•
--
-
-
-
10 µm ;. , ..•
-
---
10 µma
lOµmFig. 8 X-ray diffraction pattern (a) and EDS cartography (b) of as-built LBM Ti-6Al--4V oxidized 500 h
Figure 9 shows Rolled P600 and HIP P600 samples oxidized for 500 h at 550 °C. A non-planar oxide layer was found on both samples at the metal/oxide and oxide/ air interfaces. The scanning electron microscopy of the HIP P600 sample oxidized 500 h at 550 °C, Fig. 9c, shows a preferential oxidation appearing between the a-laths, which seem to be in the /3-phase. There is still no explanation for this phe nomenon which was only observed after 500 h at 550 °C.
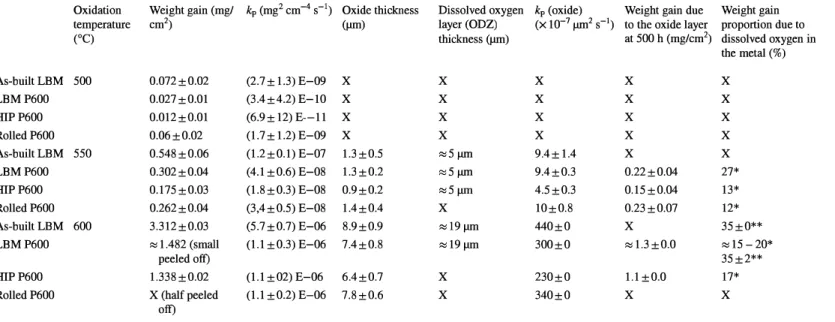
Table 2 summarizes weight gains, parabolic rate constants kp, oxide layer and dissolved oxygen layer thicknesses, oxide layer parabolic rate constant kP(oxide)' cal
culated weight gain due to the oxide layer and weight gain proportion due to dis solved oxygen (% a; ( diss)) in the metal calculated from Eq. 3 and EPMA meas urements. Weight proportion due to dissolved oxygen was already calculated using oxide thickness on Ti-6Al-4V alloy (27%) [27] and with EPMA measurements on Ti6242S alloys (40-46%) [31]. Chaze and Coddet [32] calculated the ratio between the oxygen dissolved in the metallic substrate and the oxygen fixed in the aggregate (between 7 and 49% depending on titanium alloy composition) by means of micro hardness measurements. However, a strong assumption of proportionality between microhardness and oxygen concentration, based on metal-oxide interface oxygen composition, was used.
%�W =[l- T(oxide)
l·lOO=(l-A (diss) LlW
A (total)
(3)
where aw A (oxide) is the weight gain due to the oxide layer (mg cm-2), aw A (diss) is the
weight gain due to dissolved oxygen in the metal (mg cm-2), aw A (total) is the weight gain due to the oxide layer and the dissolved oxygen in the metal (mg cm-2), e0x is
the oxide thickness (cm), M(O) is the oxygen molar mass (g mol-1), M(TiOz) is the
oxide molar mass and P(Tio2) is the oxide density (g cm-3).
The oxide layer at 500 °C was too thin to be measured by optical microscopy. The parabolic rate constant of the Rolled P600 sample oxidized at 600 °C was
MMPl·N
Fig. 9 Optical microscopy of rolled ground P600 (a), HIP ground P600 (b) and scanning electron
Table 2 Weight gains, parabolic rate constants kp, oxide thicknesses, dissolved oxygen thicknesses, oxide layer parabolic rate constants kp (oxide), weight gains due to oxide layer and weight gains proportion due to dissolved oxygen in the metal (*calculated with Eq. 3, **calculated with EPMA) of Ti-6Al-4V alloy oxidized for 500 h at different temperatures Oxidation temperature (OC) As-built LBM 500 LBMP600 HIPP600 Rolled P600 As-built LBM 550 LBMP600 HIPP600 Rolled P600 As-built LBM 600 LBMP600 HIPP600 Rolled P600
Weight gain (mg/ kp (mg2 cm-4 s-1) Oxide thickness
cm2) (µm) 0.072±0.02 (2.7 ± 1.3) E-09 X 0.027±0.01 (3.4±4.2) E-10 X 0.012±0.01 (6.9 ± 12) E--11 X 0.06±0.02 (1.7 ± 1.2) E-09 X 0.548±0.06 (1.2±0.1) E-07 1.3 ±0.5 0.302±0.04 (4.1 ±0.6) E-08 1.3 ±0.2 0.175±0.03 (1.8 ±0.3) E-08 0.9±0.2 0.262±0.04 (3,4±0.5) E-08 1.4±0.4 3.312±0.03 (5.7 ±0.7) E-06 8.9±0.9 ::s 1.482 (small (1.1 ±0.3) E-06 7.4±0.8 peeled off) 1.338±0.02 (1.1 ±02) E-06 6.4±0.7
X (half peeled (1.1 ±0.2) E-06 7.8±0.6
off)
Dissolved oxygen kp (oxide) Weight gain due layer (ODZ) (X 10-7 µm2 s-1) to the oxide layer
thickness (µm) at 500 h (mg/cm2) X X X X X X X X X X X X ::s5µm 9.4± 1.4 X ::s5µm 9.4±0.3 0.22±0.04 ::s5µm 4.5±0.3 0.15 ±0.04 X 10±0.8 0.23±0.07 ::sl9µm 440±0 X ::s19µm 300±0 ::s 1.3 ±0.0 X 230±0 1.1±0.0 X 340±0 X Weight gain proportion due to dissolved oxygen in the metal (%) X X X X X 27* 13* 12* 35 ±0** ::s 15-20* 35±2** 17* X
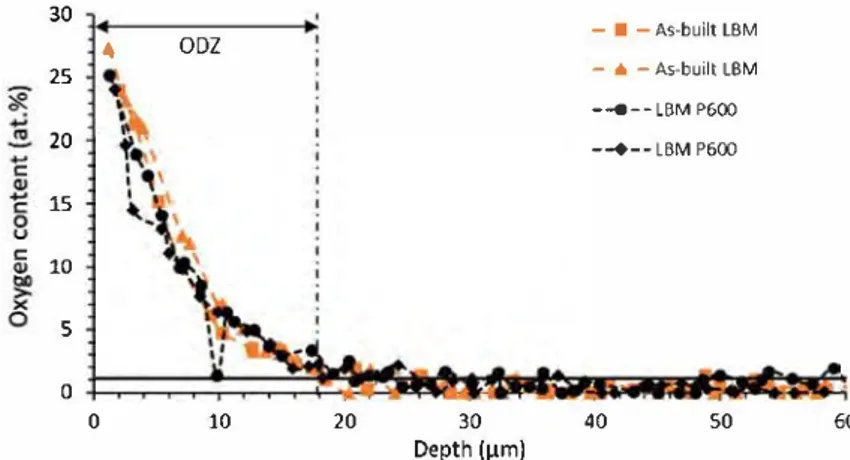
calculated from weight gain values obtained at 100 and 200 h because the sample was peeled off after 500 h of oxidation. Table 2 shows that weight gains, kp, oxide layer and dissolved oxygen layer thicknesses, kP(oxide)' and weight gains due to the oxide layer all increase with temperature. kP(oxide) and weight gains due to the oxide layer were overestimated for LBM P600 and were not calculated for Rolled P600 due to the porosity of the oxide layer and to oxide scale spalling which appeared during cooling at ambient air. After 500 h of oxidation at 550 °C, HIP P600 and Rolled P600 samples present a smaller proportion of weight gain due to dissolved oxygen (from Eq. 3) as compared to the LBM P600 sample. The pres ence of larger a-laths and /J-phase at laths interfaces may explain these results. Moreover, LBM P600 exhibits a higher amount of a-phase, which can dissolve a higher amount of oxygen than the /J-phase. After oxidation at 550 and 600 °C for 500 h, the oxide layer thickness of as-built LBM and LBM P600 samples were similar. As displayed in Fig. 1, the presence of powder grains at the surface of as built LBM samples explains weight gain discrepancies. Finding the same oxide layer thickness on as-built and P600 samples is consistent with this result. Moreo ver, EPMA analysis, Fig. 10, confirmed that the presence of partially melted pow der particles on the surface of as-built samples does not affect the thickness of the ODZ. As-built LBM and LBM P600 samples have the same ODZ thickness of about 20 µrn for 500 h of oxidation at 600 °C. Near the metal/oxide interface, the oxygen concentration measured ranged from 25 to 27 at. % at 1-2 µrn from the interface. These values are below the oxygen solubility of 33.3 at. % in Ti-a phase reviewed by Murray and Wriedt [33]. But, because of the oxygen concen tration gradient, the extrapolations of these EPMA profiles at the interface (x
=
0) are not that far from the equilibrium concentration value. Note that the amount of /J-phase is too low to affect significantly the interfacial oxygen concentration. The presence of alloying elements at the metal/oxide interface may also explain a lower oxygen solubility as compared to that of pure titanium. Microhardness was not used on these samples because ODZ thickness was too low.30 4 25 20 C: 15 C: 10 5 0 0 ODZ 10 20 30 Depth (µm) - ■ -As-built LBM -• -As-built LBM -◄ - - LBM P600 --+--LBM P600 40 50
Fig. 10 EPMA profiles for oxygen in Ti--6Al--4 V oxidized at 600 °C for 500 h in air
Conclusions
This study focused on the isothermal oxidation of Ti-6Al-4V alloy fabricated by laser beam melting allows the following conclusions to be drawn:
1. The microstructure ofTi-6Al-4V fabricated by LBM is composed of columnar prior /3 grains elongated in the building direction and fine martensite a' laths due
to high cooling rate [22]. The decomposition of a' into a lamellar microstructure
within the /3 matrix occurs during HIP treatment.
2. Thermal oxidation of as-built LBM Ti-6Al-4V alloy at 600 °C for 500 h exhibits the formation of an oxide film made of a rutile phase (TiO2) and an a-alumina
phase ( cx-Al2O3) located at the outer scale.
3. Ti-6Al-4V fabricated by LBM and ground P600 presents oxidation kinetics at 500, 550 and 600 °C close to that of Ti-6Al-4V rolled and annealed in the /3 field ground P600.
4. After oxidation at 500, 550 and 600 °C, the oxidation rate of HIP P600 samples is lower than that of LBM P600 and Rolled P600 samples.
5. Rolled P600 and HIP P600 samples oxidized 500 h at 550 °C show a preferential oxidation between the a-laths where the /J-phase is mainly present and a weight gain proportion due to dissolved oxygen lower than that of LBM P600 sample. 6. The surface state of samples fabricated by LBM is wavy, with partially melted
powder grains increasing its specific area. For oxidations performed at 500, 550 and 600 °C, as-built LBM samples present a higher weight gain than ground samples. The difference in weight gain is predominantly due to the oxidation of powder grains located at the surface of as-built LBM samples. Both samples present sirnilar oxide layer thickness and dissolved oxygen layer thickness. Hence,
the surface state of as-built samples increases weight gain but does not increase local oxidation kinetics.
Acknowledgements This work falls within the framework of the Anddnro project hosted by the French
Institute of Technology IRT Saint Exupery, supported by Occitanie Region and industrial partners.
Data Availability The raw/processed data required to reproduce these findings cannot be shared at this time
as the data also form part of an ongoing study.
References
1. R. R. Boyer, MSE A Properties Microstructure and Processing 213, 103 (1996). 2. P. Kofstad, K. Hauffe and H. Kjollesdal, Acta Chemica Scandinavica 12, 239 (1958). 3. H. Guleryuz and H. Cimenoglu, Journal of Alloys and Compounds 472, 241 (2009).
4. G. Lütjering, J. C. Williams, Titanium, 2nd edn., in Engineering Materials and Processes, (Springer, 2007), p. 1 & p. 203. https://doi.org/10.1007/978-3-540-73036-1
5. J. P. Kruth, CIRP Annals 40, 603 (1991).
7. T. Craeghs, S. Clijsters, E. Yasa, F. Bechmann, S. Berumen and J.-P. Kruth, Determination of geometrical factors in layerwise laser melting using optical process monitoring. Optics and
Lasers in Engineering 49, 1440-1446 (2011).
8. C. Van Gestel, Study of Physical Phenomena of Selective Laser Melting Towards Increased Produc
tivity, Ph.D. thesis, Ecole Polytechnique Fédérale de Lausanne, 2015, p. 1.
9. L. E. Murr, S. A. Quinones, S. M. Gaytan, M. 1. Lopez, A. Rodela, E. Y. Martinez, D. H. Hernan dez, E. Martinez, F. Medina and R. B. Wicker, Journal of the Mechanical Behavior of Biomedical
Materials 2, 20 (2009).
10. D. Gu, Y.-C. Hagedorn, W. Meiners, G. Meng, R. J. S. Batista, K. Wissenbach and R. Poprawe, Acta
Materialia 60, 3849 (2012).
11. B. Song, S. Dong, B. Zhang, H. Liao and C. Coddet, Materials & Design 35, 120 (2012). 12. C. Qiu, N. J. E. Adkins and M. M. Attallah, Materials Science and Engineering: A 578, 230 (2013). 13. J. J. Beaman, H. L. Marcus, D. L. Bourell, J. W. Barlow, R. H. Crawford and K. P. McAlea,
Solid Freeform Fabrication: A New Direction in Manufacturing, (Kluwer Academic Publishers,
Dordrecht, 1997), p. 1.
14. M. Peters, J. Kumpfert, C. H. Ward and C. Leyens, Advanced Engineering Materials 5, 419 (2003). 15. L. Thijs, F. Verhaeghe, T. Craeghs, J. V. Humbeeck and J.-P. Kruth, Acta Materialia 58, 3303
(2010).
16. M. Simonelli, Y. Y. Tse, C. Tuck, Further understanding of Ti-6Al-4V selective laser melting using texture analysis, proceedings of the Solid Freeform Fabrication Symposium, Materials (Titaniurn), University of Texas, Austin, August 6-8, 2011, p. 1.
17. B. Vrancken, L. Thijs, J.-P. Kruth and J. Van Humbeeck, Journal of Alloys and Compounds 541, 177 (2012).
18. S. Zhang, Q. Wei, L. Cheng, S. Li and Y. Shi, Materials & Design 63, 185 (2014).
19. Y. Zhou, S. F. Wen, B. Song, X. Zhou, Q. Teng, Q. S. Wei and Y. S. Shi, Materials & Design 89, 1199 (2016).
20. E. Dong, W. Yu, Q. Cai, L. Cheng and J. Shi, Oxidation of Metals 88, 719 (2017).
21. L. E. Murr, S. M. Gaytan, D. A. Ramirez, E. Martinez, J. Hernandez, K. N. Amato, P. W. Shindo, F. R. Medina and R. B. Wicker, Journal of Mate rials Science & Technology 28, 1 (2012).
22. L. Thijs, M. L. Montero Sistiaga, R. Wauthle, Q. Xie, J.-P. Kruth and J. Van Humbeeck, Acta Mate
rialia 61, 4657 (2013).
23. J.H. Sharp, G. W. Brindley and B. N. Narahari Achar, Journal of the American Ceramic Society 49, 379 (1966).
24. Z. Liu and G. Welsch, Metallurgical Transactions 19A, 1121 (1988).
25. H. L. Du, P. K. Datta, D. B. Lewis and J. S. Burnellgray, Corrosion Science 36,631 (1994). 26. R. Gaddam, B. Sefer, R. Pederson and M. L. Antti, !OP Conference Series: Materials Science and
Engineering 48, 012002 (2013).
27. S. Frangini, A. Mignone and F. de Riccardis, Journal of Materials Science 29, 714 (1994). 28. D. Poquillon, C. Armand and J. Huez, Oxidation of Metals 19, 249 (2013).
29. C. Ciszak, 1. Popa, J.-M. Brossard, D. Monceau and S. Chevalier, Corrosion Science 110, 91 (2016). 30. A. M. Chaze and C. Coddet, Journal of the Less-Common Metals 157, 55 (1990).
31. C. Dupressoire, A. R. V. Put, P. Emile, C. Archambeau-Mirguet, R. Peraldi and D. Monceau, Oxida
tion of Metals 87, 343-353 (2017).
32. A. M. Chaze and C. Coddet, Journal of Materials Science 22, 1206 (1987). 33. J. L. Murray and H. A. Wriedt, Bulletin of Alloy Phase Diagrams 8, 148 (1987).