Publisher’s version / Version de l'éditeur:
Physical Review A, 16, 2, pp. 672-680, 1977-08
READ THESE TERMS AND CONDITIONS CAREFULLY BEFORE USING THIS WEBSITE.
https://nrc-publications.canada.ca/eng/copyright
Vous avez des questions? Nous pouvons vous aider. Pour communiquer directement avec un auteur, consultez la première page de la revue dans laquelle son article a été publié afin de trouver ses coordonnées. Si vous n’arrivez pas à les repérer, communiquez avec nous à [email protected].
Questions? Contact the NRC Publications Archive team at
[email protected]. If you wish to email the authors directly, please see the first page of the publication for their contact information.
NRC Publications Archive
Archives des publications du CNRC
This publication could be one of several versions: author’s original, accepted manuscript or the publisher’s version. / La version de cette publication peut être l’une des suivantes : la version prépublication de l’auteur, la version acceptée du manuscrit ou la version de l’éditeur.
For the publisher’s version, please access the DOI link below./ Pour consulter la version de l’éditeur, utilisez le lien DOI ci-dessous.
https://doi.org/10.1103/PhysRevA.16.672
Access and use of this website and the material on it are subject to the Terms and Conditions set forth at
Spectral purity of high-intensity laser beams
Panarella, E.
https://publications-cnrc.canada.ca/fra/droits
L’accès à ce site Web et l’utilisation de son contenu sont assujettis aux conditions présentées dans le site
LISEZ CES CONDITIONS ATTENTIVEMENT AVANT D’UTILISER CE SITE WEB.
NRC Publications Record / Notice d'Archives des publications de CNRC:
https://nrc-publications.canada.ca/eng/view/object/?id=15a96056-17e2-41c3-a7be-e9c8c533e14f
https://publications-cnrc.canada.ca/fra/voir/objet/?id=15a96056-17e2-41c3-a7be-e9c8c533e14f
16,
Spectral
purityof
high-intensitylaser beams
AUG UST
1977
E.
PanarellaNational Research Council, Ottawa, Canada KlA OR6
(Received 8March 1977)
Three experiments are described in which high-intensity ruby and Nd:glass laser beams were analyzed for spectral purity, The aim ofthe experiments was to verify whether the nonlinear relation for photon energy e
=
hv/[1—
P„f(I)],
previously used toexplain ionization phenomena in gases irradiated with laser beams, admitted an interpretation in terms ofchange oflight frequency as-afunction ofintensity. Standard methodsoffrequency measurement, namely spectroscopic, interferometric, and filtering methods, were used. The
results consistently exclude the idea of monochromatic laser beams and seem to indicate that, at the intensities used in the experiments, which ranged from afew hundred kilowatts/cm toafew gigawatts/cm,
the laser line is broadened by several hundred angstroms.
I. INTRODUCTION
In
r
ecent years,
a controver sy seems tohave developed on thecorrect
interpretation ofexperi-mental results ofinteraction ofhigh-intensity
laser
light and
matter.
Werefer
in particular to inter-action leading to ionization ingases.
The large body ofexperimental results does not seem tofitinto the
classical
multiphoton picture and it iscommon to read, even in very recent paper
s,
"The
discrepancy between the theoretical results and experimental measurements is not explained in spiteof.
.
.
,"
'
and"The
disagreement with experi-ment, however,persists.
"
'
This occurs ten years or more after the publication of thefirst
papers on multiphotontheory"
and after more than a hundredarticles
have been written on the subjectin an attempt tobring the theory in line with
ex-perimentnt.
The situation in addition
is
aggravated by the inability of the complementary theory, namelycascade, to explain in a convincing manner
break-down phenomena in gases irradiated with
laser
beams, although here one has to admit that a par-ticular functional dependence, that of breakdownlaser
intensity on gas density, iscorrectly
ex-plained by the theory.
It is certainly premature at the present time to pass judgment on the validity of the two
classical
interpretations, and undoubtedly more refined experimentation needs tobe done with improved,both spatially and temporally,
laser
beams, and purergases.
However, in view ofthe large num-ber of applications oflaser
light, the mostimpor-tant ofwhich
is laser
fusion, it seems quite ap-propriate to seek alternate solutions, iftheyexist,
to the present problem. An approach advocatedby this author for some time now'
'
originated from the simple remark that the advent oflasers
has introduced two new elements in the
experi-ments oflight-matter interaction: high coherence ofthe light source and extremely high light
inten-sities
or photon densities. Although the coherenceelement could not be ruled out as a possible cause ofthe divergence of experimental results and
classical
theories (on the contrary, we believe thatitplays a great
role),
the intensity element was deemed to be the decisive component ofthe causeof such divergence.
It
was implicitly argued thateither nonlinearities in the light field'
'
appearmuch
earlier
than expected or that quantumelec-trodynamics breaks down at high photon densities.
Whatever the reason, the consequence was
postu-lated to be avariation of photon energy with photon
density, according to an exponential law
~
=»exp[P„f(1)]=I
vl(1
P.
f(l)
j,
where the symbols conserve the definition given in
my
first
paper.'
One of the main and strong objections tacitly ad-vanced against assumption (1)is that itviolates the principle of conservation of energy. Ithas been argued that ifphoton energy increases with photon density, but the total number of photons
re-mains constant, then a photon traveling towards
the focal point of a lens, where the photon density
is higher, will have its energy raised without reference to a possible source of energy gain. This objection is not valid because
it
fails torecog-nize that relation (1)does not make any assumption
on the number ofphotons undergoing an energy
in-crease.
It
just states that some photons gain ener-gy without precluding that the gain can be achieved, through a collectiveprocess,
at the expense of energy loss from the surrounding photons, or bysome other means. More specifically,
Eg.
(1)suggests that photons have a certain energy
dis-tribution, which depends on photon density, andthat only the more powerful photons in the
"tail"
SPECTRAL
PURIT
Y OF HIGH-INTE1VSIT
YLASER
BEAMSgases.
Another
objection"'"
is
that if(1)
is to replace Planck's equation &=h&, then we must also changeEinstein's equation
for
photon energy F-=mc' inorder to have
a
de Broglie wavelength for photons,or
alternatively, we must change deBroglie's
.equation in order to continue to write
E
=mc'.
This is because deBroglie's
equation ~ =hp',
where P
is
photon momentum, is obtained byequat-ing the two expressions for photon energy,
photo-electric
andrelativistic,
substituting &~'
for &in order to obtain the photon wavelength in terms of h and~c,
and then generalizing~c
to photonmo-mentum. Webelieve that this objection is valid as it goes to the very root ofthe problem, whether
the basic principles of wave mechanics, which
were established for a system of isolated, non-interacting
particles,
"
can be extended to acollec-tion ofparticles at
close
distance, whichpre-sumably
interact.
Ifthe principles cannot beex-tended, then either the energy expression
or
mo-mentum should be revised.No matter how strong, numerous, andplausible the objections are to the adoption of relation
(1),
they can be resolved only through experimentation.This
article is
thus entirely devoted to anexposi-tion ofthe experimental methods we employed for the experimental verification of the validity of
relation
(1}.
The experiments are based on the assumption that, whenEq. (1)
is writtene =hv/[1 —
P„f
(I)]
=hv(I),
then aphoton energy variation with light intensity
should appear as alight-frequency change. We used
three conventional methods of light-frequency mea-surement: filtering, spectroscopic, and
inter-ferometric.
Obviously, the effect being morepronounced at high light intensities,
laser
beamswere used throughout.
The
first
two methods will be described in detail and the results discussed at length. The thirdmethod will be given only asummary presentation, as it
is
the subject of anarticle
to appear soon in theliterature.
"
II. FILTERING METHOD (REF. 15)
The underlying idea ofthis experiment has been
to generate
first
an intense beam ofrubylaser
light, then tofocus
it
in vacuum by means ofa
lens, and finally tofilter
out of the focussed beamany photon of frequency different from the ruby
frequency.
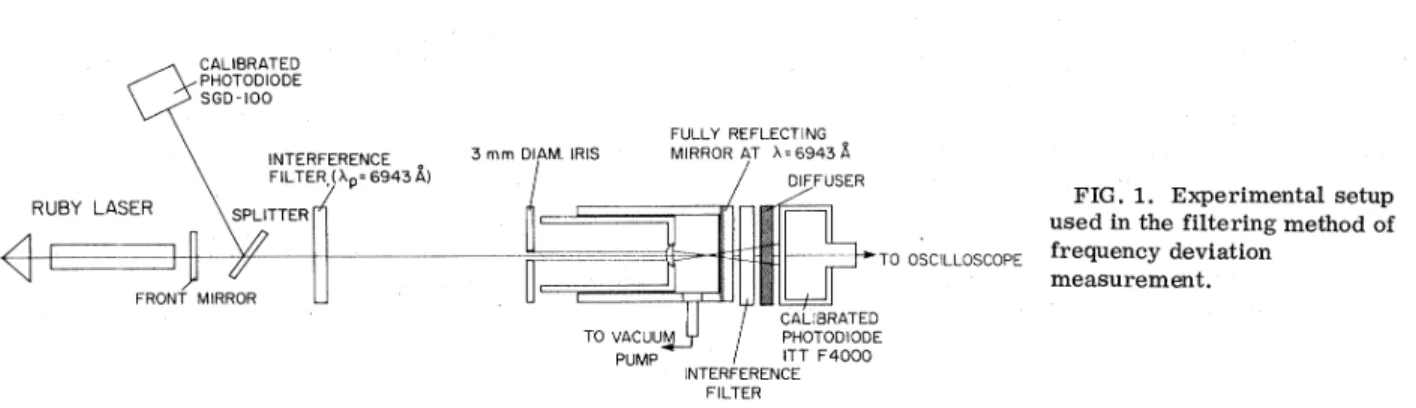
The experimental arrangement is described in
Fig.
1.
Light from a rotating-prism rubylaser,
able to deliver pulses of 40-nsec duration at
=3
MWcm'
peak intensity,is
sent into avacuumchamber (residual pressure
=0.05
Torr)
where itis
focussed by means of a simple piano-convexlens. The beam
is
then turned back by adielectric
mirror reflecting the ruby wavelength (reflection0.
990at &=6943A) andis
absorbed by the blackanodized chamber walls. Photons of different wavelength can, however, pass through the
dielec-tric mirror.
In order to detect them, outside thechamber, immediately after the
dielectric mirror,
is
located an interferencefilter
centered at a wavelength different from that of the ruby, forin-stance ~=6305 A.
.
Finally, a diffuser and anITT-F4000
calibrated photodiode (photocathodediameter,
1.
75 in.=4.
45 cm) withS1
responseconstitute the detector able to measure the amount
of light, if any, ofwavelength different from the
fundamental ruby wavelength.
All components ofthe system,
i.
e.
,mirror,
filter,
diffuser, and photodiodeare
calibratedso
as tohave results in quantitative form. Moreover, in order to make certain that the light entering the chamber has the ruby frequency, an interference filter centered at the ruby wavelength 6943A (peaktransmission,
81%;
half bandwidth, 80 A) is placed immediately after thelaser.
A splitter and a cali-brated EGand G SGD-100 silicon photodiodeare
used to monitor the
laser
output and aniris
is
usedto
restrict
the light entering the vacuum chamberto a
circular
area
of 3-mm diameter.To complete the details of the experimental setup
we should mention that the
laser
beam divergencewas 4&&10
'
rad full width at half maximum (FWHM}TED ODE RUBY LA FRONT MIRROR INTERFERENCE FILTER (~p=6943A) TTER 3mm DIAM.IRIS FULLY REFLECTING MIRRORAT &=6943A DIFF USER TO OSCILLOSCOPE CALIBRATED
TOVACUU~M PHOTODIODE
PUMP ITTF4000
INTERFERENCE
FILTER
FIG.
1.
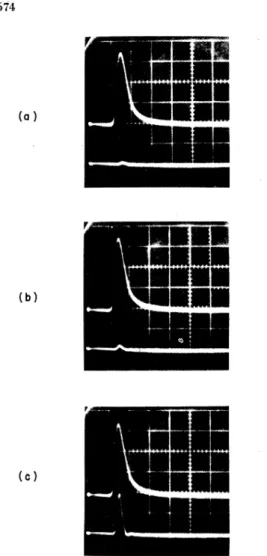
Experimental setup used inthe filtering method of frequency deviation(a)
(b)
(c)
FIG.2. Upper trace: laser pulse (7.33x1p Wcm
/
div)
.
Lower trace: signal obtained with (a)unfocussed beam; (b) beam focussed with a29.5-mm focallengthlens (peak intensity
1.
6x10~ Wcm);
(c) beam focussedwith a10.7-mm focal length lens (peak intensity
1.
22x 10 Wcm
).
Time scale: 0.1 @sec/div; voltagescale
0.
5V/div.and that photodiode SGD-100had 4-nsec risetime
whereas photodiode
ITT
F4000had a risetime of0.
5nsec.
The speed of both devices was howeveroffset by the
15-nsec
risetime ofthe dual beam 555 Tektronix oscilloscope and type I- plug-insused to monitor the signals.
The dielectric mirror and interference
filter
in front ofthe photodiode do not entirelyreject
the6943-A
laser
light. Therefore, before eachexperi-ment, we monitored the leakage
laser
light reach-ing the photodiode. Figure 2(a)shows, onthe lowertrace,
atypical leakage signal when thestraight (unfocussed)
laser
beam enters the vacuumchamber through a flat window and
crosses
anin-terference filter centered at ~=6305A (peak trans-mission, 74%, bandwidth, 80 A)placed in front of
the photodiode. The upper
trace
shows thelaser
pulse, as monitored through photodiodeSGD-i00.
As one cansee,
the leakage signalis
negligible.We then replaced the flat window with a lens of
29.
5mm focal length and positioned itin such awaythat the focal spot was away
(=15
mm) from the surface of the dielectricmirror,
in order not todamage
it.
Everything else remained unchanged and we monitored the signal again. We noticed that it had increased, as shown inFig.
2(b). How-ever, the most dramatic increase occurred whenthe lens was replaced with one of shorter focal
length,
10.
7 mm. Figure 2(c)shows that the signalincreased by more than an order of magnitude.
We repeated the experiment with various inter-ference filters centered at different wavelengths
on both sides of the ruby wavelength and were able
to detect a signal in most
cases.
The amount of light detected is reported in TableI.
Itcan beseen that the peak power of light detected is not
negligible in comparison to the original
laser
power (equal to
1.
75&&10'W). Moreover, light has been detected even with afilter centered at ~=5303A,e.
g.,
1640A away from the fundamentalruby wavelength.
In order to convince ourselves that the detected
light had really a color different from the ruby color and that only the
laser
beam was responsible for its appearance, we proceeded with the following experiments.First,
we varied the gas density in the vacuumchamber up toatmospheric density. No variation
ofany of the signals appeared, which proved that
excitation or ionization of
air
was not responsible for the observed phenomenon.TABLE
I.
Peak power oflight detected with various interference filters attwo laser beamintensities. Laser peak intens ity (W/cm2) Peak power (W) X=7660A X=7330A X=6305A X=5897A X=5303A A,=3497A
1.61 x10⁹
1.
22x10"
0~~ 8.35 x 101.
88x1p' ~~~ 2.15 x10³ 9.44x 10 3.76 x101.
91x 1pSPECTRAL PURiTY
OFHIGH-INTENSITY
LASER
BEAMSSecond, wedisplaced thefocussing lens backward
by an amount
=1
focal length and,for
both lenses, we did not find any signal variation. This proved that the lensitself,
or possible fluorescence ex-cited on itby thelaser
beam, was not the sourceof the signal. In
fact,
if this were thecase,
the signal would have changed in inverse proportion to the square ofthe distance of the lens from the photodiode.Third, we positioned the lens in such away that the illuminated
area
on the dielectricmirror
was the sameas.
with the unfocussedlaser
beam. We found that a signal appeared only when the lens was present. We repeated this procedureillumi-nating the interference filter and the diffuser and
again found that a signal appeared only when the
lens was present. This proved that neither light
from oil, dust
particles,
etc.
, generated on thedielectric mirror,
interferencefilter,
diffuser,nor possible fluorescence excited on them by the
laser
beam, was the source of the signal.Fourth, we inserted calibrated neutral density
filters
along the beam path immediately after thelaser
and observed the signal response. We found in allcases
that itwas linear with light intensity(see
Sec.
Vfor a discussion on this point). In other words, the signal varied in proportion to the amount oflight entering-the vacuum chamber. Thisproved that the detecting photodiode was a linear
device and that a variation ofphotocathode
area
illuminated by the lens did not introduce any
non-linearity of response.
"
Then we fired the
laser
flashlamp withoutlaser
output and found that no signal appeared. Thisproved that the
laser
flashlamp was not the causeof the observed signal. (Ifthis were the
case,
the time constant of the observed signal would at any rate have been greatly increased. )
Finally, we considered the problem ofthe
varia-tion ofdirection of light incident on the dielectric
mirror
due tothe introduction ofthe lens alongthe beam path. The presence of the 3-mm-diam
iris
along the beam path reduced the angle ofincidence to
3'
for the29.
5-mm focal length lensand to
8.
5'
for the10.
7-mmlens.
We performeda
separatetest
ofref
lectivity of the dielectricmirror as a
function oflaser
beam incidence and found that, atleast
up to+10,
no significant changeoccurred.
We then ran acomputer pro-gram to calculate theref
lectivity as afunction ofangle of incidence for the known construction
pa-rameters
ofthe multilayer system ofthedielec-tric mirror
and found that, up to21',
no variationof
ref
lectivity should occur at the ruby wave-length."
Consequently, the change ofdirection ofthe light rays due tothe presence of the lens was
not the cause of the observed signals.
As a result of all this work we felt that the
laser
beam was responsible
for
the signal appearanceand that indeed new
colors
were present in thefocal spot ofthe lens used.
However, still a lot of unanswered questions
remained.
For
instance, could the lens coupleinterferometrically to the dielectric
mirror or
the mode pattern of thelaser
be such as to producelarge-angle light incident on the
dielectric
mirror after focussing,etc.
~ All these questions had, however, as acommon denominator theassump-tion that the
laser
light was still monochromaticand that the passage through the
filters
was facili-tated by some unknown mechanism.In order to answer these questions our line of
thought changed and reasoned that,
if
light had really changedcolor,
we should be able tosee
it.
We then eliminated the photodiode and looked at
the diffuser through the
filters
of safety goggleswhich
are
known toreject
the red ruby light. Whenthe
laser
was fired, an unexpected glow appearedon the diffuser which definitely convinced us that light of frequency different from the ruby frequency
had been generated.
III. SPECTROSCOPIC METHOD
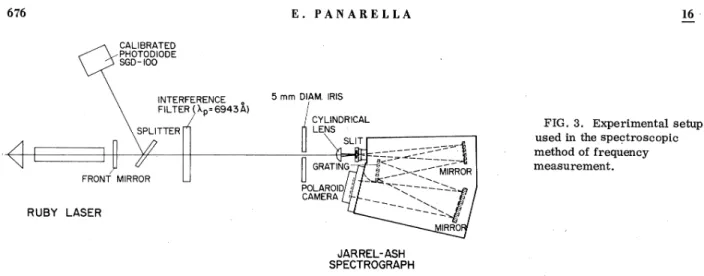
In order to have aconfirmation of the filtering
results,
we then proceeded with a spectroscopic method of frequency measurement. Theexperi-mental apparatus
is
shown inFig.
3.
The samelaser
previously used was fired into aJarrel-Ash
plane grating spectrograph Mod.
75-000.
Theresolution ofthe instrument was 10A/mm. The beam was focussed onto the entrance slit by means of a cylindrical lens of
12.
7 mm focal length. Theslit
aperture was 400 p.m which permitted thefocussed beam to enter the spectrograph
unob-structed by the
slit.
Allspectra
were recorded on Polaroid type-57 film.Figure 4 shows a few typical
records
taken under different amounts ofspectroscope illumination.Figure 4(a) shows the spectrum of the full-intensity
laser
beam, unimpeded by anyfilter.
Thespec-trum of
Fig.
4(b)was obtained by placing an inter-ferencefilter
centered at the ruby wavelength 6943A along the beam path. Figures4(c)-4(e)
show
spectra
of thelaser
beam obtained afterin-serting neutral density
filters
along the beam pathof transmission, respectively, 72,
40,
and1.
3%.
The intensity of light falling on the grating ranged
from
=1.
35&10'
Wcm',
with the unimpeded beam, to .=1.
75x10'
Wcm',
with the beam filtered with the lowest-transmission neutral densityfil-ter.
At the end of the experiment we opened thespectroscope, inspected itfor damage and found
in-TED ODE FRONT MIRROR RUBY LASER INTERFERENCE F ILTE ~p=6945A) TER 5mm DIAM.IRIS CYLINDRICAL LENS GR POLA CAM
FIG.
3.
Experimental setup used in the spectroscopic method of frequency measurement.JARREL-ASH SPECTROGRAPH
curred any damage whatsoever.
The analysis of the
spectra
leads us to the fol-lowing considerations:(i)Spectrum (b)obtained by shining the filtered
laser
beam into the spectroscope has structure not much different from spectrum (a) obtainedwith the unfiltered beam. Therefore the
laser
it-self or
the flashlamp cannot be held responsiblefor
the appearance of such spectra, whichare
duesolely to the
laser
beam.(ii) Overexposure of spectra
(a)-(d)
is not thecause of the
spectra.
Toprove this point let usrecall"
that photographic reproduction is affected by two elements: (a) optical behavior of thesensi-tive layer during its exposure and (b) adjacency
effects occurring during processing. The optical
behavior ofthe sensitive layer
is
determined bythe multiple light reflections, refractions, and scattering within the layer itself with the resulting diffusion modifying the distribution of the exposing light. This diffusion is a spherical
characteristic,
i.
e.
, it has no preferred direction. Adjacencyeffects during processing, which are due to mi-grations of developer component from nonexposed
to exposed
areas,
is also a three-dimensionalphenomenon.
Overexposure makes more apparent the general diffusion of light in all directions. Consequently, on examination of
spectra (a)-(d),
which aresharply confined within the exit slit edges, one
must conclude that the spectra
are
notoverex-posed except at the position ofthe 6943-A line
and the immediate vicinity (+70A).
(iii) Overlapping
of
orders
As far as.
visiblelight is concerned (4000—8000A) the
first-
and second-order grating spectra cannot overlap."
Our grating is blazed for the
first-order
wave-length. Therefore, the observedspectra are
not due to overlapping oforders.
(iv) Grating scattering. It is undoubtedly
pres-ent. However, itis
well known that apulsed rubya) b)
c)
) e) t6400
6945
l7000
7500
I AFIG.4. Spectra ofruby light taken under different intensities of spectroscope illumination: (a) full laser
beam ofpeak intensity
=1.
35&&10 Wcm on grating.No filter of any nature placed 'on beam path; (b)
inter-ference filter (X&=6943
L,
half bandwidth 80A,trans-mission 81%) placed along beam path; light intensity on
grating =
1.09'
10 Wcm;
(c)-(e)interference filterexcluded. Neutral density filters of transmission 72, 40, and
1.
3%, respectively, inserted along beam path. Intensity oflight on grating=9.
72&&10,
5.40&&10,
and1.
75&10 Wcm,
respectively.laser
has a coherence length of only a centimeter,at most. Any scattered light cannot interfere at
the spectroscope exit
slit
with the light diffracted by the grating because the path difference would belarger than the coherence length. Therefore,
grating scattering can be responsible only for the
continuum background light in the
spectra,
not for the appearance of the, several lines on both sidesof the ruby line.
(v}Diffraction pattern
of
the entranceslit.
It is easy to prove that this is not the cause ofspectra
(a)-(d).
Infact,
aspectrum line is merely amono-chromatic image ofthe entrance
slit.
Thediffrac-tion pattern ofthe
slit is
afunction ofslit
width,the half intensity linewidth varying directly as slit
width.
"
We repeated the experiment with variousSPECTRAL PURITY
OFHIGH-INTENSITY
LASER
BEAMS OSCILLOSCOPE CALIBRATED PHOTODIODE SI MACH—ZEHNDER INTERFEROMETER p S2 IMAGE CONVERTER CAMERAFIG.5. Experimental setup used In the interferometric method offrequency measurement. LASER SEAM rr' D TELESCOPE L2 ( D
unable to find any variation of the diffraction pat-tern in all of the
spectra.
Therefore, the array of lines on both sides ofthe 6943-Aruby line does not represent the diffraction pattern of the entranceslit
but, rather, seems to be a fine-structurecom-ponent ofthe 6S43-A line.
(vi)Roseland ghost
lines.
"
These are due toin-trinsic
periodicerrors
of grating ruling. These lines are present in all ourspectra
as pairs oflines symmetrically located on both sides of the
strong ruby line. They are easily recognizable and do not affect the interpretation of the
spectra.
(vii)Lyman ghost
lines.
"
These are observed at large distances from the parentlines.
Theyare
not present in ourspectra.
In summary, the foregoing analysis of
spectra
(a)-(e)
leads us to conclude that thereare
features which cannot be explained within the confines ofclassical
spectroscopy and physics. However, ifwe adopt
a
positive attitude, we would be inclinedtosay that the
laser
line seems topossess
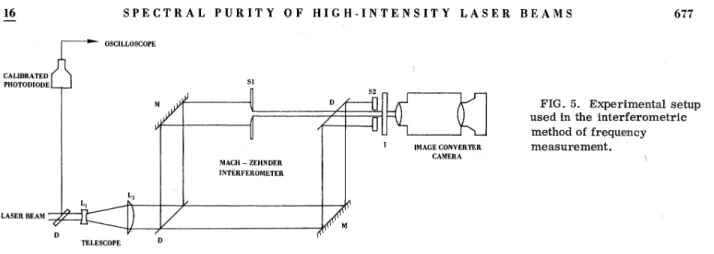
a fine-structure component extending for several hundred angstroms into the blue and red side ofthe spec-trum.the interferometer. An additional
slit
S2 outside the interferometerrejects
all light coming fromthe second arm ofthe interferometer except that
part which can interfere with the beam passing
through
S1.
A narrow-bandfilter
with peaktrans-mission ~
=10600
A and half bandwidth 85 Ais placed in front ofthe camera with the purpose ofrejecting all light but that at the Nd:wavelength. The zeroth-order fringes, which are located in
the plane of slit
S1
andare
oriented normally tothe
slit,
"
are
imaged by the camera and recorded on Polaroid type%7 film. Finally,a
200-nsecplug-in streak unit, used in conjunction with the
camera, pr ovides afilm writing speed of
0.25
mm/nsec, and animage time resolution ofless
than 1 nsecis
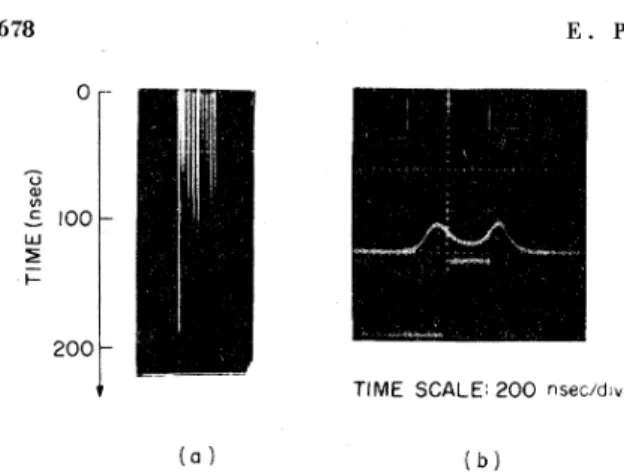
achieved.Figures 6 and 7 show the experimental
results.
Figure6(a}
shows the time history of the inter-ference fringes whenlaser
light experiences a largerate
of intensity variation (=-7kWcm'
nsec'
within the interferometer}, whereasFig.
7(a) showsthe fringes when the intensity varies little in the
course of time. The form ofthe light pulses is
IV; INTERFEROMETRIC METHOD
In this experiment we let light from aQ-spoiled Nd: glass
laser
illuminate a Mach-Zender inter-ferometer and observed the time history of the interference fringes with an image convertercamera.
The experimental apparatusis
shown inFig. 5.
A25-M% peak power, 80-nsec durationNd: glass
laser
pulse enters a telescopic system of lensesL,
L,
where it is expanded from the ini-,tial
0.
5 to4.
2 in.(1.
27-10.
7cm) diameter. In this way, the peak light intensitydecreases
from19.
7MWcm'
to 278.2k%cm
'.
The low-intensitycollimated beam then enters the interferometer.
A slit
Sl,
I
mm wide, located in one arm of theinterferometer, se1ects anarrow central portion of the beam which proceeds undisturbed out of
0
200-TllVIESCALE 200nsec/div
(a) (b)
FIG.
6.
{a) Time history ofthe interference fringeswhen the laser pulse experiences alarge iritensity vari-ation; (b)oscilloscope record oflaser emission (upper
16
0—
200—
TfME SCALE:200 ~secldiv
FIG.
7.
(a)Time history ofthe interference fringeswhen the laser intensity is almost constant with time;
{b) oscilloscope record oflaser emission (upper trace:
6.74
MW/div) and camera open time {lowertrace).displayed in the upper
trace
ofFigs.
6(b)and 7(b), while the camera open time is reported in the lowertraces
of the same figures.Examination of
Figs.
6 and 7indicates that thetime evolution of the interference fringes, in the
case
of variable light intensity, has abehavior different from thecase
of constant light intensity.When the intensity remains constant, or almost
constant, in the course of time
(Fig.
7)the fringes appear, as expected, straight and parallel. Know-ing that the fringe spacingis
proportional to light wavelength, it can be concluded that the lightwave-length (or frequency) does not vary in this
case.
Gn the contrary, when the intensity experiences a large increase in the course oftime(Fig.
6), the fringes seem to contract and awavelengthde-crease
of =2000A appears.These interferometric results were analyzed
in depth in the paper mentioned in the Introduc-tion.'4
It
suffices to repeat here that thewave-length shift was proved to be a true effect, no
al-ternate interpretation being possible, such asself-induced phase modulation in the
laser
glass, dis-tortion ofthe electron optics within the imagecon-verter
camera, orlaser
beam divergenceeffect.
On the other hand, the spectroscopic and filtering results are in general agreement with the inter-ferometric
results.
They show that photons do notmaintain their frequency but undergo frequency fluctuations according to light intensity.
V. DISCUSSION
Ifwe take an overall view ofthe experimental
results,
the immediate remark to be madeis
thatall three methods of frequency measurement con-sistently exclude the idea of
a
monochromaticlaser
beam and support the hypothesis of abeamwith a large frequency distribution. The
broaden-ing ofthe
laser
line isclear
in the spectroscopic and filteringresults.
It isless
apparent in the interferometric results because the narrow-bandfilter
in front of the image-converter camera(Fig.
5), centered at thelaser
frequency, permitssufficient transmission for recording only to the
blue-shifted high-intensity region of the beam.
The second remark to be made
is
that thelaser
frequency does not seem tobe afunction ofthe
instantaneous
laser
intensity. In fact, ifwe com-pare the interferometric and spectroscopic re-sults, we note that, although the.laser
intensity in the spectroscopic measurements was as high as1.
35&10'
Wcm',
e.
g.
, =5 times larger than inthe interferometric measurement, the wavelength
shift was larger in the latter
case
than in theformer.
This general behavior is confirmed by the filteringresults.
A displacement ofthe focussinglens, with consequent variation of intensity of light
at the position of the dielectric
mirror,
does notyield a change in the amount of light detected of
color different from the fundamental
laser
color.
In other words, it seems that photons of shiftedwavelength do not return immediately tothe
origi-rial frequency when the intensitydecreases,
buthave a certain
"lifetime,
"
whichis
afunction of the overall intensity distribution in the light pulse.We further note that, despite our efforts, the reported results
are
qualitative and notquantita-tive.
Quantitative results can be obtained only ifone is able to measure the amount of light
con-tained in a small frequency interval away from the
laser
frequency. We have not been able todoso.
Infact,
the interferometric results yield informa-tion onwavelength shift only. The spectroscopic results also suffer from the same drawback. Evenif
we had used a calibrated film torecord
thespectra,
aquantitative analysis would beimpossi-ble because of the presence of scattered light and
"ghost" lines.
We are now working on an.arrange-ment consisting ofa specially made filter and a calibrated photomultiplier to replace the film on
the spectroscope. The band-stop filter will only
reject
ruby light, in which we are not interested, but will allow all other wavelengths to pass through and to be detected by the photomultiplier. In this way, we hope to have aquantitative plot ofinten-sity distribution as afunction of wavelength. As to the filtering
results,
we do not think wehave really measured intensity of light at the filter
wavelength. This is because a filter
selects
itsown wavelength for transmission only when the
direction of the impinging rays
is
perpendicular to the filter surface or deviates by a small angle, say +10.
In ourcase
photons undergoing afrequency shift do so after scattering from the focal region.16
SPECTRAL PURITY
OFHIGH-INTENSITY
LASER
BEAMS 679A
—
c
(
kc/X, 1 PI
&e-txa~nf
u p(2) where &~is the
laser
frequency, and the spatial light distribution has been assumed to be GaussianI
=I~e
'"
.
As before' we have takenf(I) =I".
Photons of~~~&are
located ina circle
ofradius &deduced from
(2):
r
~[(1/a)
ln(I~/I )]'
',
'I
where
I
is the peak intensity of alaser
beamwhich contains only one photon (located at
r
=0)
of The total number ofphotons of~~~f
is then tobe outside the+10'-aperture
central cone havingapex at the focal point. Since the transmission wavelength of an interference filter
decreases
whenthe filter is tilted relative toperpendicular rays,
some ofthe scattered rays of wavelength shorter than the original central wavelength are allowed
to
cross
thefilter.
In other words, thefilter,
ona
crude approximation, behaves as ashort-wavepass,
rather thana
narrow-band device, the cutoffwavelength being the wavelength for perpendicular
rays.
The matter is further complicated by thefact that the quantum efficiency of the detector, the
ITT
photodiode, varies with wavelength. Hence, the results of TableI
are just an indication that light of frequency different from the funda-mentallaser
frequency was detected by the photo-diode, but they do not represent in any way amea-surement ofthe amount of light at the filter wave-length.
One final point is worth discussing. In the
filter-ing measurements we found that, by inserting cali-brated neutral densityfilters
along the beam path, the signal varied linearly with light intensity.It
is
easy to prove that this resultis
in agreement withthe predictions of relation
(1).
Infact,
consider alaser
pulse ofpeak intensity I~. Knowing that afilter
really behaves, on afirst
approximation, as ashort-wavepass,
me need to calculate the number ofphotons which, according toEq.
(1), havewave-length ~shorter than ~f, the filter wavelength. We
shall write
Np(Ip)
Iq,
which
is
what we found.VI. CONCLUSION
The experimental results reported in this
article
suffer from a residual uncertainty as to the degreeof influence played by the detector on'the
measure-ment. We cannot resolve this uncertainty. We
can only say that we tried to perform experiments in mhich the detector played aminor role and tried to interpret the results by taking into proper
ac-count the role of the
detector.
Historically, the situation is not new.
For
in-stance, when white light was
first
decomposed intocolors
by means of a prism, the question imme-diately arose as to whether the prism, rather thanthe original white light, might be the source of the new
colors.
Asis
well known, severalexperi-ments done with different dispersive instruments solved this doubt and proved that white light was indeed ablend of all
colors.
Similarly, we believe that the doubts surrounding our results willdis-appear when several independent experiments, done under different conditions, will bring results
of converging interpretation.
As to the possibility that the results reported here undermine the unity of physics and leave the
entire field ofquantum theory in great disarray, we mould like to point out that this is not
neces-sarilyso.
Allen" has demonstrated that thenon-linear relation (1)can be accommodated under
standard
first
principles ofquantum mechanics.By assuming the validity of Heisenberg uncertainty principle for photons and decomposing photon mo-mentum in three space, he proves that the energy of focussed photons has alower bound, the bound
being determined by no more than the geometrical focussing parameters. Should this interesting idea, which admits a quick experimental
verifica-tion, be proved to be
correct,
then the photo-ionizationprocesses
ofgases, which mere themotivation and starting point of all our work, will be conclusively demonstrated tobe single-photon
processes
of nonlinear ionization.f(b a)1fl(Ip/Im)l 2 Np(Iq) = h.
c
I
e'"rd&
=(vA/&ca)(I~ —I
),
. =(m& /hca)I (1—I
/I
).
(4)Knowing that our
laser
beam had intensityI~»
I,
we can write
ACKNOWLEDGMENTS
The spectroscopic work reported here originated
from a discussion with
Dr.
A. A. Pietrzyk. The work was initiated byDr.
J.
Lau and brought to conclusion byV.
Guty. The filtering and inter-ferometric works were possible because of theassistance
ofJ.
Lancaster and W.C.
Michie. Their high technical competenceis
appreciated and acknomledged.i6
~Y. Flank, , G.Laplanche, M.Jaouen, and A.Rachman,
J.
Phys. B9, L409 (1976).2M. R.Teague,
P.
Lambropoulos, D.Goodmanson, and D.W.Norcross, Phys. Rev.A 14, 1057(1976).~L.V.Keldish, Sov. Phys.-JETP 20, 1307(1965).
H.
B.
Bebband A.Gold, Phys. Rev. 143, 1{1966). 5E. Panarella, Found. Phys. 4, 227 (1974). ~E. Panarella, Phys. Rev. Lett.33, 950(1974).'E.
Panarella, Can.J.
Phys. 54, 1815(1976).R.Karplus and M.Neuman, Phys. Rev.80, 380(1950}.
9R. Karplus and M.Neuman, Phys. Rev. 83, 776 (1951).
~
J.
McKenna andP.
M.Platzmann,Phys. Rev. 129,
2354 (1963)
.
A. D.Allen, Bull.Am. Phys. Soc.20, 61(1975).
'
A.D.Allen, Found. Phys. (to be published).~
B.
G.Levich, Theoretical Physics, (North-Holland,Amsterdam, 1970),Vol.1,p. 269. 4E. Panarella, Found. Phys. 7, 405 {1977).
~'A concise report of this experiment has been presented at the recent meeting ofthe Plasma Physics Division
ofthe A.P.
S.
[E.
Panarella, Bull.Am. Phys. Soc.21,1 (1977)
This result rules out also the hypothesis that oil or dust particles atthe focus oron the surface ofthe lens
could bethe source ofthe signal.
Irrespective oftheproperty ofthe light used, a signal response proportional tothe amount oflight impinging
on aphotocathode indicates that the photocathode be-haves linearly with light intensity. In our particular
case, considering that the same linearity appears when
the illuminated area changes, it further indicates that
the photocathode area variation has no effect on the linearity ofresponse. Therefore, photocathode non-linearity is absent and the observed signals have a
dif-ferent origin.,The only question thus remaining isto verify whether this result is in contradiction tothe basic hypothesis ofEq. (1),and this is done in the
discussion ofSec. V.
~8We are indebted toDr.
J.
A.Dobrowolski for his as-sistance inproviding us with the computer program.P.
Kowaliski, Applied PhotograPhic Theory (Wiley,New York, 1972),pp. 145-160.
R.
S.
Longhurst, Geometrical and Physical Optics(Longmans, Green, London, 1963),p.235.
2~G.R.Harrison, R. C.Lord, and
J.
R.Loofbourow,Practical SpectroscoPy (Prentice-Hall, Englewood Cliffs, Ng., 1959), p.122and pp. 44—45.
~2For those readers who arenot familiar with
inter-ferometry, we recall that the fringes in a
Mach-Zehnder interferometer can belocalized inany plane,
even in aplane within the interferometer itself [M.Born and