HAL Id: inserm-02266176
https://www.hal.inserm.fr/inserm-02266176
Submitted on 13 Aug 2019HAL is a multi-disciplinary open access
archive for the deposit and dissemination of sci-entific research documents, whether they are pub-lished or not. The documents may come from teaching and research institutions in France or abroad, or from public or private research centers.
L’archive ouverte pluridisciplinaire HAL, est destinée au dépôt et à la diffusion de documents scientifiques de niveau recherche, publiés ou non, émanant des établissements d’enseignement et de recherche français ou étrangers, des laboratoires publics ou privés.
Investigation of the impact of PTMs on the protein
backbone conformation
Pierrick Craveur, Tarun Narwani, Joseph Rebehmed, Alexandre de Brevern
To cite this version:
Pierrick Craveur, Tarun Narwani, Joseph Rebehmed, Alexandre de Brevern. Investigation of the impact of PTMs on the protein backbone conformation. Amino Acids, Springer Verlag, 2019, 51 (7), pp.1065-1079. �10.1007/s00726-019-02747-w�. �inserm-02266176�
Investigate the impact of PTMs on the
protein backbone conformation.
Pierrick Craveur
1,2,3,4,5,#, Tarun J. Narwani
1,2,3,4,#, Joseph Rebehmed
1,2,3,4,6,+& Alexandre G. de Brevern
1,2,3,4,+,*1 INSERM, U 1134, DSIMB, F-75739 Paris, France.
2 Univ Paris, Univ de la Réunion, Univ des Antilles, UMR_S 1134, F-75739 Paris, France. 3 Institut National de la Transfusion Sanguine (INTS), F-75739 Paris, France.
4 Laboratoire d'Excellence GR-Ex, F-75739 Paris, France.
5 Department of Integrative Structural and Computational Biology, The Scripps Research Institute, La Jolla,
California, USA.
6 Department of Computer Science and Mathematics, Lebanese American University, Byblos 1h401 2010,
Lebanon.
Short title: flexibility & PTMs
#: Both first authors contributed equally +: Both last authors contributed equally
* Corresponding author: Dr. de Alexandre G. de Brevern, INSERM UMR_S 1134, DSIMB, Université de Paris, Institut National de Transfusion Sanguine (INTS), 6, rue Alexandre Cabanel, 75739 Paris cedex 15, France
e-mail : alexandre.debrevern@univ-paris-diderot.fr Tel: +33(1) 44 49 30 38 / Fax: +33(1) 47 34 74 31
Key words: rigidity, mobility, deformability, N-glycosylation, phosphorylation, methylation, statistics, renin endopeptidase, liver carboxylesterase, cyclin-dependent kinase 2 (CDK2), actin.
Abstract
Post-Translational Modifications (PTMs) are known to play a critical role in the regulation of the protein functions. Their impact on protein structures, and their link to disorder regions have already been spotted on the past decade. Nonetheless, the high diversity of PTMs types, and the multiple schemes of protein modifications (multiple PTMs, of different types, at different time, etc) make difficult the direct confrontation of PTM annotations and protein structures data.
We so analyzed the impact of the residue modifications on the protein structures at local level. Thanks to a dedicated structure database, namely PTM-SD, a large screen of PTMs have been done and analyze at a local protein conformation levels using the structural alphabet Protein Blocks (PBs). We investigated the relation between PTMs and the backbone conformation of modified residues, of their local environment, and at the level of the complete protein structure. The two main PTM types (N-glycosylation and phosphorylation) have been studied in non-redundant datasets, and then, 4 different proteins were focused, covering 3 types of PTMs: N-glycosylation in renin endopeptidase and liver carboxylesterase, phosphorylation in cyclin-dependent kinase 2 (CDK2), and methylation in actin. We observed that PTMs could either stabilize or destabilize the backbone structure, at a local and global scale, and that these effects depend on the PTM types.
Introduction
After its synthesis, a protein can undergo reversible or irreversible covalent modifications, namely Post-Translational Modifications (PTMs). In some cases, such as N-glycosylation, the modifications take place during the translation, but are commonly included under the term PTMs. The modifications alter the physicochemical properties of the proteins and thereby regulate enzymatic activity, cellular localization and intermolecular interactions (Deribe et al. 2010; Duan and Walther 2015; Zhao et al. 2010). This wide range of functions is reflected by the high diversity of PTMs depending on the cell type, the tissue, and the organism in which proteins are synthesized. Additionally a protein could be modified in many ways and at different residue positions over time. The same position may also undergo changes of different kinds. However, changes may be specific to certain amino acids, like N-glycosylation found on asparagine in the specific consensus sequence Asn-X-Ser/Thr where X can be any amino acid residue but proline (Moremen et al. 2012). PTMs are extremely diverse, ranging from the addition of a small group of atoms, such as phosphorylation (Humphrey et al. 2015), to the attachment of bulkier oligosaccharide by glycosylation (Imberty 1997). PTMs are essential to regulate biological functions, such as DNA transcription by histone methylation and demethylation, acetylation or phosphorylation (Bannister and Kouzarides 2011; Mijakovic et al. 2016), nuclear-cytosolic or extra-cytosolic transport by SUMOylation (Hendriks and Vertegaal 2016; McIntyre et al. 2015) or glycosylation (Dewald et al. 2016; Imberty and Perez 1995), tagging proteins for degradation by ubiquitination (Zhou and Zeng 2016), and regulation of kinase activity with phosphorylation (Krupa et al. 2004). PTMs are also associated with major human diseases such as cancer, diabetes, cardiovascular disorders and Alzheimer's disease (Kamath et al. 2011; Li et al. 2010; Martin et al. 2011).
such as competition for serine and threonine residues between phosphorylation and O-glycosylation (Butt et al. 2012; Zeidan and Hart 2010); ubiquitination favored over phosphorylation leading to protein degradation (Vodermaier 2004), or the interactions between PTMs regulating the activity of the p53 protein and Histones (Brooks and Gu 2003; Latham and Dent 2007). These observations suggest towards the existence of a PTM-code (Creixell and Linding 2012; Minguez and Bork 2017; Nussinov et al. 2012), which is based on the presence and association of several PTMs leading to the realization of particular functions. Recently, the increasing number of annotations on PTMs have assisted scientists to study the cross talk or direct / indirect influences among different types of PTMs (Lu et al. 2011; Tokmakov et al. 2012; van Noort et al. 2012) their competition for the same residue (Danielsen et al. 2011), or the co-evolution of different PTMs sites within the same protein (Minguez and Bork 2017; Minguez et al. 2013; Minguez et al. 2012).
Many databases and prediction tools have been developed to enhance the understanding of various PTMs in different organisms and to simplify the analysis of complex PTM data (Gianazza et al. 2016). These PTM databases contain crucial sequence annotations, specific to some PTM types and/or organisms (Gupta et al. 1999; Hornbeck et al. 2015; Yao and Xu 2017), and provide related structural data which mainly correspond to the mapping of the PTM sites in protein entries of the Protein Data Bank (PDB) (Huang et al. 2016). Numerous machine learning methods consisting of predicting PTM sites were published recently. They mainly differ in the types of PTM and/or organisms focused, in their learning protocols (support vector machine, random forest, neuronal network, etc.), and in the set of descriptors extracted from the mining of the experimental data (Audagnotto and Dal Peraro 2017; Gianazza et al. 2016). Few of them, used descriptors derived from structural data, such as prediction of secondary structures, disorder and accessible surface area (Lopez et al. 2017; Lorenzo et al. 2015), or from structural properties extracted from PDB (Torres et al. 2016;
Wuyun et al. 2016).
The proteins functions and their 3D structures are intrinsically related. Hence, it is expected that PTMs, which regulate function, impact the structure of proteins as well. Several previous studies have investigated the effects that PTMs could have on the protein structure and dynamics, using X-ray data (Xin and Radivojac 2012), and NMR data (Gao and Xu 2012). Xin and Radivojac (Xin and Radivojac 2012) computed local and global RMSDs between modified (with at least one PTM), and unmodified PDB chains of the same protein. They concluded from the statistical analysis of their RMSDs that N-glycosylation and phosphorylation induce conformational changes, with a limited impact, at both local and at global levels, with a larger influence for phosphorylation. On their side, Gao and Xu (Gao and Xu 2012) suggest that disorder-to-order transition could be induced by the modifications of phospho-serine/-threonine, various types of methyllysines, sulfotyrosine, 4-carboxyglutamate, and potentially 4-hydroxyproline.
Disorder regions are mainly defined as series of missing residues in X-ray structures taken from the PDB, they are highly frequent (more than 80% of the X-ray structures with a resolution worse than 1.75 Å have missing residues) (Djinovic-Carugo and Carugo 2015). Many analyses have focused on Intrinsic Disorder Proteins (IDPs, (Piovesan et al. 2017)) that are often implicated in molecular recognition. They bind a partner molecule and undergo “induced folding” or “disorder-to-order transition” leading to an ordered state in which PTMs can paly a role (Fuxreiter and Tompa 2012). Hence IDP regions have been associated with numerous PTMs, as hydroxylation, methylation, and notably phosphorylation (Gao and Xu 2012; Vucetic et al. 2007; Xie et al. 2007a; Xie et al. 2007b) which was recently proposed to function as protein interaction switches in more ordered regions (Betts et al. 2017).
To investigate a potential relation between the presence of a PTM on the protein and the structure itself, we used PTM-SD (Craveur et al. 2014) that gives access to X-ray
structures of modified residues in proteins that specifically correspond to all PTM annotations. We investigated the impact of PTMs on the protein backbone conformations observed in crystallographic data. First, the diversity of the backbone conformations of N-glycosylated and phosphorylated regions was analyzed. Then local and global effects in the backbones were compared between 4 specific examples of PTMs associated to a high number of experimental data. Finally, the presence and absence of PTMs on the protein were also compared in regards to the backbone flexibility.
Methods
PTM-SD. Post Translational Modification Structural Database (http://www.dsimb.inserm.fr/dsimb_tools/PTM-SD/) is designed to give users a curated access to the proteins for which one or more Post Translational Modification(s) is (are) structurally resolved in the Protein Data Bank (PDB) and also experimentally annotated in dbPTM (Huang et al. 2016) and PTMCuration (Khoury et al. 2011). PTM-SD uses diverse set of rules to underline the discrepancies between annotation in the structure and the sequences owing to different sources. Also, PTM-SD allows the user to create customized PTMs queries and perform different analyses on the returned entries, e.g. computing distribution of organisms, proteins, PDB codes/chains, and PTM types, assigning PBs, computing Neq (see bellow), highlighting discrepancies between PDB sequence and UniProt sequence, clustering for generation of non-redundant dataset, etc.
Besides a global view on PTMs, the database also provides details for each PTM and further connects to different PTM information and annotations found in other databases. Such data are very informative for studying relationship between PTMs and protein structures, for designing comparative modeling protocol, and for prediction protocol based on different approaches, for example, on secondary structure descriptors.
Dataset. The dataset used in this study is generated using PTM-SD. It comprises of
structures pertaining to phosphorylation, N-glycosylation and Methylation while also contains corresponding structures without a modification (a tabular summary of the dataset can be found in Table S1 and the dataset in Dataset S1). The comprehensive dataset included a total of 9.870 PTMs present on 5.948 structures. From these, 7.110 modifications were N-glycosylation while 1.874 were phosphorylation and 886 methylations. The dataset was further refined to remove redundancy (>25% identity) using PTM-SD clustering toolkit. It is important to generate non-redundant dataset by filtering over-represented chains to avoid biasing the analyses..
The non-redundant dataset consisted of 348 N-glycosylation on 156 PDB chains from 41 different organisms, 92 phosphorylations on 76 structures from 12 different organisms and 19 methylations on 15 structures from 9 distinct organisms. Similar datasets were generated, using PTM-SD, for the analysis of different types of phosphorylations. 57 serine modifications on 45 pdb chains while 29 phosphothreonine and 34 phosphotyrosine are found on 29 and 30 unique pdb chains (tabular details are provided in Table S2).
A derived dataset was also created to assess the impact of PTM on the global structure. Therefore, a dataset comprising 4 proteins with the largest number of observations; Renin endopeptidase (N-glycosylation), Liver carboxylesterase (N-glycosylation), Cyclin dependent Kinase 2 (Phosphothreonine) and Actin (Methylation) was generated (refer to Table S3), sequences with too many missing residues were not taken into account. As we are working with same protein chain, it is essential to keep here all entries, i.e. to have a better view of the (potential) local protein conformation differences.
Protein Blocks. Protein Blocks (PBs) are a structural alphabet composed by a set of 16
described as series of eight Φ, Ψ dihedral angles. An unsupervised classifier similar to Kohonen Maps (Kohonen 1982; Kohonen 2001) and Hidden Markov Models (Rabiner 1989) obtained them. Briefly described, PBs m and d are prototypes for the central region of α-helix and β-strand, respectively. PBs a to c primarily represent the N-cap of β-strand while e and f correspond to C-caps; PBs g to j are specific to coils, PBs k and l correspond to N cap of α-helix while C-caps are represented by PBs n through p.
The Protein Blocks efficiently approximate all local regions of a protein structure with an average RMSD of 0.41 Å (Etchebest et al. 2005). They have been employed in various approaches including protein superimposition (Gelly and de Brevern 2011; Joseph et al. 2012), structural analysis (Dudev and Lim 2007; Wu et al. 2010) or prediction (Rangwala et al. 2009; Zimmermann and Hansmann 2008) of protein binding sites, and structural analysis of β-bulges (Craveur et al. 2013).
Protein Blocks assignment. The assignment translates a 3D structure to 1D sequence
of PBs. In our study input structures come from PDB files. The algorithm uses 5 residues long window for each position. For each “nth” position, 8 dihedrals ψn-2, φ n-1, ψ n-1, φ n, ψ n, φ n+1, ψ n+1, φ n+2 are compared to the reference set of 16 PBs. The comparison is performed using the RMSDA criteria (Root Mean Square Deviation on Angular values) (Schuchhardt et al. 1996):
RMSDA(V1,V2) = ψ
( )
V1 −ψ( )
V2 ⎡ ⎣ ⎤⎦ 2 i=1 i=M −1∑
+⎡⎣ϕ( )
V1 −ϕ( )
V2 ⎤⎦ 2 2 M −1(
)
(1)
V1 is the 8 dihedrals vector extracted from the M = 5 residues long window; V2 is the 8 dihedrals vector corresponding to the compared PBs. PB, which gets lowest RMSDA is chosen as the representing conformation observed in the window. PB assignment was done with a modified version of the PBxplore tool (https://github.com/pierrepo/PBxplore, (Barnoud
et al. 2017))(see Figure 1B).
Neq - Local structure entropy. 3D structures of a specific protein could be observed
with different conformations in X-ray crystals, or during molecular dynamics simulations. This could be attributed to the intrinsic flexibility of the structure or the consequences of interactions with small molecules (ligand, cofactor, water molecules), or macromolecules (proteins, DNA, RNA). Under such scenarios, each of these 3D conformations would be assigned a different PB sequence (see Figure 1B). By analyzing the variation of PBs at each position, it’s possible to investigate the local conformational changes in a protein structure.
The equivalent number of PBs (Neq) is a statistical measurement similar to Shannon entropy and represents the average number of PBs observed at a given position (de Brevern et al. 2000). Neq is calculated as follows:
Neq = exp( − fx
x=1 16
∑
ln fx)(2)
where fx is the frequency of PB x (x takes values from a to p). A Neq value of 1 indicates that only one type of PB is observed, while a value of 16 is equivalent to a random distribution.
For example Neq value around 6 would indicate that at the current position of interest, 6 different PBs are observed. If Neq exactly equal to 6, this means that 6 different PBs are observed in equal proportions (1/6). By plotting the computed Neq value at each residue position (see Figure 1B), it is possible to locate which protein regions have local conformation change, or in other words, which region of the structure represents backbone deformation. A clear interest of Neq in regards to the use of root mean square deviation (see (Burra et al. 2009) for similar analyses) is to provide a simple measure that quantifies locally the divergence.
B-factor normalization. B-factor values are partly dependent on the resolution of the
crystal and of the refinement process (Hinsen 2008; Linding et al. 2003; Schlessinger and Rost 2005). Also crystallographic contact packing and addition of stabilizing molecules can impact the B-factor values. Then, in order to compare B-factor from several X-rays of the same protein, it is needed to normalize the value. In our study raw B-factor values were normalized as recommended by Smith et al (Smith et al. 2003), starting by removed outliers values detected with the median-based approach. The normalized B-factors are computed as follow: Bfactorinorm = Bfactori raw −µ σ
(3)
where µ and σ are the mean and the standard deviation of the B-factor values (without outliers) respectively, Bfactorinorm is the normalized B-factor at position i in the sequence (and the structure) and Bfactoriraw the original B-factor value.
Various analyses. The 3D structure representations were generated using PyMOL
software (http://www.pymol.org) [The PyMOL Molecular Graphics System, Version 1.7 Schrödinger, LLC.] (Delano 2013). Most of the analyses were done using Python programming language and R software (R Core Team 2013).
Results
Backbone protein conformational diversity at the vicinity of N-glycosylated and phosphorylated residues. Using PTM-SD (Craveur et al. 2014), the two most frequent PTMs
were focused upon, N-glycosylation and phosphorylation. 3,092 and 1,307 chains were found containing 7,110 N-glycosylations and 1,873 phosphorylations in 100 and 22 organisms respectively. A non-redundant dataset, with less than 25% of identity between the
corresponding UniProt sequences, was generated, resulting in the selection of 348 N-glycosylations (for 156 protein chains in 41 organisms) and 92 phosphorylations (for 75 protein chains in 12 organisms, see Supplementary Table S1).
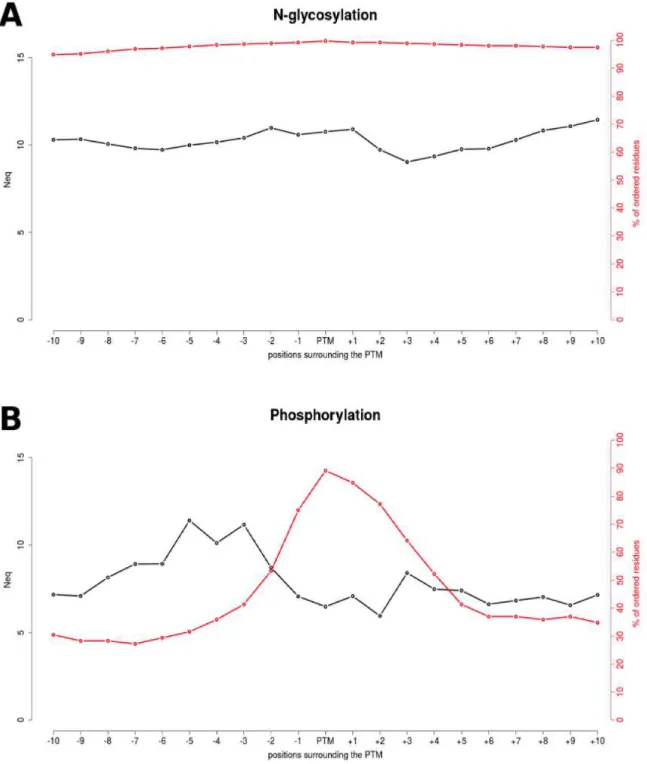
Neq was used to analyze the local protein conformations. Based on 16 PBs, it underlines the diversity of local conformation in a finer manner than the classical secondary structures (see Methods). Figure 2 shows the variations of PBs around the two PTMs. N-glycosylated and phosphorylated sites do not exhibit any significant preferences for a particular local structure conformation. The Neq values are very high, ranging from 9.03 to 11.44 for N-glycosylation, and from 5.95 to 11.41 for phosphorylation, implying that these two modifications are observed in widely diverse structural contexts. Nonetheless, it is interesting to note that both types of PTMs have an overall different Neq profiles (see black curve in Figure 2).
For N-glycosylation, the PTM site position presents an Neq = 10.76 which is extremely high. This would mean that N-glycosylated residues have backbone conformation as diverse as 2/3 of the backbone conformations observed in proteins. Additionally the surrounding positions of the PTM sites show the same level of diversity, with Neq values fluctuating around 10.
For phosphorylation, the Neq profile is quite different. First of all, as indicated by the red curve on Figure 2, the surrounding positions of phosphorylation sites are mainly disordered. The farther the positions are from the PTM sites, the higher is the disorder in the structure; meaning that less residues were available at these positions in the PDB chains to be used for the PBs assignments and the Neq computation. However the data used is diverse enough to reach high level of Neq (6.48) computed at the PTM position. Preceding positions -8 to -2 show even higher diversity. It is important to confirm that the absence of data in the
surrounding positions is not the consequences of phosphorylation sites located at the N- or C- terminus; indeed only 12 of them (out of 92) are close to the protein extremities.
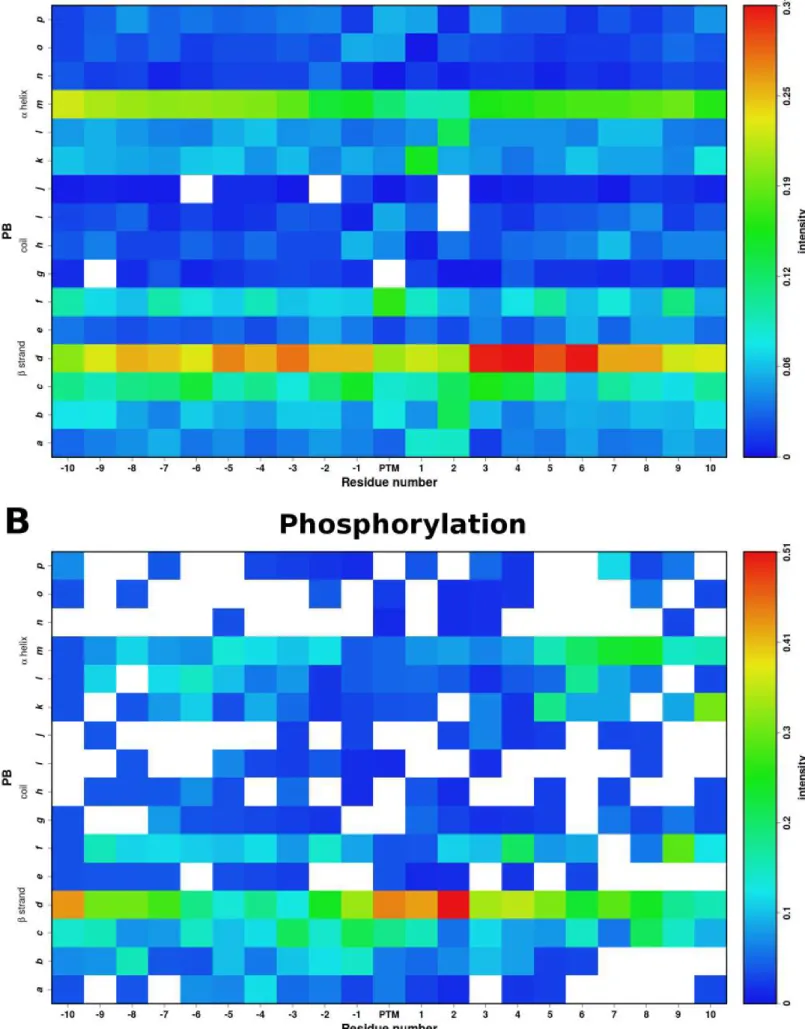
A more precise analysis of the distribution of each type of PBs (see Supplementary Figure S1) underlines that N-glycosylation and phosphorylation sites are observed for all types of local conformations, almost any kind of PBs (except PBs g for both, and, h, j, and p for phosphorylation).
The conformations of the N-glycosylation sites and their surrounding residues are mainly associated with the PBs d and m. However, this proportion does not exceed 31%. It is interesting to note that the positions +3 to +6 following the N-glycosylation sites are significantly observed in a PB d conformation. This illustrates the fact that in ~1/3 of the times N-glycosylation site precedes a β-strand conformation.
For phosphorylation, the modification sites have a preference of PB d, the cores of β strands, in a little over 40% of cases. The vicinity of the phosphorylation sites is also observed with a wide variety of conformations, however a slight preference was observed for the PBs b, c, d, f, l and m. It should be noted that more than 50% of the phosphorylation sites are separated by two residues of a PB d.
It is important to understand that data used here provides information on the backbone conformation of PTM sites when the modifications are present, but do not obviously reflects the backbone in the absence of modifications.
Additionally, while phospho-serine and phospho-threonine share similar PB profiles, they are distinct from phospho-tyrosine (see Supplementary Figures S2, S3, and Supplementary Table S2). The modified residues were observed in a large set of backbone conformations for all three cases, but the preferences for the core β-strand conformation (PB d) is greater in the case of Serine and Threonine.
Local backbone diversity compared to global backbone diversity in modified proteins. In order to compare the flexibility of the PTM region with the rest of the protein, we
selected a large number of 3D chains corresponding to the same protein. Each chain was solved with a single PTM at identical sequence positions. 4 different proteins were studied, covering 3 types of PTMs: N-glycosylation in renin endopeptidase and liver carboxylesterase, phosphorylation in cyclin-dependent kinase 2 (CDK2), and methylation in actin. A total of 471 PDB chains were used in this analysis (see Supplementary Table S3).
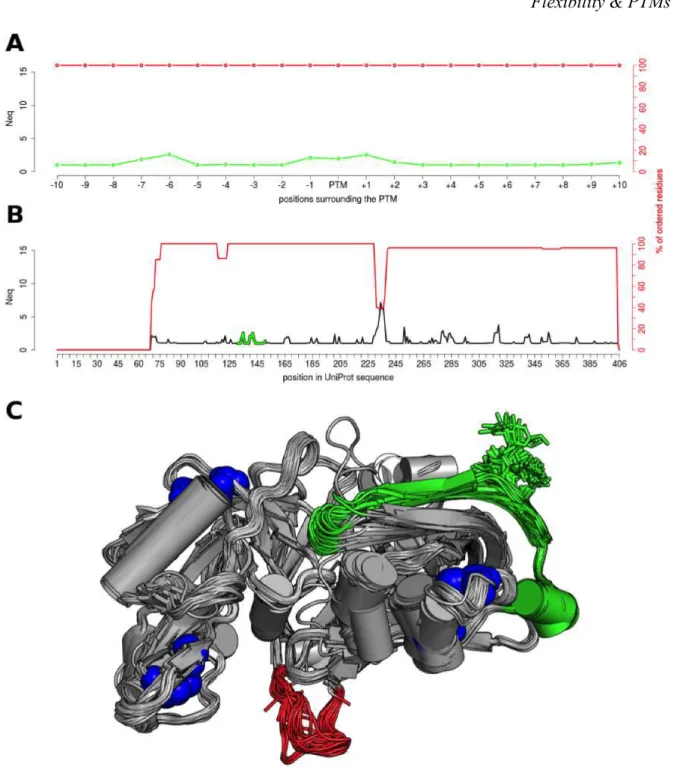
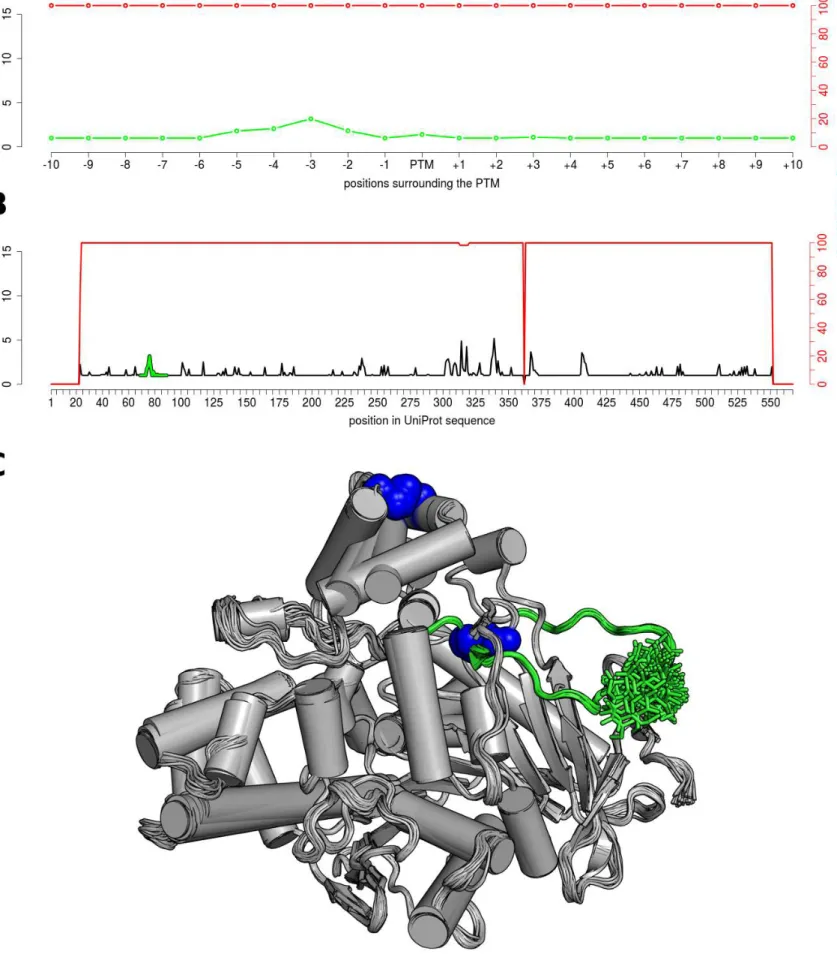
The Neq profiles of modified sites and surrounding positions were compared with those of all other positions in the proteins. Figure 3 shows the example of one N-glycosylated residue, at position 141, in renin endopeptidase. Figure 3A is a zoom around the PTM site, while Figure 3B shows the Neq all along the protein. In this example, the maximum entropy is found at position 234, with a Neq value of 7.13. This position and its surroundings are associated with the maximum number of missing residues (red curves in Figure 3B), underlining a highly flexible region. It corresponds to what Zhang et al. defined as a Dual Personality Fragments (DPF): a protein region, which appears either ordered or disordered in crystal structures. It is suggested that DPFs are potential targets of regulation by allostery or PTMs (Zhang et al. 2007). Here, this flexible region (position 230-238, see red fragment in Figure 3C) is not annotated as PTM site, and also does not interact with ligands in the structures; but interestingly it includes 4 positions (230 to 234) known to be missing in a second isoform of this protein.
In comparison, the backbone of the modified residue is always ordered and presents slight deformations with Neq of 1.94. Its immediate neighbor positions are in the same range, with slightly higher values in positions -6, -1, and +1 (Neq values 2.58, 2.10, and 2.53 respectively).
In Figure 3A, the PTM site seems to be slightly more deformable than majority of its surrounding positions. Using a larger scale (Figure 3B) this deformation does not seems to be significantly different than other deformable parts along the sequence. To quantify it precisely, statistical tests were performed for each case (see Table 1, Figure 4, Supplementary Figures S4 and S5).
Firstly, the Shapiro-Wilk (SK) test provides extremely low p-value, in all the cases, forcing the rejection of the null hypothesis (see columns 3 and 4 of Table 1). This underlines that Neq values for PTM-region and the rest of the protein does not follow a normal distribution. Further, the nonparametric Mann-Whitney-Wilcoxon test was used to see if Neq profiles observed in the PTM-region are significantly different from those observed in the rest of the protein. With a type I error α = 5%, only the phosphorylated Thr-160 in the Cyclin-dependent kinase 2 protein and its neighboring positions have a significantly different Neq profile than the rest of the protein; the p-value being equal to 0.012.
It should be noted that in both cases of N-glycosylation, no significant differences were observed between the Neq profile of the PTM-region and the Neq profile of the rest of the protein.
In comparison to Neq, the B-factor does not give a measure of the deformation of the backbone, but could be used to represent its mobility in the crystal context. For each of the 4 proteins of interest, the B-factors of the Cα were extracted from every PDB chain. After normalization (see Methods), the B-factors were averaged for each, structurally available, position along the sequence. The same statistical analyses, as applied to Neq, were performed with the B-factors in order to compare the backbone mobility in the PTM areas, and in the rest of the protein (see Supplementary Figure S6 and Supplementary Table S4).
Local and global backbone diversity compared between modified and unmodified proteins. To determine if Neq profiles observed on all positions are due to the presence of the PTM in the structure, the Neq calculations were also performed on X-ray structures without PTMs (see Supplementary Table S3).
For two of these proteins, the renin endopeptidase (P00797) and the carboxylesterase (P23141), the local and global Neq profiles, observed in presence of the N-glycosylation, are very similar to the one computed in their absence (see Figure 3, Supplementary Figures S4, S7 and S8). This highlights that the attached glycans on the structures do not impact the intrinsic flexibility of these two proteins.
This is supported by the Mann-Whitney-Wilcoxon test (see Table 1), which do not provides very low p-values when comparing local and global Neq profiles. An explanation could be the presence of several disulphide bonds stabilizing the structures (indicated in blue sphere in Figure 3C and S4C). Also, glycans are solvent oriented that limits their interactions with the rest of the protein.
On the contrary, the other two proteins, CDK 2 (P24941) and actin (P68135), present Neq profiles significantly different when the residues, Thr 160 and His 75 respectively, are not modified (see Figure 4 and Supplementary Figures S5, S9 and S10). This is also supported by the Mann-Whitney-Wilcoxon test (see Table 1).
For actin, the PTM of interest is the methylation of the Histidine 75 (H75). In this case, the both profiles with and without the PTM (see Supplementary Figures S5 and S9 respectively) show peaks at similar positions. But these peaks differ in intensity in a way that the whole actin protein seems to be more rigid when the PTM is present (lower Neq values). However, the majority of the actin structures used for the analysis interact with ligands. These ligands are from different types (such as ADP, ATP, swinholide A, pectenotoxin 2, etc, see Supplementary Figure S11), and bind at multiple sites. The lack of consistency in the number,
the types and the binding modes of the ligands across the structures make it difficult to conclude on the exclusive effect of H75 methylation. Nonetheless, from a local point of view, the ligands do not interact with the modified Histidine and its direct surroundings. At the -1 and +1 positions (see Supplementary Figures S5A and S9A), a clear difference in the Neq value could be observed. The values increase from 1.96 to 3.95 for position -1, and from 1.63 to 2.43 for position +1. Regardless the overall rigidity of the backbone, the methylation increases the deformation in the direct neighborhood of the PTM site.
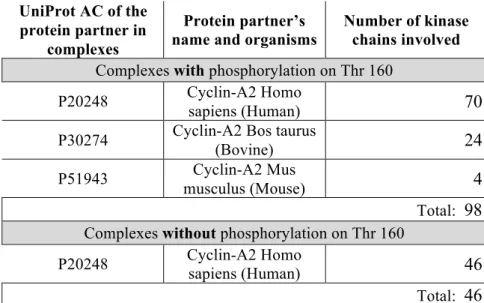
The analysis of cyclin-dependent kinase 2 structures indicates an effect of the presence of the PTM on the flexibility. Here the PTM of interest is the phosphorylation of threonine 160. This modification is always observed in X-ray structures when the kinase proteins are complexed with protein partners. Therefore, to compare Neq profiles with PTM and without PTMs only chains complexed with Cyclin A2 have been used (see Table 2). As for actin, most of the kinase X-ray structures used (except 3) interact with ligands (see Supplementary Figure S12). However in this case, the ligands bind in the same pocket, regardless that the structures are phosphorylated or not. The consistent binding location makes it possible to compare Neq profiles, in order to investigate the PTM effect in flexibility.
Comparison of both Neq profiles (with and without modification) shows some significant differences. A striking one is observed at the site of modification (position 160) and its surrounding positions. In the absence of the phosphorylation (see Supplementary Figure S10), this area corresponds to a wide flexible loop, sometimes not even ordered in few structures (see red line). Nonetheless, in the presence of the phosphorylation, the Neq value in position +1 drops from 5.27 to 2.40, indicating an increase in rigidity. On the contrary, the region between positions 8 and 18 shows an increase of flexibility when the modification is present; values change from 3.89 to 6.52 for the two highest points. These points correspond to the direct vicinity of two other phosphorylation sites (annotated) at Thr-14 and Tyr-15.
From a functional point of view, the phosphorylation of Thr-160 is known to promote kinase activity, whereas the phosphorylation of Thr-14 and Tyr-15 are known to reduce its activity (Gu et al. 1992; Welburn et al. 2007). Thus the change in flexibility observed in these three phosphorylation sites, affirms the hypothesis of a regulatory mechanism in CDK2 involving coupled stiffening - flexibility pathway, an indicative of underlying allostery. A second area centered on the Thr-39 shows the exact same behavior as the first region. In the same way the phosphorylation of Thr-160 lead to an allosteric effect, which increases the flexibility of this region. The position 39 is also a phosphorylation site, which is not related to the kinase activity, but is implicated in the CDK2 intracellular localization and the cell apoptosis (Maddika et al. 2008). It is also interesting to note that Tyr-19, also annotated as phosphorylation site (Oppermann et al. 2009), does not undergo significant change in flexibility; the Neq value goes from 1.0 to 1.06 respectively in the absence and presence of the PTM.
Analyses of normalized B-factors (see Supplementary Figures S6 and S13) for all cases do not show any significant deviation. The presence of any of the three PTM types studied here (N-glycosylation, methylation, and phosphorylation) does not affect the mobility of the whole structure in crystals. The Mann-Whitney-Wilcoxon test supported it (see Supplementary Table S4). However in a local point of view, we can observe a variation of normalized B-factor from 1 to 2 on the surrounding of the phosphorylation site in CDK 2 (see Supplementary Figures S6C and S13C). It is interesting to note that, in this position, the decrease in mobility (B-factor) is associated with a decrease in deformability, namely Neq.
Discussion
As noted in different seminal papers (Berezovsky et al. 2017), the variety of known PTMs are around half-thousand, even if everybody agrees on their importance, questions
about precise occurrence, impact on biological functions, implication in the evolution, and even modifying enzymes for many PTMs are yet to be answered (Sirota et al. 2015).
Using various datasets extracted from PTM-SD (Craveur et al. 2014), we were able to analyze the effects of some specific PTMs on protein backbone conformation. We first measured the conformational backbone diversity of modified residues and its close neighborhood positions for the two most frequent PTMs, N-glycosylation and phosphorylation. Secondly, we focused our analyses on 4 different proteins, and compared the local and global backbone diversity observed in X-ray data when one PTM is present. Finally, for these 4 cases, the backbone diversity with and without the PTM was compared.
In a non-redundant dataset of X-ray structures, N-glycosylation sites do not present particular structural characteristics related to the presence of the modification. In other words, the asparagine residues do not adopt a different backbone conformation when the glycans are linked in crystals. However, it is interesting to note that in ~1/3 of the times the consensus sequence Asn-X-Ser/Thr just precedes a local β-strand conformation.
In the case of phosphorylation, the modified residues were also observed in a wide set of backbone conformations, but exhibits preference for the β-strand conformation (PB d) in the case of Serine and Threonine. On the contrary, Phospho-Tyrosine doesn’t exhibit any preferences.
For the 4 examples of protein with single PTM (N-glycosylation in renin endopeptidase and liver carboxylesterase, phosphorylation in CDK 2, and methylation in actin), we observed that only the phosphorylation site and its neighborhood positions display a backbone diversity that is significantly different than the rest of the proteins. By comparing with structures of unmodified CDK2, the presences of the phosphorylation on the activation loop at Thr160 have several local effects. It rigidified (potential stabilization) the backbone (lower Neq and lower B-factor) locally while increasing the deformation (potential
destabilization) of two other regions, near Thr14-Tyr15, and near Thr39, three other phosphorylation sites related to CDK2 activity and subcellular localization respectively. The observed rigidity in the backbone is in agreement with the proposition made by Xin and Radivojac (Xin and Radivojac 2012) that phosphorylation, by introducing new H-bond and salt bridges in the local neighborhood leads to a conformational shift of the lowest valley in the energy landscape of the protein. This decrease of energy was also observed by Groban and coworkers (Groban et al. 2006) in their attempt to predict the conformation changes of the CDK2 activation loop induced by the phosphorylation using computational methods. This methodology was quite inventive, using a hierarchical loop prediction algorithm optimizing dihedral angle backbone sampling, linked to rotamer-based side chain optimization, and an all-atom force field and a Generalized Born solvation model to predict the structural consequences of phosphorylation. Finally Gao and Xu (Gao and Xu 2012) suggest, by analyzing NMR structures, that disorder-to-order transition might be introduced by Threonine phosphorylation.
In our datasets numerous PDB structures lack coordinates for some regions, which was depicted by a dip of the red curves in Neq plots. These particular regions mainly correspond to disorder regions in protein, which diversify the functional spectrum of proteins (DeForte and Uversky 2016) by expanding their partnered interactions with other proteins, collectively termed as protein-protein interactions (PPI). The selectivity of interacting partners and order-disorder transition of the protein structures is regulated by PTMs, and most of the times by phosphorylations. (Hsu et al. 2013). During our analysis of CDK2, we also found identical structures with missing coordinates in the catalytic loop (functional domain), flagged as a Dual Personality Fragment (Zhang et al. 2007). However, this region gets ordered based on the phosphorylation of threonine 160. We may suggest that the number of phosphorylations, in and around the catalytic domain, may also impact this selectivity of interacting partners for
CDK2.
The example of actin methylation shows an opposite effect of the modification compared to the example of CDK2. The methylation induces a local increase of the backbone diversity at the PTM site region, highlighting a higher deformation of this part of the protein. Interestingly no effect on the intrinsic mobility of this region has been observed (same B-factor profiles with or without the PTM). Unfortunately, the large variability of ligands found in the X-ray data of actin used in this study, does not allow suggesting an effect of the methylation at a global scale.
Finally for the two examples of N-glycosylation, we concluded that the addition of the glycan neither impact the local, neither global, backbone conformation of the proteins.
Despite the intrinsic linked between PTM and protein function, the molecular effects of the modifications on the protein structures and dynamics remains poorly understood. Our study, like previous systematic studies of structural data of modified and unmodified protein (Gao and Xu 2012; Xin and Radivojac 2012), shows that these effects could be of multiple types (stabilization and destabilization), at different scales (at the local PTM region, in other part of the protein as allosteric effect, or at a global level), and depend of the PTM types. However, in order to propose general rules for the molecular impact of each type of PTMs, additional structural data related to the large amount of PTM annotations already available are needed. In the scope of a systematic study, these data have to be used carefully. Indeed, many factors, independent of the presence of PTMs, could have affected the structure of the proteins, such as the crystallographic packing, the presence of engineer mutations or cross-links to help crystallization process, the presence of ions, ligands and protein partners in contact with the protein structure of interest. It must be noticed that a recent paper provides interesting insight in how to look at B-factors that could be very useful for future studies (Carugo 2018).
Molecular modeling of PTMs combines with molecular dynamic simulation is an interesting alternative. Some recent computational studies have investigate the effect of PTMs (Audagnotto and Dal Peraro 2017) on the stability of specific proteins, but the growing success of these kind of simulations also rely upon the growing number of experimental data, for the development of accurate PTM force field parameters.
Acknowledgments
This work was supported by grants from the Ministry of Research (France), University of Paris Diderot, Sorbonne Paris Cité, National Institute for Blood Transfusion (INTS, France), Institute for Health and Medical Research (INSERM, France). PC acknowledges grant from French Ministry of Research. Calculations were done on SGI cluster granted by Conseil Régional - Ile de France and INTS (SESAME Grant). The authors were granted access to high performance computing (HPC) resources at the French National Computing Center CINES under grant no. c2013037147 funded by the GENCI (Grand Equipement National de Calcul Intensif). TN and AdB acknowledges to Indo-French Centre for the Promotion of Advanced Research / CEFIPRA for collaborative grant (number 5302-2). This study was supported by grant from Laboratory of Excellence GR-Ex, reference ANR-11-LABX-0051. The labex GR-Ex is funded by the program Investissements d’avenir of the French National Research Agency, reference ANR-11-IDEX-0005-02. This work is supported by a grant from the French National Research Agency (ANR): NaturaDyRe (ANR-2010-CD2I-014-04) to JR and AdB.
The funding bodies have no role in the design of the study and collection, analysis, and interpretation of data and in writing the manuscript.
Ethical statements
All authors have been personally and actively involved in substantive work leading to the manuscript, and will hold themselves jointly and individually for its contents.
This material has not been published in whole or in part elsewhere.
LEGENDS:
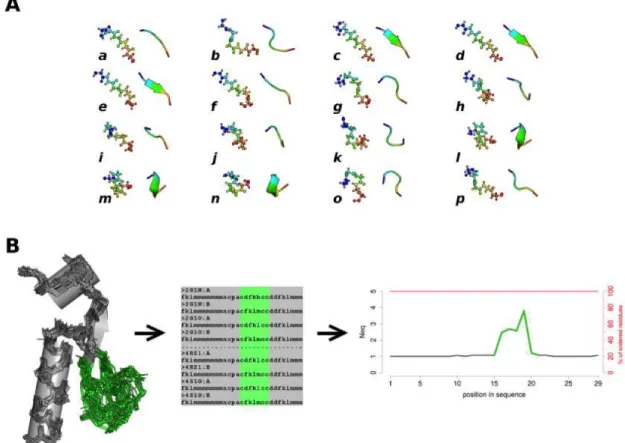
Figure 1. The Protein Blocks (PB) structural alphabet and the Neq. (A) The structural
alphabet is composed of 16 PBs, labeled from a to p. Each PB represents the backbone conformation of a fragment of 5 residues in length, here showed in ball-and-stick and cartoon representations and colored from blue to red, from N-ter to C-ter respectively. (B) Neq is an entropic measure of the backbone conformation, taking value from 1 to 16 (see Methods). Here the backbone conformations of the deformable loop (in green) could be described with numerous sequences of PBs. Plotting the Neq on a graph provides an easy way to compare the backbone diversity of a protein along the sequence.
Figure 2. Neq profile for N-glycosylation and phosphorylation sites. The Neq profile is shown in black in the vicinity of N-glycosylation (A) and phosphorylation sites (B). The red lines indicate the amount of data used to compute Neq values, or in other words the percentage of ordered residues at each position in the X-ray crystals.
Figure 3. N-glycosylation on the Asn141 of the human renin endopeptidase (P00797) The Neq profiles are given at a local scale (A), for the surrounding positions of the PTM site (color in green), and at a global scale (B), for all sequence positions. (C) The 80 structures used for the computation were aligned on the backbone, and represented in cartoon. The glycosylated position is shown in green sticks, the disulphide-bridges in blue spheres, and the DPF loop color in red.
Figure 4. Phosphorylation on Thr160 of human cyclin-dependent kinase 2 (P24941) The Neq profiles are given at a local scale (A), for the surrounding positions of the PTM site (coloured in green), and at a global scale (B), for all sequence positions. (C) The 96 structures used for the computation were aligned on the backbone, and represented as cartoon. The phosphorylated position is shown in green sticks.
References
Audagnotto M, Dal Peraro M (2017) Protein post-translational modifications: In silico prediction tools and molecular modeling Comput Struct Biotechnol J 15:307-319 doi:10.1016/j.csbj.2017.03.004
Bannister AJ, Kouzarides T (2011) Regulation of chromatin by histone modifications Cell Res 21:381-395 doi:10.1038/cr.2011.22
Barnoud J, Santuz H, Craveur P, Joseph AP, Jallu V, de Brevern AG, Poulain P (2017) PBxplore: A Tool To Analyze Local Protein Structure And Deformability With Protein Blocks PeerJ:in press doi:10.1101/136408
Berezovsky IN, Guarnera E, Zheng Z, Eisenhaber B, Eisenhaber F (2017) Protein function machinery: from basic structural units to modulation of activity Curr Opin Struct Biol 42:67-74 doi:10.1016/j.sbi.2016.10.021
Betts MJ et al. (2017) Systematic identification of phosphorylation-mediated protein
interaction switches PLoS Comput Biol 13:e1005462
doi:10.1371/journal.pcbi.1005462
Brooks CL, Gu W (2003) Ubiquitination, phosphorylation and acetylation: the molecular basis for p53 regulation Curr Opin Cell Biol 15:164-171
Burra PV, Zhang Y, Godzik A, Stec B (2009) Global distribution of conformational states derived from redundant models in the PDB points to non-uniqueness of the protein structure Proc Natl Acad Sci U S A 106:10505-10510 doi:10.1073/pnas.0812152106 Butt AS, Abbas Z, Jafri W (2012) Hepatocellular carcinoma in pakistan: where do we stand?
Hepat Mon 12:e6023 doi:10.5812/hepatmon.6023
Carugo O (2018) Atomic displacement parameters in structural biology Amino Acids 50:775-786 doi:10.1007/s00726-018-2574-y
Craveur P, Joseph AP, Rebehmed J, de Brevern AG (2013) beta-Bulges: extensive structural analyses of beta-sheets irregularities Protein Sci 22:1366-1378 doi:10.1002/pro.2324 Craveur P, Rebehmed J, de Brevern AG (2014) PTM-SD: a database of structurally resolved
and annotated posttranslational modifications in proteins Database (Oxford) 2014 doi:10.1093/database/bau041
Creixell P, Linding R (2012) Cells, shared memory and breaking the PTM code Mol Syst Biol 8:598 doi:10.1038/msb.2012.33
Danielsen JM et al. (2011) Mass spectrometric analysis of lysine ubiquitylation reveals promiscuity at site level Mol Cell Proteomics 10:M110 003590 doi:10.1074/mcp.M110.003590
de Brevern AG, Etchebest C, Hazout S (2000) Bayesian probabilistic approach for predicting backbone structures in terms of protein blocks Proteins 41:271-287
DeForte S, Uversky VN (2016) Order, Disorder, and Everything in Between Molecules 21 doi:10.3390/molecules21081090
Delano WL (2013) The PyMOL Molecular Graphics System on World Wide Web. http://www.pymol.org
Deribe YL, Pawson T, Dikic I (2010) Post-translational modifications in signal integration Nat Struct Mol Biol 17:666-672 doi:10.1038/nsmb.1842
Dewald JH, Colomb F, Bobowski-Gerard M, Groux-Degroote S, Delannoy P (2016) Role of Cytokine-Induced Glycosylation Changes in Regulating Cell Interactions and Cell Signaling in Inflammatory Diseases and Cancer Cells 5 doi:10.3390/cells5040043 Djinovic-Carugo K, Carugo O (2015) Missing strings of residues in protein crystal structures
Intrinsically Disord Proteins 3:e1095697 doi:10.1080/21690707.2015.1095697
protein interaction networks PLoS Comput Biol 11:e1004049 doi:10.1371/journal.pcbi.1004049
Dudev M, Lim C (2007) Discovering structural motifs using a structural alphabet: application to magnesium-binding sites BMC Bioinformatics 8:106 doi:10.1186/1471-2105-8-106 Etchebest C, Benros C, Hazout S, de Brevern AG (2005) A structural alphabet for local
protein structures: Improved prediction methods Proteins:810-827
Fuxreiter M, Tompa P (2012) Fuzzy complexes: a more stochastic view of protein function Adv Exp Med Biol 725:1-14 doi:10.1007/978-1-4614-0659-4_1
Gao J, Xu D (2012) Correlation between posttranslational modification and intrinsic disorder in protein Pac Symp Biocomput:94-103
Gelly JC, de Brevern AG (2011) Protein Peeling 3D: new tools for analyzing protein structures Bioinformatics 27:132-133 doi:btq610 [pii]
10.1093/bioinformatics/btq610
Gianazza E, Parravicini C, Primi R, Miller I, Eberini I (2016) In silico prediction and characterization of protein post-translational modifications J Proteomics 134:65-75 doi:10.1016/j.jprot.2015.09.026
Groban ES, Narayanan A, Jacobson MP (2006) Conformational changes in protein loops and helices induced by post-translational phosphorylation PLoS Comput Biol 2:e32 doi:10.1371/journal.pcbi.0020032
Gu Y, Rosenblatt J, Morgan DO (1992) Cell cycle regulation of CDK2 activity by phosphorylation of Thr160 and Tyr15 EMBO J 11:3995-4005
Gupta R, Birch H, Rapacki K, Brunak S, Hansen JE (1999) O-GLYCBASE version 4.0: a revised database of O-glycosylated proteins Nucleic Acids Res 27:370-372
Hendriks IA, Vertegaal AC (2016) A comprehensive compilation of SUMO proteomics Nat Rev Mol Cell Biol 17:581-595 doi:10.1038/nrm.2016.81
Hinsen K (2008) Structural flexibility in proteins: impact of the crystal environment Bioinformatics 24:521-528 doi:10.1093/bioinformatics/btm625
Hornbeck PV, Zhang B, Murray B, Kornhauser JM, Latham V, Skrzypek E (2015) PhosphoSitePlus, 2014: mutations, PTMs and recalibrations Nucleic Acids Res 43:D512-520 doi:10.1093/nar/gku1267
Hsu WL et al. (2013) Exploring the binding diversity of intrinsically disordered proteins involved in one-to-many binding Protein Sci 22:258-273 doi:10.1002/pro.2207
Huang KY et al. (2016) dbPTM 2016: 10-year anniversary of a resource for post-translational modification of proteins Nucleic Acids Res 44:D435-446 doi:10.1093/nar/gkv1240 Humphrey SJ, James DE, Mann M (2015) Protein Phosphorylation: A Major Switch
Mechanism for Metabolic Regulation Trends Endocrinol Metab 26:676-687 doi:10.1016/j.tem.2015.09.013
Imberty A (1997) Oligosaccharide structures: theory versus experiment Curr Opin Struct Biol 7:617-623
Imberty A, Perez S (1995) Stereochemistry of the N-glycosylation sites in glycoproteins Protein Eng 8:699-709
Joseph AP, Srinivasan N, de Brevern AG (2012) Progressive structure-based alignment of homologous proteins: Adopting sequence comparison strategies Biochimie 94:2025-2034 doi:S0300-9084(12)00216-7 [pii]
10.1016/j.biochi.2012.05.028
Kamath KS, Vasavada MS, Srivastava S (2011) Proteomic databases and tools to decipher post-translational modifications J Proteomics 75:127-144 doi:10.1016/j.jprot.2011.09.014
statistics: frequency analysis and curation of the swiss-prot database Sci Rep 1 doi:10.1038/srep00090
Kohonen T (1982) Self-organized formation of topologically correct feature maps Biol Cybern 43:59-69
Kohonen T (2001) Self-Organizing Maps (3rd edition). Springer,
Krupa A, Preethi G, Srinivasan N (2004) Structural modes of stabilization of permissive phosphorylation sites in protein kinases: distinct strategies in Ser/Thr and Tyr kinases J Mol Biol 339:1025-1039 doi:10.1016/j.jmb.2004.04.043
Latham JA, Dent SY (2007) Cross-regulation of histone modifications Nat Struct Mol Biol 14:1017-1024 doi:10.1038/nsmb1307
Li S, Iakoucheva LM, Mooney SD, Radivojac P (2010) Loss of post-translational modification sites in disease Pac Symp Biocomput:337-347
Linding R, Jensen LJ, Diella F, Bork P, Gibson TJ, Russell RB (2003) Protein disorder prediction: implications for structural proteomics Structure 11:1453-1459
Lopez Y et al. (2017) SucStruct: Prediction of succinylated lysine residues by using structural properties of amino acids Anal Biochem 527:24-32 doi:10.1016/j.ab.2017.03.021 Lorenzo JR, Alonso LG, Sanchez IE (2015) Prediction of Spontaneous Protein Deamidation
from Sequence-Derived Secondary Structure and Intrinsic Disorder PLoS One 10:e0145186 doi:10.1371/journal.pone.0145186
Lu Z, Cheng Z, Zhao Y, Volchenboum SL (2011) Bioinformatic analysis and post-translational modification crosstalk prediction of lysine acetylation PLoS One 6:e28228 doi:10.1371/journal.pone.0028228
Maddika S, Ande SR, Wiechec E, Hansen LL, Wesselborg S, Los M (2008) Akt-mediated phosphorylation of CDK2 regulates its dual role in cell cycle progression and apoptosis J Cell Sci 121:979-988 doi:10.1242/jcs.009530
Martin L, Latypova X, Terro F (2011) Post-translational modifications of tau protein: implications for Alzheimer's disease Neurochem Int 58:458-471 doi:10.1016/j.neuint.2010.12.023
McIntyre JC, Joiner AM, Zhang L, Iniguez-Lluhi J, Martens JR (2015) SUMOylation regulates ciliary localization of olfactory signaling proteins J Cell Sci 128:1934-1945 doi:10.1242/jcs.164673
Mijakovic I, Grangeasse C, Turgay K (2016) Exploring the diversity of protein modifications: special bacterial phosphorylation systems FEMS Microbiol Rev 40:398-417 doi:10.1093/femsre/fuw003
Minguez P, Bork P (2017) Bioinformatics Analysis of Functional Associations of PTMs Methods Mol Biol 1558:303-320 doi:10.1007/978-1-4939-6783-4_14
Minguez P, Letunic I, Parca L, Bork P (2013) PTMcode: a database of known and predicted functional associations between post-translational modifications in proteins Nucleic Acids Res 41:D306-311 doi:10.1093/nar/gks1230
Minguez P et al. (2012) Deciphering a global network of functionally associated post-translational modifications Mol Syst Biol 8:599 doi:10.1038/msb.2012.31
Moremen KW, Tiemeyer M, Nairn AV (2012) Vertebrate protein glycosylation: diversity, synthesis and function Nat Rev Mol Cell Biol 13:448-462 doi:10.1038/nrm3383 Nussinov R, Tsai CJ, Xin F, Radivojac P (2012) Allosteric post-translational modification
codes Trends Biochem Sci 37:447-455 doi:10.1016/j.tibs.2012.07.001
Oppermann FS et al. (2009) Large-scale proteomics analysis of the human kinome Mol Cell Proteomics 8:1751-1764 doi:10.1074/mcp.M800588-MCP200
Piovesan D et al. (2017) DisProt 7.0: a major update of the database of disordered proteins Nucleic Acids Res 45:D219-D227 doi:10.1093/nar/gkw1056
R Core Team (2013) R: A language and environment for statistical computing. R Foundation for Statistical Computing, Vienna, Austria.
Rabiner LR (1989) A tutorial on hidden Markov models and selected application in speech recognition Proceedings of the IEEE 77:257-286
Rangwala H, Kauffman C, Karypis G (2009) svmPRAT: SVM-based protein residue annotation toolkit BMC Bioinformatics 10:439 doi:1471-2105-10-439 [pii]
10.1186/1471-2105-10-439
Schlessinger A, Rost B (2005) Protein flexibility and rigidity predicted from sequence Proteins 61:115-126 doi:10.1002/prot.20587
Schuchhardt J, Schneider G, Reichelt J, Schomburg D, Wrede P (1996) Local structural motifs of protein backbones are classified by self-organizing neural networks Protein Eng 9:833-842
Sirota FL, Maurer-Stroh S, Eisenhaber B, Eisenhaber F (2015) Single-residue posttranslational modification sites at the N-terminus, C-terminus or in-between: To be or not to be exposed for enzyme access Proteomics 15:2525-2546 doi:10.1002/pmic.201400633
Smith DK, Radivojac P, Obradovic Z, Dunker AK, Zhu G (2003) Improved amino acid flexibility parameters Protein Sci 12:1060-1072 doi:10.1110/ps.0236203
Tokmakov AA, Kurotani A, Takagi T, Toyama M, Shirouzu M, Fukami Y, Yokoyama S (2012) Multiple post-translational modifications affect heterologous protein synthesis J Biol Chem 287:27106-27116 doi:10.1074/jbc.M112.366351
Torres MP, Dewhurst H, Sundararaman N (2016) Proteome-wide Structural Analysis of PTM Hotspots Reveals Regulatory Elements Predicted to Impact Biological Function and Disease Mol Cell Proteomics 15:3513-3528 doi:10.1074/mcp.M116.062331
van Noort V et al. (2012) Cross-talk between phosphorylation and lysine acetylation in a genome-reduced bacterium Mol Syst Biol 8:571 doi:10.1038/msb.2012.4
Vodermaier HC (2004) APC/C and SCF: controlling each other and the cell cycle Curr Biol 14:R787-796 doi:10.1016/j.cub.2004.09.020
Vucetic S, Xie H, Iakoucheva LM, Oldfield CJ, Dunker AK, Obradovic Z, Uversky VN (2007) Functional anthology of intrinsic disorder. 2. Cellular components, domains, technical terms, developmental processes, and coding sequence diversities correlated with long disordered regions J Proteome Res 6:1899-1916 doi:10.1021/pr060393m Welburn JP et al. (2007) How tyrosine 15 phosphorylation inhibits the activity of
cyclin-dependent kinase 2-cyclin A J Biol Chem 282:3173-3181 doi:10.1074/jbc.M609151200
Wu CY, Chen YC, Lim C (2010) A structural-alphabet-based strategy for finding structural motifs across protein families Nucleic Acids Res 38:e150 doi:10.1093/nar/gkq478 Wuyun Q, Zheng W, Zhang Y, Ruan J, Hu G (2016) Improved Species-Specific Lysine
Acetylation Site Prediction Based on a Large Variety of Features Set PLoS One 11:e0155370 doi:10.1371/journal.pone.0155370
Xie H, Vucetic S, Iakoucheva LM, Oldfield CJ, Dunker AK, Obradovic Z, Uversky VN (2007a) Functional anthology of intrinsic disorder. 3. Ligands, post-translational modifications, and diseases associated with intrinsically disordered proteins J Proteome Res 6:1917-1932 doi:10.1021/pr060394e
Xie H, Vucetic S, Iakoucheva LM, Oldfield CJ, Dunker AK, Uversky VN, Obradovic Z (2007b) Functional anthology of intrinsic disorder. 1. Biological processes and functions of proteins with long disordered regions J Proteome Res 6:1882-1898 doi:10.1021/pr060392u
changes to protein structure Bioinformatics 28:2905-2913 doi:10.1093/bioinformatics/bts541
Yao Q, Xu D (2017) Bioinformatics Analysis of Protein Phosphorylation in Plant Systems Biology Using P3DB Methods Mol Biol 1558:127-138 doi:10.1007/978-1-4939-6783-4_6
Zeidan Q, Hart GW (2010) The intersections between O-GlcNAcylation and phosphorylation: implications for multiple signaling pathways J Cell Sci 123:13-22 doi:10.1242/jcs.053678
Zhang Y, Stec B, Godzik A (2007) Between order and disorder in protein structures: analysis of "dual personality" fragments in proteins Structure 15:1141-1147 doi:10.1016/j.str.2007.07.012
Zhao S et al. (2010) Regulation of cellular metabolism by protein lysine acetylation Science 327:1000-1004 doi:10.1126/science.1179689
Zhou B, Zeng L (2016) Conventional and unconventional ubiquitination in plant immunity Mol Plant Pathol doi:10.1111/mpp.12521
Zimmermann O, Hansmann UH (2008) LOCUSTRA: accurate prediction of local protein structure using a two-layer support vector machine approach J Chem Inf Model 48:1903-1908 doi:10.1021/ci800178a
Normal law distribution, while Mann-Whitney-Wilcoxon (MWW) is a nonparametric test that compared mean values. Are indicated the size of samples (n), the calculated statistics (stats), and the p-values. The chosen risk α is equal to 5%, the significant p-values allow dismissing the hypothesis H0 and are in italics.
SW
Neq PTM region vs
Normal law
SW
Neq rest of the
protein vs Normal law
MWW
Neq PTM region vs Neq rest of the
protein
SW
Neq all protein with 0
PTM vs Normal law
SW
Neq all protein with 1
PTM vs Normal law MWW Neq 0 PTM vs Neq 1 PTM Renin endopeptidase P00797 (Human) N-glycosylation n 21 316 21/316 364 337 364/337 Statistic 0.6790 0.4312 3571 0.5276 0.4429 59812.5
p-value 1.52E-05 2.16E-30 5.08E-01 4.52E-30 5.34E-31 5.13E-01
Liver carboxylesterase 1 P23141 (Human) N-glycosylation n 21 507 21/507 529 528 529/528 Statistic 0.5522 0.4383 5582 0.4762 0.4436 138025.5
p-value 6.40E-07 6.52E-37 6.19E-01 1.26E-36 2.12E-37 6.60E-01
Cyclin-dependent kinase P24941 (Human) phosphorylation n 21 275 21/275 296 296 296/296 Statistic 0.6792 0.4102 3687 0.4927 0.4299 39350
p-value 1.53E-05 5.10E-29 1.94E-02 3.06E-28 1.44E-29 1.32E-02
Actin P68135 (Rabbit)
methylation
n 21 350 21/350 371 371 371/371
Statistic 0.7082 0.7201 3758 0.6745 0.7174 78367.5
p-value 3.49E-05 8.32E-24 8.53E-01 4.34E-26 1.42E-24 7.17E-04
Table 2. Occurrence of the different chains of human Cyclin-dependent Kinase 2 (Id:
P24941) in different cyclin A2 complexes. UniProt AC of the
protein partner in complexes
Protein partner’s name and organisms
Number of kinase chains involved
Complexes with phosphorylation on Thr 160
P20248 Cyclin-A2 Homo
sapiens (Human) 70
P30274 Cyclin-A2 Bos taurus (Bovine) 24 P51943 musculus (Mouse)Cyclin-A2 Mus 4 Total: 98 Complexes without phosphorylation on Thr 160
P20248 Cyclin-A2 Homo sapiens (Human) 46 Total: 46
Figure S1. Protein Blocks profile. The PB distributions of the complete analysis in case of
A) N-glycosylation and B) Phosphorylation. The color is represented as per the intensity
Figure S2. Flexibility profile for different Phosphorylations. N
eqdistribution curves (black)
gives an insight into the extent of local structural changes at the phosphorylation site and its
sequential neighbourhood. The red curve represents the percentage of available data for
Figure S3. Protein Blocks profile for phosphorylations. The PB distributions of the complete
Figure S4. Structural Analysis of Carboxylesterase 1. A) The Neq profile of the N-linked
Glycosylation at Asn 79 at its neighbouring positions. B) The entire Neq profile of the
Carboxylesterase chain. The dip in the red curve is interpreted as the absence of data at the position.
Figure S5. Structural Analysis of Actin. A) The N
eqprofile of the methylation of Histidine
residue 75 and its neighbouring positions. B) The entire N
eqprofile of the actin chain. The red
curve depicts the amount of crystal coordinates available for N
eqcalculation. C) The structural
Figure S6. Normalized B-Factor distribution for different PTMs. B-factors are used to assess the
extent of flexible motions present in the crystal structure. The B-factor trends match with the trends
observed in N
eqanalysis. Here normalized B-factor are represented for all proteins used in the
current study, containing different PTMs. P00797 (Renin endopeptidase, N-glycosylation), P23141
(Liver carboxylesterase 1, N-glycosylation), P24941 (Cyclin dependent kinase 2, phosphorylation),
eq eq
the PTM position (in green) with the occurrence of non-missing residue (in red). B. Same information on the complete sequence, Neq is in black except for the PTM position (in green, see A).
eq
eq
represented for all proteins used in the current study, without any PTMs. P00797 (Renin endopeptidase, N-glycosylation), P23141 (Liver carboxylesterase 1, N-N-glycosylation), P24941 (Cyclin dependent kinase 2,
N-glycosylation, phosphorylation and methylation. The table indicates the details of the dataset with diversity indicated as no. of different source organisms, size depicted by the no. of chains and quality of data is indicated by No. of PTM. Similar statistic is also given for the derived non-redundant dataset (in columns 5 to 7).
PTM type Whole data Non-redundant dataset
Number of organisms Number of chains Number of PTMs Number of organisms Number of chains Number of PTMs N-glycosylation 100 3092 7110 41 156 348 phosphorylation 22 1 308 1 874 12 75 92 methylation 21 584 886 9 15 19
different kind of phosphorylation modifications, built using PTM-SD. The diversity of the data is indicated by the no. of different source organisms, size depicted by the no. of chains and quality of data is indicated by No. of PTM. Similar statistics is also given for the derived non-redundant dataset (in columns 5 to 7).
PTM type Whole data Non-redundant data
Number of organisms Number of chains Number of PTMs Number of organisms Number of chains Number of PTMs phospho-serine 14 498 618 8 45 57 phospho-threonine 11 561 611 7 29 29 phospho-tyrosine 6 453 638 6 30 34
they are selected to study the impact of PTM on the protein structure. Second Column lists the modification taken into account while third and fourth columns are the number of structures used for comparison of structural impact in presence and absence of the PTM, respectively.
Proteins (UniProt-AC) PTM type and position in sequence Number of chains with PTM Number of chains without PTM Renin endopeptidase P00797 (Human) N-glycosylation on Asn 141 80 49 Liver carboxylesterase 1 P23141 (Human) N-glycosylation on Asn 79 59 17 Cyclin-dependent kinase P24941 (Human) Phosphorylation on Thr 160 96 46 Actin P68135 (Rabbit) Methylation on His 75 39 85
checks if it follows Normal law distribution, while Mann – Whitney - Wilcoxon (MWW) is a nonparametric test that compared mean values. Are indicated the size of samples (n), the calculated statistics (stats), and the p-values. The chosen risk α is equal to 5%, the significant values allow dismissing the hypothesis H0 and are colored in red.
SW
Bfactor rest of the
protein vs Normal law
MWW
Bfactor PTM
region vs Bfactor rest of the protein
SW
Bfactor all protein
with 0 PTM vs Normal law
SW
Bfactor all protein
with 1 PTM vs Normal law MWW Bfactor 0 PTM vs Bfactor 1 PTM Renin endopeptidase P00797 (Human) N-glycosylation n 21 316 21/316 406 406 406/406 Statistic 0.9615 0.9116 4804 0.9447 0.9195 64262
p-value 5.46E-01 1.13E-12 5.90E-04 1.51E-10 1.81E-12 5.20E-01
Liver carboxylesterase 1 P23141 (Human) N-glycosylation n 21 507 21/507 567 567 567/567 Statistic 0.9319 0.9035 4006 0.9033 0.8991 141442
p-value 1.51E-01 2.20E-17 5.46E-02 8.34E-18 3.57E-18 7.19E-01
Cyclin-dependent kinase P24941 (Human) phosphorylation n 21 275 21/275 298 298 298/298 Statistic 0.9045 0.9383 2160.0000 0.9392 0.9351 43323
p-value 4.27E-02 2.61E-09 5.45E-02 1.12E-09 4.26E-10 8.16E-01
Actin P68135 (Rabbit)
methylation
n 21 348 21/348 377 377 377/377
Statistic 0.9340 0.8969 3794 0.8915 0.8949 68532
The experimental methods and resolutions are distributed from the PDB search result page as follow :
For the PTM analysis :
• Experimental Method: o X-ray (387) o Electron Microscopy (8) o Solution NMR (7) o Fiber Diffraction (1) • X-ray Resolution: o less than 1.5 Å (10) o 1.5 - 2.0 Å (82) o 2.0 - 2.5 Å (142) o 2.5 - 3.0 Å (114) o 3.0 and more Å (39)
For the no-PTM analysis :
• Experimental Method o X-ray (306) o Electron Microscopy (7) o Electron Crystallography (1) • X-ray Resolution o less than 1.5 Å (4) o 1.5 - 2.0 Å (153) o 2.0 - 2.5 Å (105) o 2.5 - 3.0 Å (37) o 3.0 and more Å (7) PDB id for PTM : 1A39 1A4G 1AC5 1AGM 1AK0 1AOT 1AQ0 1ATN 1B37 1B5F


![Structures of [M(Ura-H)(Ura)]+ and [M(Ura-H)(H2O)n]+ (M = Cu, Zn, Pb; n = 1–3) complexes in the gas phase by IRMPD spectroscopy in the fingerprint region and theoretical studies](data:image/gif;base64,R0lGODlhAQABAIAAAP///wAAACH5BAEAAAAALAAAAAABAAEAAAICRAEAOw==)