READ THESE TERMS AND CONDITIONS CAREFULLY BEFORE USING THIS WEBSITE. https://nrc-publications.canada.ca/eng/copyright
Vous avez des questions? Nous pouvons vous aider. Pour communiquer directement avec un auteur, consultez la première page de la revue dans laquelle son article a été publié afin de trouver ses coordonnées. Si vous n’arrivez pas à les repérer, communiquez avec nous à [email protected].
Questions? Contact the NRC Publications Archive team at
[email protected]. If you wish to email the authors directly, please see the first page of the publication for their contact information.
NRC Publications Archive
Archives des publications du CNRC
This publication could be one of several versions: author’s original, accepted manuscript or the publisher’s version. / La version de cette publication peut être l’une des suivantes : la version prépublication de l’auteur, la version acceptée du manuscrit ou la version de l’éditeur.
Access and use of this website and the material on it are subject to the Terms and Conditions set forth at Effect of test procedures on compressive strength of masonry prisms
Maurenbrecher, A. H. P.
https://publications-cnrc.canada.ca/fra/droits
L’accès à ce site Web et l’utilisation de son contenu sont assujettis aux conditions présentées dans le site LISEZ CES CONDITIONS ATTENTIVEMENT AVANT D’UTILISER CE SITE WEB.
NRC Publications Record / Notice d'Archives des publications de CNRC:
https://nrc-publications.canada.ca/eng/view/object/?id=7a06b054-6378-4d89-85d7-692a4a0d00b2 https://publications-cnrc.canada.ca/fra/voir/objet/?id=7a06b054-6378-4d89-85d7-692a4a0d00b2
Ser
THl N21d no. 922
National Research Conseil national
Council Canada de recherches Canada
cop. 2
EFFECT
OF TEST PROCEDURES ON
COMPRESSIVE STRENGTH OF MASONRY PRISMS
Reprinted, with permission, from
Proceedings, Second Canadian Masonry Symposium
held in Ottawa 9 11 June 1980 p. 119 132
DBR Paper No. 922
Divirion of Building Rerearch
Price
$1.25OTTAWA
812
1
L'effet de dif ferents facteurs sur la rbsistance
a la compression de petits bchantillons de ma~onnerie (primes) eat v4rifib B l'aide de d e w types de briques d'argile et de deux largeurs de bloc c r e u en bleton. L e s rbsultats d'essai sont ensuite examinSs.
PROCEEDINGS
SECOND CANADIAN MASONRY SYMPOSIUM
OTTAWA, J U N E 9 - 1 1 , 1980
G.T. Suter Sympos ium Chairman
H.
KellerT e c h n i c a l Program Chairman
Pub1 ished by
EFFECT OF TEST PROCEDURES ON
COMPRESSIVE STRENGTH OF MASONRY PRISMS
A.H.P. Maurenbrecher Research Officer
Division of Building Resedrch National Research Council of Canada
ABSTRACT
The effect of different factors on the compressive strength of small masonry specimens (prisms) is checked using two types of clay brick and two widths of hollow concrete block. The test results are re- viewed.
INTRODUCTION
The Canadian masonry design standard for buildings (1) allows two methods of determining compressive strength of masonry: tabular values based on unit strength and mortar type, or axially loaded
prisms such as two-course blockwork stacks. The latter method is more accurate and usually gives higher allowable design stresses, but to have confidence in the result a number of factors (2) should be con- sidered. This paper describes the effects of various factors on prism strength, based on tests in progress at the Division of Building
Research. Some of the factors considered have already been investi- gated (2).
The work is part of a larger masonry test program designed 1) to provide information on the variability of compressive strength and compressive modulus, partly in preparation for the introduction of limit states design for masonry in Canada, 2) to compare the compres- sive strength of small specimens (prisms) with that of large specimens
(walls), and 3) to check the table in the Canadian masonry design standard relating masonry compressive strength to the compressive strength of the units.
The work on prisms has so far considered two types of brick and two sizes of hollow concrete block. It is the purpose of this paper to give an overview of the results of current investigations:
1) Effect of height to thickness ratio
2) Effect of capping
-
dental plaster versus fibreboard3) Face-shell and full mortar bedding 4) Workmanship
5 ) Loading rate
7) Age: 7- versus 28-day strength
Item 3 applies to hollow units; items 4 to 7 have so far been investi- gated only for brick.
MATERIAL PROPERTIES Units
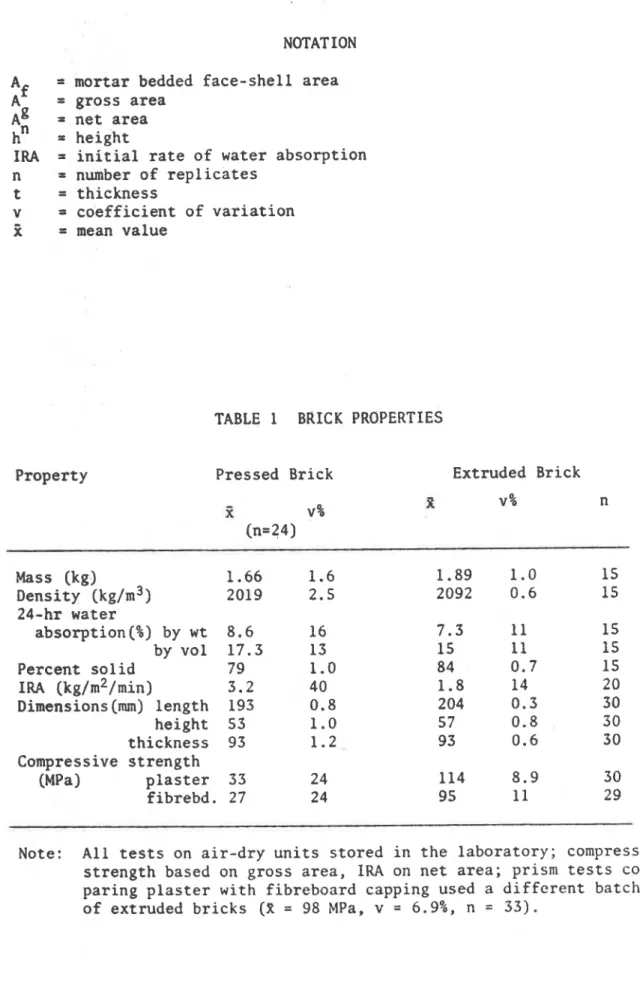
Two clay bricks with three circular perforations were used, one a high- strength extruded brick, the other a low-strength pressed brick.
Their properties are given in Table 1.
The properties of the 140 mm and 190 mm thick, 2-core, autoclaved, hollow concrete blocks are given in Table 2. The wet strength of the block is also given to illustrate the effect of moisture on strength. Mortar
Two mortar mixes were used, with mix proportions by volume of normal portland cement:hydrated 1ime:sand of 1:0.5:4.5 (Type S) for brick- work and 1:1:6 (Type N) for blockwork. The average strength of 50 mrn mortar cubes at 28 days was 10.1 and 6.6 MPa, res ectively (3). The mortar was batched by weight and mixed in a 0.1 m5 (4 cu ft) standard mortar mixer.
CONSTRUCTION
All units were randomly redistributed (except for some inital tests) to ensure a uniform distribution of unit properties before prism con- struction. A minimum of ten (usually twelve) replicates were tested for each factor. Unless otherwise noted, the test specimens were four- course stacks for brickwork and two-course stacks for blockwork. Most prisms were built by a technician using a jig to ensure that the prism was plumb and the coursing correct. Full mortar joints were ensured by use of a mortar template allowing the top of the joint to be screeded flat before the next unit was placed.
Prisms built to investigate workmanship and compare stack to running bond were built by a mason. He used neither a jig nor a mortar tem- plate, but a course rod was provided and a level was used to keep prisms level and plumb.
Brickwork prisms were cured in the laboratory under polyethylene until tested at 7 or 28 days, except for those built by the mason (as part of the wall test program); these were cured under polyethylene for 7 days and then in air until tested at 28 days. Blockwork prisms were cured in air.
Where dental plaster was used for capping, the work was done before the units were incorporated in the prism. Running bond prisms were capped with mortar and scrceded flat.
TEST PROCEDURE
All tests were carried out in a 1.8 MN (400,000 lbf) Riehle test machine. Prisms were capped with 11 mm thick fibreboard, except for some tested with a plaster cap only. Blockwork prisms with face-shell bedding were capped with fibreboard strips placed on the face-shell area (full capping causes premature vertical tensile cracking as a result of bending in the web sections not bedded in mortar).
The loading rate was chosen so that the test duration from half to maximum load would take approximately 1 to 2 min. This resulted in load rates of 180 kN/min for the extruded brick prisms and 135 kN/min for the pressed brick prisms and blockwork. Running bond prisms, workmanship prisms, and load rate prisms were tested at a slower rate. At failure, the load controls wepe not altered, thereby approximating to a constant strain rate instead of a constant load rate.
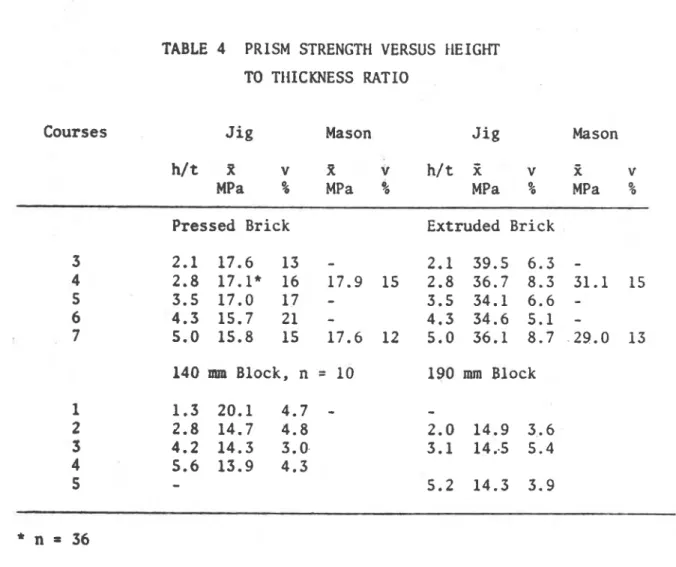
RESULTS Height-to-Thickness Ratio
The ultimate masonry prism strength in the masonry standard is derived from prisms with a height-to-thickness (h/t) ratio of 5 for brick masonry and 2 for concrete block and structural clay tile masonry. I f prisms with different h/t ratios are tested, a correction factor is applied to the result (see Table 3). This factor assumes that the lower the h/t ratio, the stronger the prism. Vatiation in strength with h/t is assumed to be the same for all prisms.
The test results from the present program are given in Table 4. The results for the 140 mrn block prisms include the strength of a single block tested with fibreboard on the face-shell area. Figure 1 shows the variation in strength with h/t ratio by setting the strength at h/t ratios between 5 and 6 equal to one. It also shows the assumed increase in prism strength, based on correction factors given in the masonry standard. As the factors are based on the same experimental data (4,5), the same relation is used for both concrete block and brick masonry. The assumed increase in strength is shown to be too
large for the prisms tested, expecially for the concrete block prisms. Capping
Prisms are normally capped to ensure a more uniform load distribution. The masonry standard (1,6) specifies a sulfur or a dental plaster
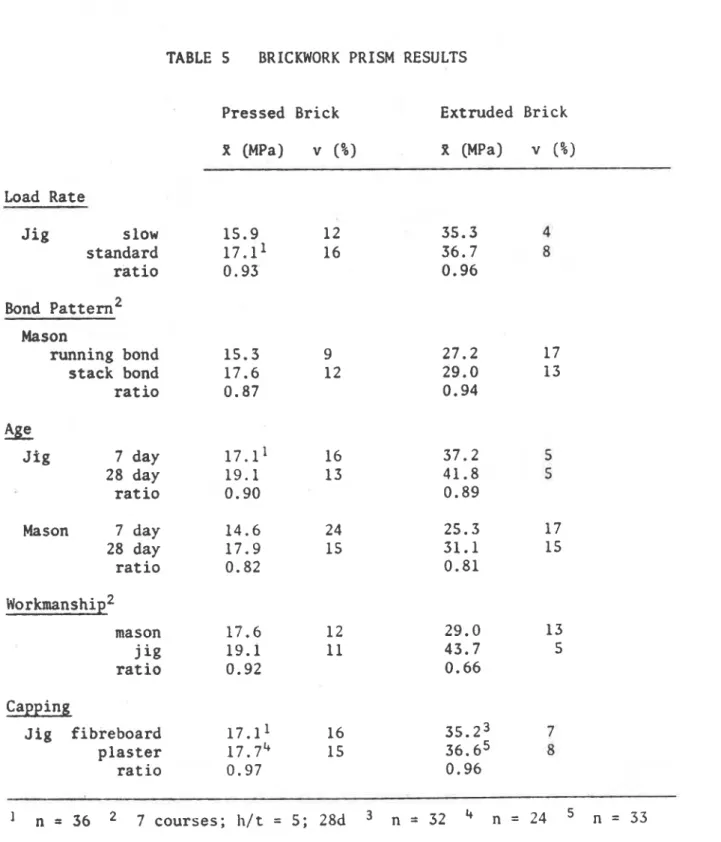
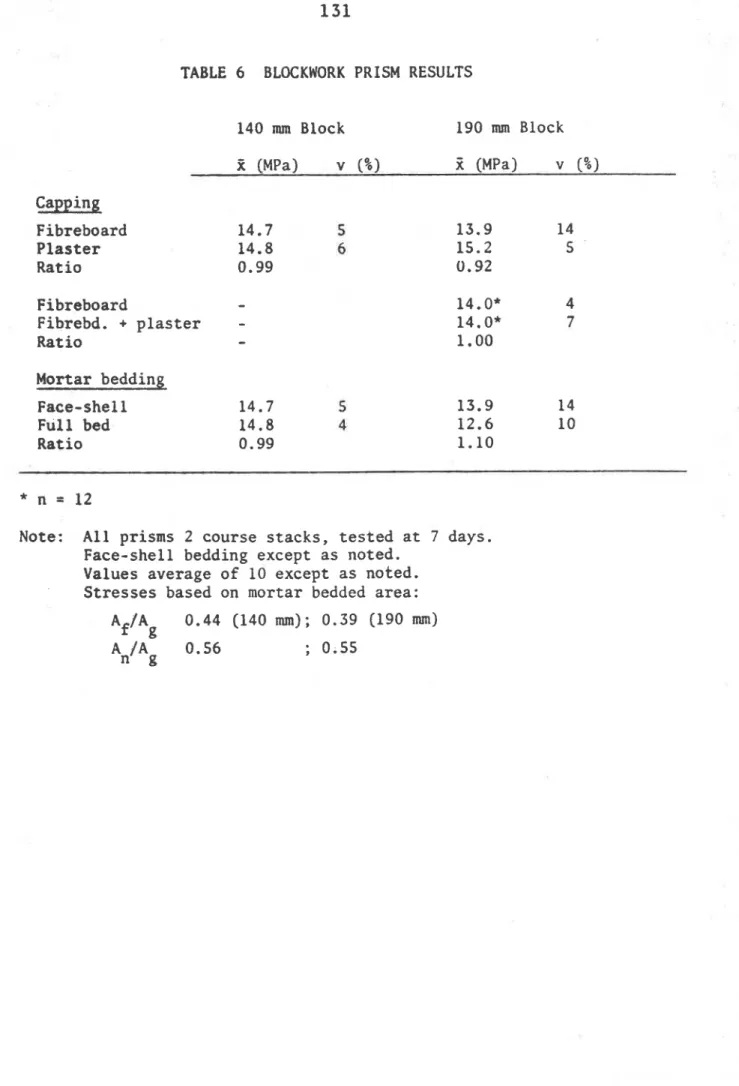
capping, but if many prisms have to be tested this requirement means much extra work. The use of fibreboard capping as an alternative was therefore investigated. Fibreboard is simple, cheap and quick and has been commonly used to test concrete blocks for quality control purposes. Tables 5 and 6 give the results for prisms tested with fibreboard and plaster capping. The mean strengths are similar, with fibreboard cap- ping giving slightly lower results (0.97 and 0.96 for the brickwork grid 0.99 and 0.92 for the blockwork).
Face-shell versus Full Mortar Bedding
Plain, hollow unit masonry is normally laid with mortar on the face- shells but not on the webs. Prisms should also reflect this practice because prisms with face-shell bedding fail at a lower stress than do those with full bedding (mortar on face-shells and webs) if, as is normally the case, the net block area is used in determining the failure stress. This problem can be avoided if it can be shown that failure stresses are similar if the mortar bedded area is used instead of the net block area.
Prism test results using both face-shell and full mortar bedding are given in Table 6. The ratios of failure stress, based on mortar bedded area, are 0.99 and 1.10 (.face-shell bedding/full bedding). Workmanship
Most of the prisms in the present program had full mortar joints and were made in a jig by a technician. They represent "ideal" workman- ship. Prisms made by a mason may give different results. A mason was therefore employed to build 7-course, stack-bonded prisms without a jig; at the same time, and using the same mortar, similar prisms were built by a technician. The results are shown in Table 5. The strength ratio of mason-built to jig-built specimens was 0.92 and 0.66 for pressed and extruded brick, respectively. Workmanship is shown to be an important factor for high-strength, extruded-brick masonry, probably owing to incompletely filled mortar joints primarily caused by furrowing of the mortar joint. The pressed brick has larger perforations, so that incomplete filling along the centre of the
joint may not be so critical. Loading Rate
The load rates (in terms of stress) used for the brickwork ranged from 9.5 MPa/min for the extruded brick prisms to approximately 0.3
MPa/min for the running bond prisms made from pressed brick. The latter rate was slow to allow time for strain measurements and crack detection.
Four-course brickwork stacks were tested to discover whether a slow load rate affected strength. The normal load rate of 9.5 MPa/min or
7.5 MPa/min for extruded and pressed brick prisms, respectively, was applied up to 80 per cent of the ultimate characteristic strength. The rate was then reduced to 0.30 MPa/min until failure (at failure
the load controls were not adjusted to keep up the load rate). The results are shown in Table 5. The ratios of strength for slow to normal load rate were 0.93 and 0.96, indicating a slight reduction. Stack versus Runnine Bond
Prisms are normally built in stack bond, although the walls they are meant to represent are normally in running bond. Table 5 gives the results of some mason-built brickwork prisms, one a set of 7-course,
stack bond prisms, the other 7-course, 1 1/2 brick long prisms in
running bond. The running bond prisms gave lower results
-
ratiosof 0.87 and 0.94 for the two types of brick tested.
Age
The standard test age is 28 days, but shorter periods such as 7 days may be more convenient, especially if prisms are used for quality control. The present design code permits the 7-day test provided the
7 to 28-day strength ratio is determined; alternatively, this ratio
may be taken to be 0.9. Test results for the 7 and 28-day strengths
are given in Table 5, which shows that the ratio of 7 to 28-day
strengths varies from 0.81 to 0.90.
DISCUSSION
The mean strength is used in this paper in comparing the test results.
Mean strength, however, is not used directly for design. The masonry standard requires the use of the characteristic strength, a value below which only approximately 10 percent of the test results will
fall. Its value is given by X(l
-
1.5~) where 5 is mean strengthand v is coefficient of variation. The characteristic strength, which is more uncertain than the mean strength, should be based on a sample large enough to give reasonably reliable results. Beech (7) recom- mends a minimum of ten replicates, although this minimum will in- crease with higher coefficients of variation. The test results in this paper are usually based on twelve replicates, although more are often used, especially for unit tests.
Some general conclusions have been drawn from the present results, but they should be taken only as suggestions until more data are
reviewed and further test results become available. A future paper
will review existing data on the compressive strength of prisms. The correction factors in the masonry standard for height-to-thick-
ness ratio given in Table 3 are meant to be conservative, but this
is not the case for blockwork prisms with h/t ratios greater than two.
If the correction factor of 1.2 is used for the three-course, 190 mm
block prism tested (h/t = 3), this overestimates the strength by 18
percent in comparison with the two-course prism (h/t = 2). The test
results indicate that height-to-thickness correction factors may not be necessary in many cases. Minimum prism size could instead be specified. Except for the shortest prisms the number of units in a stack-bonded prism may be more significant, depending on variability in the strength of the units, because the more units in a prism the greater is the likelihood of a weak unit.
Fibreboard is a viable alternative to plaster capping. Prisms having irregular surfaces would still need to be capped with plaster or
mortar in addition to fibreboard. In comparison with plaster capping,
fibreboard gave slightly lower results. Other results (8) cornparing
fibreboard with mortar capping for two high concrete block prisms with full mortar bed gave a lower ratio: an average of 0.90 compared with
Ultimate stresses based on mortar bedded area gave similar results for both face-shell and full mortar bedding. This agrees with other experimental results (9).
The relation between 7- and 28-day strength is also similar to that of previous results (10). The value of 0.9 adopted in the masonry stan- dard is meant to be an upper limit, and agrees with the values for the prisms tested.
Running bond gave somewhat lower results than stack bond, although earlier results have shown no change in strength (11). The earlier results are based on prisms with full bed joints (no furrowing al- lowed)
.
A slow load rate gave a slight reduction in strength, but further tests are needed to confirm this.
Although the factors under discussion affect prism strength, thay can be minor in comparison with such factors of workmanship as incomplete filling of the mortar joint. This can cause a large reduction in strength in solid brick prisms. Previous work on brick prisms by Anderson (12) showed such a result. Although the pressed brick prisms
in the present tests did not show a large difference between mason- built and jig-built prisms, a large change was observed for the ex- truded brick prisms. It was even more marked in terms of character- istic strength, since the variation in strength is greater for the
mason -built prisms. The characteristic strength of these prisms was 23.2 MPa in comparison with 40.3 MPa for the jig-built prisms. The masonry standard tabular value, based on unit strength and mortar type, is also higher than for the mason-built prisms (25 MPa for Type S mortar and a characteristic brick strength of 99 MPa). Thus, workmanship must be taken into account when building brick prisms, especially because the practice of furrowing the mortar joint is common.
CONCLUSIONS
Care must be taken that prism construction is representative of practice on the building site, including the use of face-shell bed- ding instead of full bedding with hollow concrete blocks (unless
stresses are based on mortar bedded area) and furrowing of the mortar joints in masonry using solid units.
The masonry standard correction factors applied to hollow concrete block prisms with height-to-thickness ratios greater than two should be no larger than one(the factor for a height-to-thickness ratio of two).
This paper is a contribution from the Division of Building Research, National Research Council of Canada, and is published with the approval of the Director of the Division.
REFERENCES
1. Canadian Standards Association, CSA Standard CAN3-S304-M78, "Masonry Design and Construction for Buildings," 1978.
2. Maurenbrecher, A.H.P., "Use of the prism test to determine compressive strength of masonry," North American Masonry Conference, The Masonry Society, Colorado, 1978, pp 91-1 to 91-13.
3. American Society for Testing and Materials C109-77, "Compressive strength of hydraulic cement mortars," 1977.
4. Krefeld, W.J., "The effect o,f shape of specimen on the apparent compressive strength of bridk masonry," ASTM Proceedings, Vol. 38, NO. 1, 1938, pp. 363-369.
5. Foster, P.K., and Bridgeman, D.O., "Prism tests for the design and control of brick masonry," New Zealand Pottery and Ceramics Research Association, Lower Hutt, New Zealand, Technical Report No. 22, 1973.
6. American Society for Testing and Materials €447-74, llCompressive strength of masonry prisms,ll 1974.
7. Beech, D.G., '"I'tl: concept of characteristic strength," Proceedings, Br. Ceram. Soc. No. 27, Loadbearing Brickwork 6, 1978, pp 277-288.
8. Roberts, J.J., "The effect upon the indicated strength of concrete blocks in compression of replacing mortar with board capping," Proceedings, First Canadian Masonry Symposium, University of Calgary, Calgary, 1976, pp. 22-38.
9. Self, M.W., "Structural properties of load-bearing concrete masonry," In Masonry: Past and Present, ASTM STP 589, 1975,
pp. 233-254.
10. Structural Clay Products Institute (now BIA), llRecommended practice for engineered brick masonry," McLean, Va. 1969. 11. Structural Clay Products Research Foundation (now BIA), "Com-
pressive, transverse and racking strength tests of four-inch brick walls," SCPRF, Geneva, Ill., Research Report No. 9, 1965. 12. Anderson, G.W., "Stack-bonded small specimens as design and
construction criteria," SIBMAC Proceedings, (ed. by H.W.H. West and K.H. Speed), Br. Ceram. Res. Assoc., Stoke-on-Trent, England, 1971, pp. 38-43.
NOTAT ION
= mortar bedded face-shell area
if
= gross area= net area hn = height
IRA = initial rate of water absorption n = number of replicates
t = thickness
v = coefficient of variation Z = mean value
TABLE 1 BRICK PROPERTIES
Property Pressed Brick Extruded Brick
Mass (kg) Density (kg/m3) 24-hr water absorption(%) by wt by vol Percent solid IRA (kg/m2/rnin) Dimensions(mm) length height thickness Compressive strength (MPa) plaster f ibrebd
Note: All tests on air-dry units stored in the laboratory; compressive strength based on gross area, IRA on net area; prism tests com- paring plaster with fibreboard capping used a different batch of extruded bricks (X = 98 MPa, v = 6.9%, n = 33).
TABLE 2 BLOCK PROPERTIES Property Mass (kg) Density (kg/m3) 24-hr water absorption (%) by wt by vol Percent solid Dimensions(mn) length height thickness Compressive strength (MPa) plaster fibrebd., dry wet
*Mass of block with two end recesses. Block with one end recess: 17.32 kg, v = 0.6%, n = 10. Other results in column based on blocks with one and two end recesses.
Note: All tests on air-dry units stored in the laboratory; compressive strength based on net area; wet units soaked for 1 to 2 days
(water abs by wt approx 6%); a second batch of 190 mm blocks
gave similar results: compressive strength (fibreboard cap)- Dry unit X = 18.9 MPa, v = 10.3%, n = 24;
TABLE 3 CORRECTION FACTORS FOR PRISMS
(Based on Table 1, C~~3-S304-M78) Ratio Correction Factor Assumed Increase
h/ t Brick Concrete
in Strength
Brick- Blockwork Masonry Block work
*Adjusted so that the factors are the same for brickwork and
TABLE 4 PRISM STRENGTH VERSUS tlEIGHT TO THICKNESS RATIO
Courses Jig Mason Jig Mason
h/t 3
v
R v h / t Z v ji vMPa % MPa % MPa % MPa %
Pressed Brick
140 mm Block, n = 10
Extruded Brick
190 mm Block
Note: Stresses based on gross area for brickwork and mortar bedded area for blockwork; blockwork: face-shell bedding; Af/Ag = 0.44
(140 arm), 0.39 (190 m); 7-day test except mason-built prisms tested at 28 days; 12 replicates except as noted.
TABLE 5 BRICKWORK PRISM RESULTS Load Rate J i g slow standard r a t i o Bond p a t t e r n 2 Mason running bond s t a c k bond r a t i o
Age
J i g 7 day 28 day r a t i oPressed Brick Extruded Brick
X (MPa) v (%) R (MPa) v (%) Mason 7 day 14.6 2 4 25.3 17 28 day 17.9 15 31.1 15 r a t i o 0.82 0.81 workmanship2 mason 19.6 12 29.0 13 j 11.3 19.1 11 43.7 5 r a t i o 0.92 0 . 6 6 Capping J i g fibreboard 17.11 16 3 ~ . 2 ~ 7 p l a s t e r 17.7" 15 36. 6 5 8 r a t i o 0.97 0.96 n = 36 7 courses; h / t = 5; 28d n = 32 n = 2 4 n = 3 3 Note: S t r e s s e s based on g r o s s a r e a ; a l l t e s t s a t 7 days except as
TABLE 6 BLOCKWORK PRISM RESULTS 140 mm Block 190 mm Block ji (MPa) v (%)
Z
(MPa) v (%) Capping Fibreboard 14.7 5 13.9 14 P l a s t e r 14.8 6 15.2 5 R a t i o 0.99 0.92 Fibreboard-
Fibrebd. + p l a s t e r-
R a t i o-
Mortar bedding Face-shell 14.7 5 13.9 14 F u l l bed 14.8 4 12.6 1 0 R a t i o 0.99 1.10Note: A l l prisms 2 c o u r s e s t a c k s , t e s t e d a t 7 days. Face-shell bedding except a s noted.
Values average o f 10 except a s noted. S t r e s s e s based on mortar bedded a r e a :
Af/Ag 0.44 (140 mm); 0.39 (190 mm) An'Ag 0.56 ; 0.55
B R I C K W O R K
B L O C K W O R K
F I G U R E 1
This publication i s being distributed by the Mvieion of Building Research of the National Research Council of Canada. I t should not be reproduced in whole o r in p a r t without permission of the original publisher. The Di- vision would be glad to be of a s s i s t a n c e in obtaining such permission.
Publications of the Division may be obtained by mail- ing the appropriate remittance (a Bank, Express, o r P o s t Office Money Order, o r o cheque, made payable to the Receiver General of Canada, c r e d i t NRC) to the National Research Council of Canada, Ottawa. K1A OR6. Stamps a r e not acceptable.
A l i s t of a l l publications of the Division i r available and may be obtained f r o m the Publications Section. Divieion of Building Research, National R e s e a r c h Council of Canada, Ottawa. KIA OR 6.