Clovette: Predicting Preferences for Flowers
By
Jeeyun Jennifer Lee
B.A. Political Science
Wellesley College, 2006
SUBMITTED TO THE MIT SLOAN SCHOOL OF MANAGEMENT IN PARTIAL
FULFILLMENT OF THE REQUIREMENTS FOR THE DEGREE OF
MASTER OF BUSINESS ADMINISTRATION
AT THE
MASSACHUSETTS INSTITUTE OF TECHNOLOGY
JUNE 2016
C 2016 Jeeyun Jennifer Lee. All rights reserved.
The author hereby grants to MIT permission to reproduce
and to distribute publicly paper and electronic
copies of this thesis document in whole or in part
in any medium now known or hereafter created.
Signature of Author:
Signature redacted
IT 69aSchool of Management
May 6, 2016
Certified by:
Signature redacted
Assistant Professor of Operations
Accepted by:
MASSACHUSETTS INSTITUTE
OF TECHNOLOGY
JUN 0
8
2016
Tauhid Zaman
Management, MIT Sloan School of Management
Thesis Supervisor
Si gnature redacted
Maura Herson
Director, MBA Program
MIT Sloan School of Management
Clovette: Predicting Preferences for Flowers
ByJeeyun Jennifer Lee
Submitted to MIT Sloan School of Management on May 6, 2016 in Partial fulfillment of the
requirements for the Degree of Master of Business Administration. Abstract
Flowers are often gifted for major holidays and personal holidays, for both personal and corporate purposes. Today's solutions in the market are abundant but scattered, with many players offering products of varying quality at a range of price points. To command higher prices and stay relevant in the market, florists need to distinguish themselves through high quality and/or niche product and ease of service. The goal for this project is to map the current competitive landscape and supply chain of the flower industry, and to determine whether
predictive modeling in the floral industry is feasible as a point of difference for new gifting company Clovette. Data collection through distribution of a survey called "Discovering Floral
Preference" assessed the potential for prediction. Furthermore, the project explores Clovette's brand identity and potential "good" business development through sustainability initiatives and supply chain optimization.
Keywords: random forest, predictive modeling, flowers, gifting, sustainability Thesis Supervisor: Tauhid Zaman
Acknowledgments
A community contributed to the completion of this thesis. First, thank you to my Sloan
classmates who have been incredible classroom partners and sounding boards, specifically
Clifford Chow, Stephanie Chow, Jacqueline Karlin, Igor Slutsker, Paramee Smittinet, and
Charleen Tong. Also, thank you to my wonderful friend and colleague Kova Jurn, who made it
feasible and fun to work remotely on Blush Designs during my MBA. A fond thank you to
Andrew Thoma for his patience and brilliance. A special thank you to my Sloan advisor Tauhid
Zaman for his expertise and guidance. Lastly, my admiration, appreciation, and love for my
family: my father Don, mother Jinny, sister Jeesue, and puppy Lucy. My family has been
instrumental to my happiness and achievement all my life.
Table of Contents
Table of Figures
8
Introduction 11
M otivation & Goals... 11
P roblem Statem ent ... 12
P roject D esig n ... 13
The N ew York F low er M arket ... 16
The Flower Supply Chain 19
The G lobal Cut Flow er Supply Chain ... 1 9 The D om estic Cut Flow er Supply Chain ... 2 5Competitive Landscape
29
Local brick and m ortar stores...3 0 Online wire services that leave fulfillment to local florists... 32E com m erce startups w ith m ulti-city reach ... 33
Sup erm arkets and Chains ... 3 7 E tailers w ith floral collection ... 38
Consum ers...38
Data Collection and Analysis
41
Consum er P references Survey ... 41Survey D istribution A nalysis and R esults...4 7
Brand Development & Marketing 55
Prim ary M arket R esearch5... 55Visual D esig n & O bservability ... 5 7 B eta Launch ... 5 9 "Good " B usiness O pportunities ... 62
Conclusion
67
Table of Figures
FIGURE
1.
FLORIST INDUSTRY AT A GLANCE ... 15FIGURE 2. O NLINE FLOW ER SHOPS ... 16
FIGURE 3. A SINGLE BOUQUET, BY BLUSH DESIGNS... 19
FIGURE 4. SHARE OF GLOBAL CUT FLOWER MARKET, 2003 AND 2013 ... 20
FIGURE 5. HOLLAND, COLOMBIA, AND ECUADOR'S VARYING MODES OF PRODUCTION... 21
FIGURE 6. HOLLAND AND ECUADOR'S AGRICULTURAL PROFILES ... 21
FIGURE 7. THE FLORAL SUPPLY CHAIN, DUTCH VS. COLOMBIAlECUADOR ... 22
FIGURE 8. TRADITIONAL VERSUS NEW SUPPLY CHAIN ... 23
FIGURE 9. COLOMBIA'S LEAD IN THE GLOBAL CUT FLOWER TRADE BY SEA CONTAINER ... 24
FIGURE 10. DOMESTIC GROWER MARKET ... 25
FIGURE 11. 2014 US CUT FLOWER IMPORTS AS REPORTED BY U.S. CUSTOMS AND BORDER PROTECTION... 26
FIGURE 12. DOMESTIC WHOLESALE MARKET ... 27
FIGURE 13. ATTRIBUTE SPACE FOR FLOWER COMPANIES ... 30
FIGURE 14. NUMBER OF FLORAL ESTABLISHMENTS IN 2005,2010, AND 2014 ... 31
FIGURE 15. FLORIST ESTABLISHMENTS FROM 2007-2012 ... 31
FIGURE 17. COMPARISON OF ECOMMERCE SHOPS ... 34
FIGURE 18. MARKET SEGMENTATION FOR FLORISTS AND FLOWER SHOPS... 39
FIGURE 19. VALENTINE'S DAY CONSUMER BEHAVIOR ... 40
FIGURE 20. AN EXAMPLE OF STYLISTIC DIFFERENCES IN THE NEW YORK MARKET ... 42
FIGURE 21. AN EXAMPLE OF A PINTEREST PAGE FROM RESPONDENT ... 43
FIGURE 22. INTRODUCTION TO SURVEY ... 44
FIGURE 23. SURVEY QUESTION ON HOME DECOR ... 45
FIGURE 24. SUBCATEGORIES OF COLOR ... 45
FIGURE 28. COLORPALETTEPASTELSOFT, SAMPLE PREDICTIONS AND ACTUALS, AND VARIABLE IMPORTANCE PLOT... 50
FIGURE 29. COLORPALETTE_DEEPDARK, SAMPLE PREDICTIONS AND ACTUALS, AND VARIABLE IMPORTANCE PLOT ... 50
FIGURE 30. COLORPALETTE_BRIGHTBOLD, SAMPLE PREDICTIONS AND ACTUALS, AND VARIABLE IMPORTANCE PLOT ....
51
FIGURE 31. FREQUENCY OF IMPORTANT VARIABLES IN SUR VEY RESULTS FOR "COLORPALETTE" FEATURE...51
F IG U R E 3 2 .M A E5... 5 2 FIGURE 33. SURVEY QUESTION ON FLOWER STYLE, AND VARIABLE IMPORTANCE PLOT FOR "FLOWERSTYLELOOSE" .... 52
FIGURE 34. PRODUCTS AND SERVICES SEGMENTATION FOR FLORISTS AND ONLINE FLOWER SHOPS ... 53
FIGURE 35. PREFERRED FLOWER GIFT FOR ONESELF: SURVEY QUESTION, Box PLOTREFLECTING PREFERENCES... 53
FIGURE 36. PREFERRED FLOWER GIFT TO SEND: SURVEY QUESTION, Box PLOT REFLECTING PREFERENCES... 54
FIGURE 3 7. TAKEAWAYS FROM PRIMARY MARKET RESEARCH ... ... ...
56
FIGURE 38. CLOVE ETE TARGET USER PERSONA ... 56
F IG URE 39. C LOVE T E LOGO D ESIGN ... 57
FIGURE 40. METHODS TO INCREASE OBSERVABILITY IN THE MARKETPLACE ... 58
FIGURE 41. COMPARISONS AMONG NEW YORK PRODUCT OFFERINGS ... 58
FIGURE 42. CLOVETTE BETA LAUN CH SK US... 59
FIGURE 43. CLOVE TE BETA LAUNCH M ARKE TING... 61
FIGURE 44. FACEBOOK AND INSTAGRAM ADS FOR CLOVETTE BETA LAUNCH ... 61
Introduction
Motivation & Goals
In January 2011 1 launched Blush Designs LLC (blushdesignsny.com), a boutique floral
and event design company based in Manhattan. Through Blush, I constantly "meet and talk
flowers" with New York City brides who vary in their planning approach, from obsessive and
particular to relaxed and flexible. They are all educated and employed urbanites, usually between
25 to 35 years in age, with robust personalities, personal styles, and aesthetics. My job is to use
my intuition and to ask the right questions, in order to create and sell a bride a design concept she
loves.
I now have an instinctive process, much based on a bride's personal style and
personality, to determine her floral preferences. I question whether this instinctive process can be
translated into a recommender system, one that can correlate a user's behavioral characteristics
and preferences, such as for fashion or home decor, with floral taste.
I arrived at MIT Sloan in Fall 2014 determined to identify scalability opportunities and
disruption potential in the floral industry; I wrote in my application essay to Sloan earlier that
year, "I foresee...a stronger online presence for the floral industry...by bringing innovation
visualization methods... [the] possibility [to] go deeper in the supply chain to bring benefits more
directly to the end summer... [the] promise to offshoot into an educational resource." These
arbitrary thoughts culminated in Clovette LLC (clovette.com), a floral gifting startup I hope to
launch by Fall 2016. If achievable, a recommender system can be Clovette's significant point of
difference in the saturated New York City flower market.
Furthermore, Clovette may have the potential to distinguish itself in a crowded market
through a "good" business model. Flowers can be categorized as a credence good, in that it is
difficult to communicate its value to the consumer. The value of flowers lies in their beauty,
impermanence, emotional utility, and complex journeys from farm to table. This journey is
colored by a number of stakeholders in the floral supply chain: the small and large players in
hybridization, the growers (and farm workers) who must work within a framework set by history
and their country's policies, the wholesalers who make swift transitions in a dynamic
marketplace, and the uneducated consumers who don't realize that their decisions make
enormous ripples in the global floral economy. Active and ongoing exploration of this chain
could be a competitive advantage for Clovette.
The goal for this project is to determine whether predictive modeling in the floral
industry could be possible, as well as to explore Clovette's brand identity and potential "good"
business development through sustainability initiatives and supply chain optimization.
Problem Statement
Flowers are often gifted for major holidays (Valentine's Day, Mother's Day,
Administrative Appreciation Day) and personal holidays (birthdays, anniversaries, recoveries),
for both personal and corporate purposes. Today's solutions in the market are abundant but
scattered, with many players offering products of varying quality at a range of price points.
Today's consumers also differ in their purchasing habits from consumers of past generations;
consumers in their mid-20s through mid-30s are less able to distinguish freshness and quality,
and altogether don't perceive the meaningfulness of flowers as gifts compared with older peers
(Carter, 2015, p. 15). To command higher prices and stay relevant in the market, florists need to
distinguish themselves through high quality and/or niche product and ease of service.
Could Clovette achieve a recommender system through predictive modeling? And, how can Clovette utilize such a system and other points of difference to create salience in a crowded market and lead the brand toward resonance in the long-term?
Project Design
The approach for this project began with a thorough examination of the market's
landscape, players, trends, and supply chain. The initial insights from this research led to the
development of the hypothesis for a recommender system as a potential method of
personalization, explored through data collection to determine correlation of user behavior and
floral taste. Finally, overall brand development was explored through visual design and other
creative, a beta launch, and good business development considerations. The scope of this project
will focus on the New York City market, though it will also take other urban U.S. markets into
consideration during expansion and scalability assessment.
Background Industry Overview
Flowers comprise a crowded industry, which includes many types of retailers from brick and mortar shops to ecommerce entities. Over the past five years, brick and mortar shops have experienced reduced demand as floral consumption has quickly moved online or to
supermarkets, many of which have expanded its floral offerings. As shops have closed due to
declining revenues, at an annualized rate of 1.9% over the past five years, 70% of business has gone to supermarkets or other competitors (Carter, 2015, p. 7). Figure I reflects the declining growth prospect of this market.
Industry at a Glance
Florists in 2015Key Stat Revenue Annual Growth 10-15 Annual Growth 15-20
sit'
-1.2%
-0.3%
Profit Wsges Bu,,nesse
5185
6
$1.2bn
35,343
Figure 1. Florist IndustrY at a Glance *Does not include supermarket and ecommerce (Carter. 2015)
On the other hand, ecommerce solutions, capitalizing on the prevalence of online
shopping overall, have increasingly taken market share from brick and mortar shops. The online
shops benefit from competitive advantages, such as the lower overhead of operating without a
physical retail store, and are expected to increase revenue at an annualized 5.1% to $4.5 billion
Industry at a Glance
Online Flower Shops in 2015Reenue Annoal Grooth 10-15 Annual Grooth 15,20
Proit2.5%
5.1%
Profit .Wages Busines
8m
$837.4m
3
830
Figure 2. Ondline Flower Shops (Lerman. 2015)
Specifically in New York City, floral consumer behavior has become so varied that is has
created a "floral gap". The following is an excerpt from The Economist that paints the landscape of the New York consumer market today:
Transient, superfluous and beautiful, flowers decorate the pinnacle of New York society. The city's wealthiest, whose Upper East Side penthouses can be spied from the Met's
roof, might spend $10,000 a week on them.. .At the other end of New York's social
spectrum, flowers are poignant leftovers of an age before the impersonality of the internet
and the stagnation of wages. In the bodegas on upper Broadway Korean shopkeepers sell fume-choked bunches for five bucks, with the implicit promise they won't wilt until midnight and might save your marriage (The Economist, 2014).
The New York Flower Market
The New York "wholesale" flower market has evolved in response to changing consumer
behavior. Today's flower market still remains in the heart of Manhattan's expensive Chelsea
neighborhood on 28' Street between 6" and 7th Avenues, but it is no longer a wholesale center
that sells by the box or bucket; rather, it can be more accurately described as a cash-and carry
market, where anyone can come and purchase by the bunch. The flower market has been
According to Casper Trap of Dutch Flower Line (dutchflowerline.com), one of the
notable New York floral wholesalers today, since the 2008 market crash, retailers and end
customers have increasingly avoided the middleman, putting pressure on wholesalers to sell to
almost anyone (personal communication, December 3, 2015). After the 2008 downturn, sales
dried up and unleashed a chain of events: Florists who left the business couldn't fulfill their
accounts payable to wholesalers, who in turn went bankrupt. Remaining florists, some who were
too embarrassed to return to wholesalers they owed, reduced costs by purchasing directly from
Holland. More wholesalers were pushed out. Though many of Trap's major customers still shop
in the market today to "feel the product and market", many utilize webshops. These webshops
provide similar access that wholesalers have to order with suppliers.
Today, Trap's customers include other institutions such as photographers, caterers, and
hair salons. Trap feels compelled to sell to "The Really Nice Restaurant Guy" who is trying to
cut costs and buy directly to decorate. He often turns away "Mrs. Park Avenue" who sends her
butler to the market and arranges on her own at home. He also notes a growing group of "The
Brooklyn Girls", freelance florists who choose select clientele and have virtually no overhead.
Individually the Brooklyn Girl is a smaller customer, though altogether the group comprises a
good portion of Trap's clientele.
Wholesalers like Trap have and continue to respond to the market changes by tailoring
their target market and inventory decisions. Gary Page of G. Page (gpage.com), another major
wholesaler on
2 8thStreet, strategizes through specialization, of both materials and customers
(personal communication, November 19, 2015). "The range of material is so massive.. .you can't
bring everything to everybody. Bringing material into New York City into a central location is
also very difficult. We don't go to mass markets. We make a conscious effort to go to better
florists and decorators," Page said. Likewise, Trap notices that the market is becoming "more
boutique and specialized" with novelty niche material that is difficult to purchase directly from
suppliers. Furthermore, he offers the best service that fits his customers' lifestyles, such as
allowing next-day orders to be texted over. Operationally, he purchases smaller amounts every
day or every other day to have more control over inventory, and he promises the best quality.
Sabir Taheraly opened destination florist supply store Jamali Floral & Garden Supplies
(jamaligarden.com) in the New York market 19 years ago. Jamali is not a wholesale store, but
what Taheraly calls a "trade store", serving a diverse clientele of designers, photographers,
producers, and stylists. He has also survived because of specialization; Taheraly travels the
world to work with over 300 suppliers who produce handcrafted custom-designed items for
Jamali (personal communication, April 11, 2016). Jamali's products cannot be bought anywhere
else in the flower market or online aside from Jamali's e-commerce shop. Taheraly, who
diligently curates his line, offers new products every season, and actively engages with his
customers to source product they want. Taheraly's 5-year plan looks outside of the New York
market to a stronger ecommerce presence, which has already achieved considerable demand
from even California customers willing to pay high shipping costs to ship cross-nation. The New
York scene he says has changed, as "the whole thrill of the flower market has gone. It's not like
before when you used to have hundreds of florists coming in from Connecticut, Pennsylvania, or
New Jersey." Taheraly notes that the remaining wholesalers, perhaps the safeguard of the
shrinking New York flower market, are those who own their properties and can stay amidst the
many changes.
The Flower Supply Chain
The Global Cut Flower Supply Chain
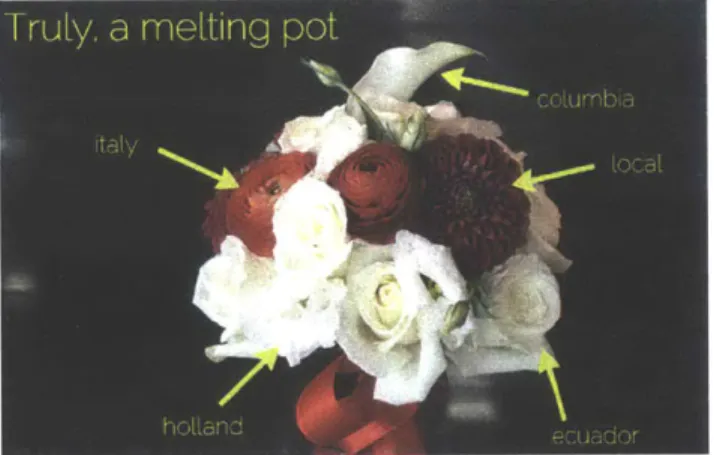
A single bouquet can essentially be a melting pot of flowers from countries all over the
world. Figure 3, a small bouquet of five types of flowers, reflects five countries' products, all of which journeyed in distinct ways to reach my studio in the New York flower market.
TruLy. a mefting pot
columbia italy
4
localhot[andeudr
Figure 3. A single bouquet, by Blush Designs
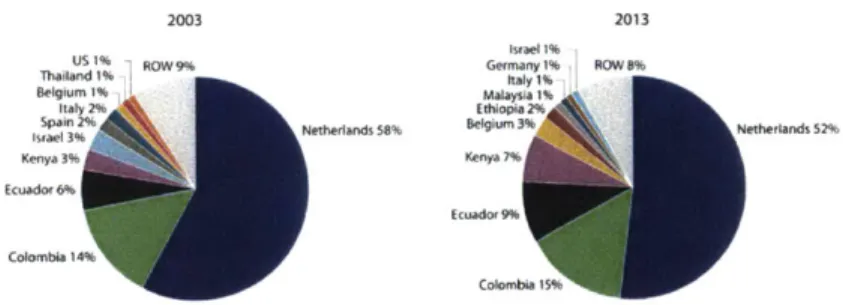
Netherlands and South America, specifically Colombia and Ecuador, have historically been the largest producers in the global market, as shown in Figure 4. In recent years, the Dutch share has decreased, whereas South America continues to expand its reach: from 2003 to 2013,
Holland's global share declined from 58% to 52%, whereas Colombia and Ecuador's combined
market share increased from 20% to 24%. By 2013, the US, whose floral output is almost entirely sold domestically, lost its 1% share (McCormack, 2015, p. 13). Smaller players, including Ethiopia, Kenya, and Malaysia, are quickly increasing share due to favorable growth conditions, rising demand for competitively priced flowers, and improved logistics (van Rijswick, 2015). In fact, most recent numbers suggest that Kenya may be the world's third
m 2003 2013 US 6 aey% Bq Thadind I- ItG ly R Beg B ihi~d, 585 Nethip~lrds 5?1
-wd
ColombwFigure 4. Share af global cut flower market, 2003 and 2013 (van Rijswick, 2015)
For simplicity purposes, I'd like to compare and contrast the traditionally top three global
producers: Netherlands, Colombia, and Ecuador, who together comprise more than 75% of
global cut flower production. Historical, cultural, economical, and political characteristics of these countries shape these countries' industry and supply chain; their industry practices can be particularly meaningful for upcoming players like Kenya.
Holland growers espouse a vastly different mode of production from its counterparts in
Colombia and Ecuador, as shown in Figure 5. The Holland grower tends to own a significantly
smaller farm than the South American grower, and he may specialize in specific floral species. On the other hand, the South American grower may own several larger-scale farms and produce mostly standard product, specifically the rose, which fares exceedingly well in South American climate and geography. Ultimately, even though Holland growers and South American growers cumulatively farm similar volumes of land, Holland is more productive in dollars per hectare:
Holland produces flowers with an approximate export value four to six times that of Colombia and Ecuador, respectively (Ziegler, 2007, p. 63). This is mainly due to Holland growers' ability
to focus on very specialty blooms, whose selling price can be four to five times higher than standard products.
Share of global cut flower market,
2003
Number of farm growers, 2003
Average farm size Average production
in $/hectare
Holland 58% 6,700 Less than I hectare 583,000
Colombia 14% 500 10-12 hectares 140,000
Ecuador 6% 250 10-12 hectares 89,000
Figure 5. Holland, Colombia. and Ecuador's Var'ing Modes o/ Production. Created w4h njormation fOm, (Ziegler, L00 )
Furthermore, Holland growers work in an established and regulated system, bolstered by
a stable political and economical climate. Holland's floral industry, over a century old, is
comprised of smaller farmers who utilize camaraderie among other growers and the Dutch
auction at Aalsmeer - where some 60% of the world's cut flowers are bought and sold - to help
market, sell and transport products. Ecuador's floral industry, a few decades in the making,
consists of fewer growers; these growers don't share a support system or cooperation, and often
have to handle all components of the sales process alone (Ziegler, 2007, p. 85).
Profile of country Profile of farmer Transportation Recent trends
Holland - 2015 GDP per - Self-employed - Schiphol Airport and From 2008-2013.
capita: $43,603 (#15) - Expert in growing linked highway FloraHolland - Flowers > than 5% one flower species system adjacent to cooperative
of gross GDP - Farm likely less than the Aalsmeer auction membership drops
- Established industry I hectare from 5,100 to 4,600
started in 1900 growers
" Historically, state - Profits grew from 4.1
agricultural support billion euros to 4.5
billion euros Ecuador 2015 GDP per - Manager of larger * A new airport - 73% of flowers
capita: $6,071 (#82) enterprise, usually Mariscal Sucre in produced are roses - Flowers < than 1% family-owned private Quinto opened in In 2013 generated
of gross GDP companies February 2013, still $837M in revenue
" Young industry * Usually from the inconvenient with and employed
started in mid 1980s wealthy limited road 103,000 people
- Historically. limited entrepreneurial infrastructure; regulation and landowning class previous airport support. State failure * May own several plagued with
to stabilize bank farms deficiencies,
lending rates increasing costs
Figure 6. Holland and Ecuador s Agricultural Profiles. Created with information from IMF, (Conefrey, 2015), (Schuetze, 20 14) and (Ziegler, 2007)
Though Holland's global share is in decline, perhaps due to upcoming players and the changing climate of consumer behavior, Dutch growers are still supported by strong established
infrastructure. For example, Aalsmeer auction serves as a major distribution center that can easily transport product to Schiphol Airport through a linked highway system. On the other hand, Ecuador's growers are challenged and limited by a deficient highway system leading to the newly revamped Mariscal Sucre airport in Quinto.
The traditional supply chain for both Holland and South American growers can involve numerous steps and a multitude of stakeholders. Figure 7 starts the chain with flower hybridizers, and then moves through the chain from both a Dutch and Colombian/Ecuadorean lens. The majority of product from these countries is processed through wholesalers before moving to retail and end customer.
F, C igh en mgd
(~ci
g~~c~we'C r mar
Recent years have compressed this chain in several areas. For example, for the past five or so years, the Aalsmeer auction has experienced a massive shift in how flowers are sold and
bought, primarily because smaller players have exited the industry. As both buyers and sellers have become increasingly larger, they've started to work directly together, weeding out the auction's role. This direct interaction has reduced lead time, another competitive advantage for larger buyers. In addition, technological advancements have changed the auction dynamic, prompting speculation on the future of auction. Whereas flowers used to be brought out to the auction floor for buyers to feel and see, they're now kept in cold storage; purchase is based on photos alone (Schuetze, 2014).
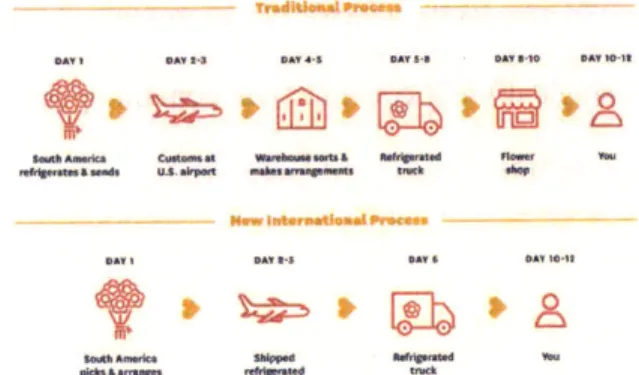
The supply chain has been affected in other ways by companies looking to reduce cost. These strategies will be explored later on in our study of the competitive landscape. However,
Figure 8 shows a simplification of the South American process. Though the timeline is the same, the flowers are exchanged over fewer hands, reducing overall cost.
DAY I DAY 2-3 DAY 4-5 DAY 5-a DAY 8-10 DAY 10 It
Sout M en s U a t r t. 9 Refrated *tr Y-,, *te.e a -d, U.S. Irpcut mae amgmns tuk so
Suth Am- Shippd U&,,g-t.d yo
Figure 8. Traditional Versus New Supply Chain (Frazier, 2016)
This global floral supply chain will continue to become more efficient as advancements are made in the cold chain, the transportation of temperature sensitive products. For growers and wholesalers, getting the right flowers at the right time to the right location is as important as low costs (Bogataj, Bogataj, & Vodopivec, 2005). Damage in the form of bent stems, uneven
opening, and botrytis - a type of mold - can occur at any point of the transportation process, during grading, bunching, packing, storage, transport, and unpacking. Since cut flowers lose about 15% of their value every day, delay in shipping is costly. Essentially, the more hands flowers pass through during the chain, the more opportunities for damage or delay to occur. Damages have heavy costs on the products, ranging from 5-10% reduction for a single minor remark to 50% for a major or multiple minor remarks (van der Hulst, 2004).
Due to complexities and limitations of the cold chain, factors such as weight and fragility of blooms can impede growers from farming certain species. Thus, breakthroughs in
transportation can and will positively impact countries' global share. For example, transportation
by sea container is half the cost of airfreight, and has positively affected trade flows. Although
transport of flowers by sea containers is not a novel concept, the number of sea shipments has grown due to better knowledge of container transport and more control of shipment conditions, additional availability of port facilities, and growing attention on sustainability issues. In 2013,
15% of cut flower exports from Colombia was shipped by sea, likely a factor in Colombia's
price competitiveness and subsequent global share. A single 40-foot container can contain up to
150,000 stems of chrysanthemums; Figure 9 below shows 700 containers shipped from
The Domestic Cut Flower Supply Chain
Foreign flowers, which comprise 80% of the US cut flower consumption, have strained domestic growers, who watched industry revenue fall from 2010 to 2015 at an average annual rate of 4.8% to $12.5 billion, as seen in Figure 10 (Blau, 2015, p. 6). Domestic growers will likely continue to struggle due to intense price competition from South American imports.
Industry at a Glance
Plant& Flower Growing in 2015Key StOL-Reu AnniiiidGrnoth 10-15 Anua Growith 15-20
napsh u
5f
-4.8%0.7%
Profit Exports Busiel
$2.1bn
$420.Om
35,252
Figure 10. Domestic Grower Market (Blau, 2015)
Colombia by far is the top importer of cut flowers, with 65% of US's total domestic imports in 2014, shown in Figure 11. Although in recent years Colombia started producing more specialty products, such as exotic orchids, anthurium, and birds of paradise, the rose is still by the far the country's biggest seller (Haragan, 2015). According to Mr. Page, most of Colombia's material is standard and reaches supermarkets and chains that tend to want the same material for most of the year. Chains such as Walmart and Safeway who purchase from international growers drag down US farmers' prices, volumes, and revenue (McCormack, 2015, p. 6). Wholesalers, on the other hand, need material with seasonality and interest to sell to retailers and therefore have to extend their supply chain to many countries and domestic growers (personal communication,
Top 10 Exporting Country of Origin, by volume (number of stems): Country Stems Colombia 505,921,061 Ecuador 184,185,214 Mexico 43,128,608 Netherlands 21,301,219 Costa Rica 9,541,422 Kenya 8,318,794 Thailand 7,670,453 Guatemala 7,096,652 Peru 1,697,654 India 1,673,246
Figure 11. 2014 US cut flower imports as reported by U.S. Customs and Border Protection (U.S. Customs and Border Protection, 2015)
Until 2013, Colombia and Ecuador benefited from the Andean Trade Preferences Act
(ATPA) passed in 1991, which eliminated all tariffs on flowers from Colombia, Ecuador,
Bolivia, and Peru (U.S. Customs and Border Protection, 2015). The ATPA helped trigger the
growth of the Colombian and Ecuadorian flower industries in the 1990s, much to the detriment
of US growers. By 2003, the US was importing more flowers than it was growing domestically.
Demand for international flowers continues to be on the rise: In 2015, U.S. Customs and Border
Protection processed 976 million cut flower stems during the 2015 Valentine's season, January 1
to February
141h,a 21% increase from the 801 million stems from 2014 Valentine's season (U.S.
Customs and Border Protection, 2016).
Domestic growers depend on uncontrollable factors, such as preferable climate
conditions and competitiveness of the US dollar. Drought conditions can damage yield, and
appreciation of the US Dollar can boost the domestic industry's price competitiveness and curb
exports (McCormack, 2015, p. 5). Since most output is sold domestically, the most important
demand determinant for US growers is the level of flower consumption in the states.
cannot offer (Lawrence, 2012) (Ziegler, 2007, p. 62). In the early 1990s, there were over 500 farmers; today, just over 200 remain (Dawson, 2016).
Domestic growers have utilized advancements in the cold chain to increase business. For
example, refrigerated planes and freight trucks now make it possible for products to be shipped
cross-country. The larger growers have established themselves as efficient nationwide suppliers
who can offer competitive prices and product variety, and smaller domestic growers have exited
the industry or switched to other crops (McCormack, 2015, p. 7).
In line with the declining revenue of domestic growers, revenue for the downstream domestic flower and nursery stock wholesale industry decreased at 1.8% from 2010-2015, as
seen in Figure 12. Furthermore, the number of wholesale establishments, which sell flowers, nursery stock, and florist supplies to retailers, decreased at 1.4% to a total of 10,193 (Blau, 2015,
p. 4).
Industry at a Glance
Flower & Nursery Stock Wholesaling in 2015Key Stati Rononue An"ual G'owth 10.1S Annual Growth 15-20
-1.8%
0.9%
Profit Wogos Busrines
$358R2m
$1.6bn
10,193
Figure 12. Domestic Wholesale Market
The domestic wholesale market, similar to the New York market, is facing changing
consumer behavior and must respond to consumers who engage in a practice called wholesale
bypass, the practice of sourcing directly from growers to reduce costs (Blau, 2015, p. 8). Large
commercial retailers, in particular, exercise wholesale bypass; these retailers pose a threat as they
continue to draw price-conscious consumers away from more expensive traditional floral
Other wholesalers have entered with a different model. Brett Green works for Mrs. Blooms Direct (mrsbloomsdirect.com), a company that resists what Mr. Green calls the "old-school wholesale business" (personal communication, April 19,2016). Mrs. Blooms keeps very little inventory, only standard go-to products such as hydrangea and orchids that they
consistently sell out. Rather, the company seeks specific orders from clients - mostly floral and
event companies with large orders - and sources directly from farms globally. Mrs. Blooms
works with clients across the nation, and can avoid expensive overhead such as a brick-and-mortar wholesale shop or wasted inventory. Green mentions that old-school wholesalers and retailers are hurting most due to grocery stores that offer good-enough quality product.
Despite wholesale bypass, "old school" wholesaling still offers a quality control layer that is irreplaceable. In the industry, relationship building is key to getting the best product and prices. "The depth and breadth of relationships that wholesalers have, they can get us [florists] out of a pinch," says Cameron Hardesty, Head of Products at UrbanStems (personal
communication, April 29, 2016). "Wholesalers filter out a lot of bad product. They know how to
bake it into their pricing - it's an art and skill. Product is generally better because wholesalers
have quality control. Whereas when sourcing directly from farms, no one has checked the product since its left Bogota."
Competitive Landscape
A market, as defined by Robert S. Pindyk, is a collection of buyers and sellers that,
through their actual or potential interactions, determine the price of a product or set of products
(Pindyck, 2012, p. 1). For the purposes of defining Clovette's competitive landscape, offerings
accessible in New York City are considered within the greater domestic lens.
I discovered that creating an attribute space
-
such as a sweetness and crunchiness
attribute space for cereal- for flower arrangements to be challenging, particularly because
arrangements seasonally evolve in design, scale, and color. And, floral companies, each of which
offer a unique assortment of products, have varying value propositions
-
such as degrees of
convenience, freshness and quality, assortment, on-demand delivery
-
that draw customers.
Ultimately, these value propositions are subject to perception, and are points of parity for
long-term sustainability in the industry.
Instead, I decided to review possible points of difference of macro-players in the industry
to define possible markets. These macro-players, which will be more closely defined later on,
are: 1) brick and mortar retail stores with local reach only, 2) ecommerce platforms with national
reach who pass on fulfillment to local brick and mortar retail shops, 3) ecommerce companies,
many professionally funded and with national urban reach, 4) supermarkets and chains, and 5)
major etailers. Possible points of difference among these macro-players are eco-friendly
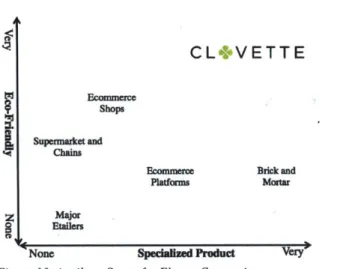
practices/offerings and specialized product. Figure 13 looks at a product attribute space
comparing eco-friendly practices/offerings and specialized product. According to this attribute
space, Clovette's competitors may include brick and mortar, ecommerce platforms, and
ecommerce shops.
CL VETTE
Econmerce Shops Supermarket and Chains Ecommerce Platforms Brick and Mortar Major EtailersNone Specialized Product Very
Figure 13. Attribute Space for Flower Companies
As we review the macro-players, I constructed an "ops diamond" - which considers
quality (of product and service), time (to customer), flexibility (assortment of options), and price
of each category - as well as the market and challenge(s) for each.
Local brick and mortar stores Ops Diamond:
Time
Quality 4 *Fleibility
Price
Market: Local market, B to B and B to C
Challenge(s): High overhead, limited market reach
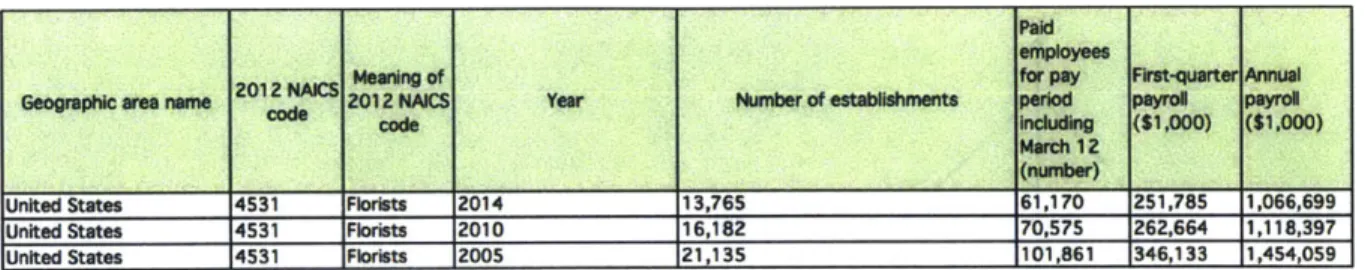
14,000 establishments reported in the most recent US census data in 2014. Consequently, the number of paid employees has also decreased by almost 40 percent, as seen in Figure 14.
Paid employees
2012 NAICS Meaning of for pay First-quarter Annual
Geographic area name code 2012 NAICS Year Number of establishments period payroll payroll
code including ($1,000) ($1,000)
March 12 (number)
United States 4531 Florists 2014 13,765 61,170 251,785 1,066,699
United States 4531 Florists 2010 16,182 70,575 262,664 1,118,397
United States 4531 Florists 2005 21,135 101,861 346,133 1,454,059
Figure 14. Nurnber of Floral Establishments in 2005, 2010, and 2014. United States Census Bureau (United States Census
Bureua, 2014)
In New York City, all five boroughs have 403 reported florists, but the concentration of establishments and sales are in Manhattan; Manhattan (New York County) alone accounts for 49% of total florists who make 66% of total sales in the five boroughs. Details can be seen in Figure 15, which shows number of establishments and sales for New York City (all five boroughs), Brooklyn, and Manhattan. The 2012 NAICS code for "Florists" is defined as: "primarily engaged in retailing cut flowers, floral arrangements, and potted plants purchased from others. These establishments usually prepare the arrangements they sell."
From 2002-2012, the net number of established, value of sales, and annual payroll in New York City declined. The period 2002-2007 reflects an increase on all accounts, but the New York City industry has not recovered since the 2008 market downtown. This reinforces the notion that flowers are a discretionary good, linked to disposable income.
Value of sales,
Nurnber of Annual First-quarter
establishme recipts, payroll payroll
Geographic area nare NAICS code Meaning of NAICS code Year nts revenue, orbuies ($1,000) (S1,000) done
(IS1.000)
4531 Florists 2012 403 216,877 42,062 10,100
New York city, New York 4531 Florists 2007 449 249.907 46,826 1,807
4531 Florists 2002 511 195,949 37,991 1,812
4531 Florists 2012 89 27,467 5,193 1,338
Kings County (part), New York city, 4531 Florists 2007 103 35,269 6,347 314
New York 4531 Florists 2002 107 28,269 5,398 281
NwYrCony(atNwYr 14531 Florists 12012 198 142.077 27,836 6,604
New York county (part), New York 4531 Florists 2007 216 171,269 31,826 1,046
city, New York 4531 Florists 2002 227 122,820 24,050 977
Online wire services that leave fulfillment to local florists
Ops Diamond:
Time
Quality e 1Flexibility
Price
Market: Nationwide, two-sided market that must attract both florists and end customers Challenge(s): Quality control of florist clients, growth and retention of user base
With the exception of 1-800-Flowers.com, these online platforms don't have brick and mortar retail shops. Rather, they take online orders and partner with local florists for fulfillment. The industry's big three services, which include 1-800-Flowers.com, FTD.com and
Teleflora.com, incur revenue from both membership fees from local florists who use their service, and from a percent of every order fulfilled (Carter, 2015, p. 6); these fees and
percentages-off-the top add up to almost 30%, barely leaving enough buffer for local florists to break even. Though these platforms may help florists to create lead generation, florists are locked into certain styles and prices dictated by the platforms, as well as negative reviews from unhappy customers who haven't received flowers similar to the photos online (Cowley, 2016).
New startups, namely BloomNation (bloomnation.com), are attempting to change this landscape. BloomNation charges a 10% flat fee on all fulfilled orders and the company allows
15-20% a month in revenue, and is on track to make $45 million in annual revenue (Chaussee, 2015) (Cowley, 2016) (Steinmetz, Inside the Startups Making it Easier to Buy Flowers, 2016).
Compare that to 1-800-Flowers.com. founded in 1976, which acquired Harry & David in 2015 and reported less than $32 million in industry specific revenue for 2015 (1-800-Flowers.com,
2015) (Carter, 2015, p. 24).
Ecommerce startups with multi-city reach
Ops Diamond:
rime
Quality .40Fleibility
Price
Market: Mostly nationwide, B to C
Challenge(s): Supply chain optimization, low margins
These ecommerce startups are not platforms utilizing local florists for fulfillment, but
essentially function as an almost on demand florist - delivering same day to next day, depending
on a customer's location - without a brick and mortar presence. Currently, the major names in
this market include BloomThat (bloomthat.com) UrbanStems (urbanstems.com), The Bouqs Co. (thebouqs.com) and Farmgirl Flowers (farmgirlflowers.com). In the New York market, other
shops gaining traction include Ode a la Rose (odealarose.com), which received an undisclosed professional investment in 2014, Landeau (givelandeau.com), which originally launched in
Vancouver in 2014; these shops offer uniquely packaged floral gifting options, to be discussed in more detail during our marketing discussion.
The major players - BloomThat, UrbanStems, The Bouqs Co., and Farmgirl Flowers
-originated in different geographic locations and have varying value propositions, but all have multi-city if not national reach. Most importantly, these shops are looking to change or optimize the supply chain. Figure 16 compares these four players.
Launch Funding Annual Headquarters Reach Sourcing Pricing Delivery Delivery
Date Revenue Fee Time
BloomThat 2013 $7.6 million $5 million San Francisco National American $30- $10-$24 Same day
through in 2015 farms $86 next day
Series A
only
UrbanStems 2014 $1.5 million Undisclosed Washington DC and South $35- Free Same
seed D.C. parts of American $105 day
funding; NYC completed Series A for $6.8 million in April 2016
The Bouqs 2012 $19.1 Undisclosed Los Angeles, National American $40- Free Same
Co. million seed CA + foreign $90 day to
funding several
Farmgirl 2010 Bootstrappe $4.5 million San Francisco National American $50- $10-$25 Same
Flowers d in 2015 farms $195 day to
I_ I_ I_ _ Ionly next day
Figure 16. Comparison of Econonerce Shops. Created with in/frmnation from companv websites, and (Allen N. . 2016) (Daw son.
2016) (Marinova, 2016) (Steinmetz, Mother's Day Flowers: 6 Blooming Startups to Try This Year, 2016)
BloomThat, a YCombinator startup launched in 2013, originated in San Francisco, moved into the New York market in mid-2015, and launched a nationwide offering in early
2016. UrbanStems started in Washington DC in February 2014, and reached the New York
market first in December 2014 before BloomThat (Kabas, 2014). According to Hardesty, Head of Product at UrbanStems, the company has stayed focused on the on demand model in DC, Manhattan, and Brooklyn (personal communication, April 29, 2016). With their recent Series A funding of $6.8 million in April 2016, Urban Stems will expand their on demand model to
restricts the company to on demand offerings only available in certain major cities including San
Francisco and Manhattan.
Both BloomThat and UrbanStems offer a streamline assortment of seasonally changing
products of bouquets and arrangements, as well as aesthetically similar offerings, which include
cut flowers wrapped with burlap sold at an industry low price point that ranges between
$30-$105.
Though BloomThat started with production onsite at their domestic warehouses, they have
since changed their distribution model to accommodate their nationwide reach
-
the company
creates designs at headquarters and trains farms to fully assemble the bouquets on site
(Marinova, 2016). UrbanStems also has certain designs manufactured internationally at farms
but others are created stateside; the company has distribution centers in New York and
Washington. UrbanStems, believing that couriers are the face of the company and that
wraparound customer service is their value-add to the market, handles all deliveries in-house on
bike messenger (Hardesty, personal communication). BloomThat outsources delivery to FedEx
(Constine, 2015). Both companies draw customers with their easy and reliable services, quick
deliveries, and low prices.
The Bouqs Co. overtly communicates the eco-friendly farm-to-table ethos of the
company, and. offers a much larger array of seasonally changing bouquets designed and fulfilled
by domestic and South American farms. Flowers are cut the day of the order, and customers can
add-on a vase with most orders to assemble the flowers when delivered. Delivery time from
domestic farms can be within one day, and delivery from South American farms occur within a
week
-
currently, the company does not have an on demand model. The company works
exclusively with farms certified by Veriflora and The Rainforest Alliance, and asserts a
sustainable mission of waste reduction, since flowers are shipped directly from farm to customer, which eliminates potential damage from wholesalers and retailers (Allen N. ,2016).
Farmgirl Flowers works solely with American growers, and fulfills all orders from an outpost in the San Francisco market. The company typically offers one "designer's choice" bouquet option a day, and customers can select based on scale, from a small bouquet starting a $45 to the largest bouquet at $195. Customers actually don't see what they're buying, though they can see photos of previous arrangements so they have a sense of the company's aesthetic and scale (Steinmetz, Inside the Startups Making it Easier to Buy Flowers, 2016). Most of the offerings for orders outside of San Francisco are unarranged cut flowers wrapped in burlap, with options for add-ons that include chocolate, candles, baked goods, gummies, and of course vases for recipients to use for assembly. Owner Christina Stembel bootstrapped the company from
$56,000 revenue in 2010 to $4.5 million revenue in 2015 (Decker, 2015).
All these players have optimized the supply chain in various ways, and each must work
within the framework set by their distribution decisions. Manufacturing bouquets on site at farms limit companies to the floral offerings of that particular farm. Columbian and Ecuadorian farms offer cost-effective material and labor, but their material is mostly standard and not as
specialized. Hardesty from UrbanStems mentions, "Though these farms are great on moving flowers and transportation logistics, big farms move really slowly on trends. They want to go with the same bet, and it's harder to get on-trend product." Likewise, Farmgirl Flowers is limited
by the product offering produced by domestic farms. In addition, all the players with nationwide
reach have to outsource delivery; they must depend on their partnerships with companies like FedEx to ensure timely delivery of perishable product.
Supermarkets and Chains
Ops Diamond:
Time
Quality 0(rFexibiuly
Price
Market: Mostly nationwide, B to C
Challenge(s): Entering higher end gifting or floral event markets
Supermarkets and chains are rapidly taking a share of the market. According to the Society of American Florists, 73% of consumers typically purchase flowers for themselves at supermarkets, versus 61% who purchase from a local shop (Carter, 2015, p. 4). In the past five years, supermarkets have expanded the assortment of floral offerings, drawing price-sensitive customers who don't require delivery services typical of gifted items.
John Agnew is a Senior Buyer at Whole Foods Market who oversees flower departments in 34 stores in the Northeast region. According to Agnew, Whole Foods Market is "always trying to make sure we're offering what customers want, that they're wowed, and that they're getting fair pricing" (personal communication, April 28, 2016). Agnew sources mainly from local and domestic growers for seasonal product, only importing what he can't get locally. He credits buying power and traffic flow as two of Whole Foods Market's main competitive advantages compared to brick and mortar shops. Convenience and price competitiveness also seems to be incentives. For example, some stores have a section called "3 for $15", offering three bouquets
for $15; if a customer wanted to combine the bouquets, a Whole Foods employee would combine and wrap.
Etailers with floral collection
Ops Diamond:
Time
Quality itFlexibility
Price
Target Market: Nationwide, price-sensitive Challenge(s): Unknown
Amazon launched a collection in September 2013 called Benchmark Bouquets (amazon.com/benchmarkbouquets). At the time going to print, I was unable to finalize a call with Amazon to understand their move into the market.
Consumers
Flowers are a discretionary item, so demand is linked to consumer sentiment, price, seasonal fluctuations, and particularly disposable income and consumer spending. Supermarkets, chains, and cost-effective online retailers draw price-sensitive consumers. Substitutable goods include other gifted items such as wine and high-end sweets like chocolates and macarons.
Sentiment for flowers, willingness and ability to pay, and overall shopping behavior range significantly based on generation. According to Figure 17, for brick and mortar flower
shops, the two buckets of consumers - under 30 years of age and between 31-44 years of age
-each account for only around 10% of the total market. Alternatively, the segment of consumers aged 45-64 accounts for 20.7% of the market. This segment has a higher regard for flowers, and tend to shop locally for higher quality products. Interestingly enough, there is a fairly equitable split for online flower retailers: Generation Y (ages 16-31) accounts for 27%, Generation X (ages
32-50) accounts for 32%, and Baby Boomers (ages 51-69) accounts for 24%. Consumers under
34 years of age are price-sensitive and don't perceive flowers to be as meaningful, so typically purchase at supermarkets and online retailers. Consumers aged 35-44 have more spending power, but less time; though they perceive flowers to be more meaningful than their younger counterparts, they purchase at online retailers for convenience (Carter, 2015). On a quick side note, I think it's valuable to note that regard for flowers among the younger generation,
particularly those in their mid to late 20s and 30s, may be shifting. If Instagram or Pinterest is
any indicator, there is much enthusiasm for beautiful flowers and the profession of floristry.
For Florists (Brick and Mortar) For Online Flower Shops
Major market segmentation (2015) Major market segmentation (2015)
9A% 3.5%
9a5% Consu o ve65
10.0% . 2 0 ealf.', 0 ns ers ns Funeras
22.0
10.0% Wft.Generation, X Consmersunde 34240% 20.7% Buby b mrs 10.9% *"*'"*"*ge 4 t 6 Consumers aged 35 to 44 27.0% 17.0% Genertion YTotal $5.8bn Buinesses Total $3.5bn -
--Figure 17. On Left, Market Segnentationtfor Florists (Carter, 2015) vs. On Right, Market Segmentation ]br Online Flower Shops
(Lerman, 2015)
Furthermore, consumer behavior is impacted by gender. In order to get a better sense of the market, I conducted basic primary market research during the spring of 2015. The research
50. This research indicated that females tend to gift more often to friends than men gift to others,
and that females are the majority end-user of flowers. My research is corroborated by
ecommerce shops who have also reported at least 75% of their customers are female; though men usually send flowers on holidays such as Valentine's Day and Mother's Day, they don't on a daily basis (Steinmetz, Inside the Startups Making it Easier to Buy Flowers, 2016) (Decker,
2015).
Regardless of consumer reports that claim younger generations don't have appreciation
flowers, for male consumers - particularly in their later 20s through 40s - there is perceived
value in gifting during holidays such as Valentine's Day (Lerman, 2015) (Rihn, Yue, Behe, & Hall, 2011). According to a recent survey by the National Retail Federation, of the 54.8% of consumers who celebrate Valentine's Day, a little over a third said they would purchase flowers and would spend an average of $40.57. In Figure 18, men exceedingly purchase flowers above
all other gifted items. Overall though - across all gifted items that include candy, jewelry, an
evening out, and clothing - $146.84 was spent on average for Valentine's Day gifting (Allen &
Reynolds). Perhaps by bringing more value to male purchasers, willingness to pay could increase during holidays such as Valentine's Day.
Percentage of Americans Celebrating Valentine's Day, by Age Who's Buying What for Valentine's Day?
66,0% 60.5
55.0
49.5 1
44.0 (ar'dy lowe Jewely I Greetig EveningOut Clothing GiftCard
18-24 25-34 35-44 45.54 55-64 65+ Cards
FrMen a .WeDB
Data Collection and Analysis
Consumer Preferences Survey
The purpose of this survey is to test whether there is correlation between a user's
characteristics and preferences, such as for fashion or home decor, with floral taste. Before I
assembled the survey, I decided to first research the offerings available to the New York City
market, as well as discover the scope of preferences among New York City friends and
colleagues.
Lookbook. I began my research by creating a Flower Lookbook of six categories that
reflect the varying offerings in the New York market today. I chose to look at designs by
specialty upscale retail and event design shops, and ignored the bodegas and ecommerce shops.
The upscale shops typically display a signature look that can be clearly defined, whereas the
bodegas and ecommerce shops often offer an assortment of "less designed" looks.
Growing up in a small town in Northern California, I recall choosing between two local
florist brick and mortar retailers who offered standard options for prom corsages and
boutonnieres. However in New York City, floristry is more of an art; each florist can fall under a
category of "style" with subtle differences within the category. There is a florist for every type of
aesthetic, ranging from the most modern to the traditional. For example, one look is a modern
style offered by florists such as L'Olivier Floral Atelier (lolivier.com); flowers are typically
designed in a cleaner or clustered manner, in clear glass vessels of varying shapes. Another look
is a more traditional aesthetic offered by florists such as Putnam & Putnam
(putnamflowers.com); flowers are usually designed in a looser manner with blooms of more
neutral shades, in a traditionally shaped vase such as a pedestal. The differences in aesthetic and
mood can be observed in Figure 19 below.
Modern aesthetic. Traditional aesthetic, by L'Olivier Floral Atelier by Putnam & Putnam
Figure 19. An Example of Stylistic Differences in the New York Market
Friends and Family Pinterest Test. While creating the Lookbook, I simultaneously
sought out New York City residents, female friends and colleagues from various professions, to pin their favorite categories of home ddcor, fashion/celebrity style, travel destinations, and flowers. Though the Lookbook provided an organized categorization of the market offerings as I
saw in the market, I wanted to see others' overall preferences for flowers to ensure I was
covering the breadth of options. Furthermore, I was curious about current trends and preferences for home ddcor, fashion style, and travel destinations. And, about whether I would initially be able to identify any correlation between those preferences and floral taste.
Each person was sent an email with the following: "We are looking for help in creating
our Lookbook profiles. How you would help is by using Pinterest and pinning your
favorite
things in thefollowing
categories: Travel Destinations, Flowers, Home Decor, andFashion/Celebrity Style. You can pin as many things as you want (we do ask for a minimum of 5 pins in each category) and do it at your own leisure."
I received complete Pinterest boards from ten respondents. These boards provided me
and clean home ddcor. Regarding floral taste, this respondent mostly chose semi-loosely designed arrangements in a similar pinkish berry color palette with some contrasting color and mixed tones. One caveat regarding this Pinterest test is that Pinterest's algorithm tends to show
its users similar images based on images they've already pinned. So, a number of pinned images, say of actress/entrepreneur Jessica Alba, may not necessarily mean that a user loves Alba. It could simply be that the user pinned one image of Alba, and Pinterest made suggestions for other similar images in Alba's likeness.
s Favorite Things:
004B
IV
Figure 20. An Example of a Pinterest Page fom Respondent
Survey. I compiled all the imagery from the Lookbook and Pinterest boards to review as I assembled the survey. The survey, called "Discovering Floral Preference" was built on
Sawtooth Software and consisted of three parts: Part One, with six questions, determined a respondent's preferences for fashion style, fashion brands, home decor, travel destinations, art, and music. Part Two, with 1 1 questions, inquired about floral preferences. Part Three, with six questions, captured demographic information. Altogether, the survey had 23 questions.


![Figure 17. On Left, Market Segnentationtfor Florists (Carter, 2015) vs. On Right, Market Segmentation ]br Online Flower Shops (Lerman, 2015)](https://thumb-eu.123doks.com/thumbv2/123doknet/14342812.499470/39.918.116.760.754.919/figure-market-segnentationtfor-florists-carter-market-segmentation-online.webp)