Climate Policy and the Airline Industry: Emissions Trading and Renewable Jet Fuel By
Dominic A. T. McConnachie B.Sc. Mechatronics Engineering
University of Cape Town, 2008 M.Sc. Cognitive Science
ENS, EHESS and Paris Descartes, 2010 Submitted to the Engineering Systems Division in Partial Fulfillment of the Requirements for the Degree of
Master of Science in Technology and Policy at the Massachusetts Institute of Technology
June 2012
C 2012 Massachusetts Institute of Technology. All rights reserved.
MASSACHUSETTS INSTITUTE OF TECHNOLOYC
JUN 13 2012
L
BRARIES
ARCHIVES
The author hereby grants to MIT the permission to reproduce and to distribute publicly paper and electronic copies of this thesis document in whole or in part.
Signature of author:
Engineering Systems Division Technology and Policy Program
y16, 2012 Certified by:
nA. Waitz
D an of Engineering Jerome C. Hunsaker Professor of Aeronautics and Astronautics Thesis Supervisor Accepted by:
Joel P. Clark P fe or of Materials Systems and Engineering Systems Acting Director, Technology & Policy Program
Climate Policy and the Airline Industry: Emissions Trading and Renewable Jet Fuel By
Dominic A. T. McConnachie
Submitted to the Engineering Systems Division on May 16, 2012 in Partial Fulfillment of the Requirements for
the Degree of Master of Science in Technology and Policy
Abstract
In this thesis, I assess the impact of the current EU Emissions Trading Scheme and a hypothetical renewable jet fuel mandate on US airlines. I find that both the EU Scheme up until 2020 and a renewable jet fuel mandate of 1 bn gallons per year from 2018 to 2022 would have a small impact on US airlines and emissions, and operations would continue to grow by -3% p.a.
I find that if carriers pass on all additional costs to consumers in the EU Scheme,
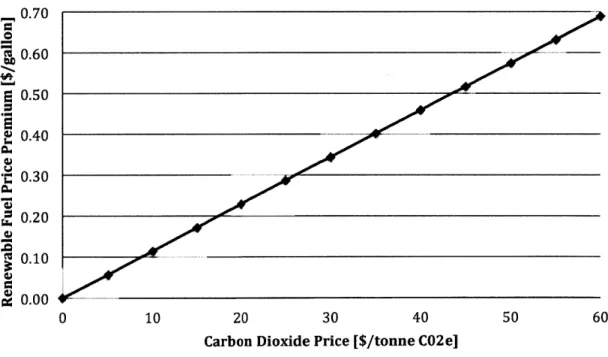
including the opportunity costs associated with free allowances, windfall gains may be substantial at about $2.6bn because under current allocation rules, airlines would only have to purchase about a third of the required allowances. However, an increase in the proportion of allowances auctioned would reduce windfall gains and profits for US airlines would decline. If airlines pass on only allowance expenses airlines do not receive windfall gains. Out-of-sector abatement is estimated at about a third of airline emissions for the North Atlantic routes, compared to the estimated 1.6% in-sector emissions reductions due largely to reductions in demand under the EU Scheme. Under proposed EU legislation, airlines can use renewable jet fuel instead of purchasing emissions allowances. I find that the current allowance price would make it cheaper for airlines to purchase renewable jet fuel only under conditions where the renewable fuel price premium is 10 cents per gallon or less.
I find that a renewable jet fuel mandate of 1bn gallons per year for US commercial
aviation (about 4% of the total fuel use) with renewable jet fuel price premium of $1.50 would increase airline fuel costs by ~2% and reduce greenhouse gas emissions by between 2% and 4%. Emissions would continue to grow and reach approximate 2018 levels by 2022.
I use the social cost of carbon, with a baseline value of $100/tCO 2e, to calculate the
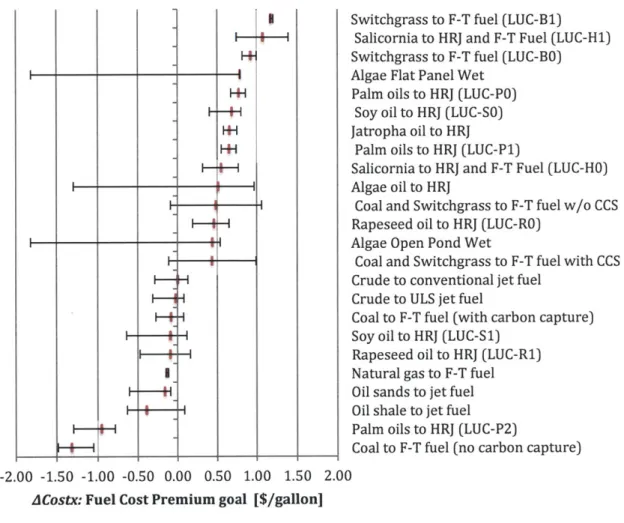
societal cost-effective price premium of renewable jet. I find that fuels can have a price premium of between 40c and $1.30 per gallon, depending on life cycle greenhouse gas reduction. Renewable jet fuels examined in this thesis, including the only commercially available fuel, currently have price premiums of more than $2 per gallon and a calculated greenhouse gas abatement cost of more than $250/tCO2e.
This thesis shows that the emerging renewable jet fuel industry needs to reduce costs to achieve greenhouse gas abatement costs, and therefore societal benefits, comparable to the social cost of carbon or EU allowance costs. It also shows that for the fuels examined with currently estimated prices, the EU Scheme, and the now defunct Waxman-Markey Bill would be lower cost options of greenhouse gas abatement for airlines than a renewable fuel mandate, and in any case would not preclude the use of renewable fuels should they be produced with lower price premiums.
Thesis Supervisor: Ian A Waitz
Title: Dean of Engineering, Jerome C. Hunsaker Professor of Aeronautics and Astronautics
Acknowledgements
I would like to thank and acknowledge those colleagues and friends who supported this research. Firstly I would like to thank my research supervisor, Dean Waitz. It has been a privilege working with somebody with such integrity, experience and wit! I would also like to thank Dr. Christoph Wollersheim who has been an exemplar academic and professional mentor and whose support has been integral to the successful completion of this research.
I would like to thank Dr. Robert Malina from PARTNER for his help and insight, and Dr. Niven Winchester and Dr. Sergey Paltsev from MIT's Joint Program for their support of this research. Chapter 2 of this thesis is closely based on a paper titled "The Impact of the EU Emissions Trading Scheme on US Aviation" published in the Journal of Air Transport Management, coauthored by the above authors and myself.
I would like to thank the following students and researchers who provided invaluable collaborative support and made my time at PARTNER and MIT exciting and fun. In particular Dr. James Hileman, Nick Carter, Michael Bredehoeft, Matthew Pearlson, Mark Staples and Dr. Hakan Olcay from the Alternative Fuels Team at PARTNER as well as Nicolas Jost, Chris Gillespie, Philip Wolfe, Jim Morrison and Jamin Koo.
I would also like to thank Jennie Leith and Robin Palazzolo from AeroAstro and Krista Featherstone and Ed Ballo from TPP as well as Mary Alice Locke and Thomas Cuddy from the Federal Aviation Administration for their help and support. Finally I would like to thank my family, friends and wife, Frances Maughan-Brown, for their support.
Of course, any errors are the author's alone. This work was partly supported by the US Federal Aviation Administration Office of Environment and Energy under Award Number: 06-C-NE-MIT.
Table of Contents
Abstract ... 3 A cknowledgem ents... 4 Table of Contents ... 5 List of Figures ... 7 List of Tables...9 1 Introduction ... 11 1.1 M otivation ... 11 1.2 Research Approach ... 13 1.3 Thesis Contributions ... 14 1.4 Thesis Organization... 152 The Impact of the European Union Emissions Trading Scheme on US aviation ... 17
2.1 Introduction ... 17
2.2 M odeling Fram ework... 19
2.3 Results ... 24
2.4 W elfare Analysis ... 28
2.5 Sensitivity analysis... 30
2.6 Renewable Jet Fuel U se in the EU -ETS... 34
2.7 Conclusions ... 36
3 Estimating Renewable Jet Fuel Abatement Cost Goals and Assessing the Impact of a Hypothetical Renewable Jet Fuel Mandate on US Aviation... 39
3.1 Introduction... 39
3.1.1 Jet Fuel Technology ... 41
3.2 Renewable Jet Fuel Life-Cycle Greenhouse Gas Abatement Cost Goals...43
3.2.1 An equation for renewable jet fuel greenhouse gas abatement cost ... 43
3.2.2 The Social Cost of Carbon, Renewable Jet Fuel Premium and LC-GHG em issions...45
3.2.3 Deriving Renewable Jet Fuel Cost Premium Goals Using the Social Cost of Carbon48 3.2.4 Estimating renewable jet fuel cost premium goals using the SCC ... 50
3.2.6 Conclusion and D iscussion ... 57
3.3 The Impact of a renewable jet fuel mandate on US aviation ... 59
3.3.1 Introduction ... 59
3.3.2 The Reference Scenario ... 62
3.3.3 M andate Scenarios ... 69
3.3.4 Conclusion... 75
4 Conclusion...77
5 References ... 81
6 A ppendix...90
6.1 Appendix I: Overview of Renewable Fuel Legislation in the US... 90
6.2 Appendix II: Cost Prem ium Goals... 98
List of Figures
Figure 1. Changes in 2012-2020 average profit margins relative to BaU for alternative
dem and forecasts, % ... 31
Figure 2. Changes in 2012-2020 average profit margins relative to BaU for alternative allow ance allocations, % ... 32
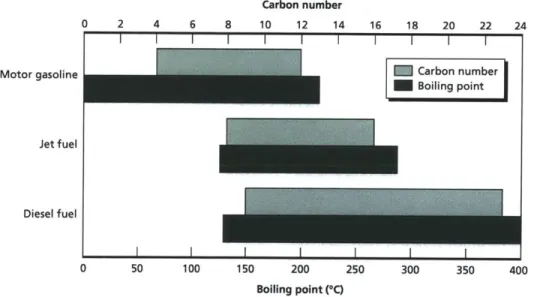
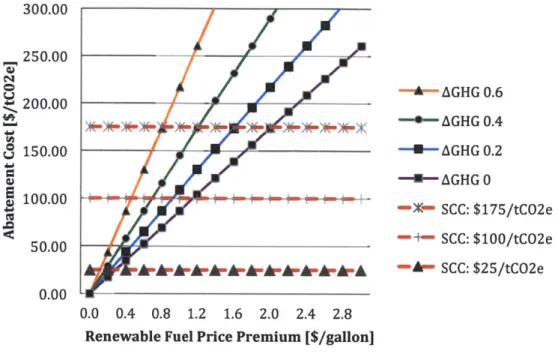
Figure 3. The relationship between allowance price and renewable fuel price premium. 35 Figure 4. Typical distillation ranges and carbon-number ranges for fuels (Hileman et. al., 2 0 0 9 )...4 1 Figure 5. GHG abatement cost as a function of renewable fuel price premium for different A G H G ... 49
Figure 6. Societal Cost-Effective Renewable Jet Fuel Cost Premium Goals... 52
Figure 7. Comparison of Industry and Literature Cost Estimates and Cost Premium G o als...5 5 Figure 9. RFS2 Mandated Advanced Biofuel in 2018 [billion gallons] including assumed civil mandate scenario. (Data from Carter et al. 2011)...61
Figure 10. FAME and HEFA in the US (Data from EIA, 2012a)...63
Figure 11. Flow chart for transformation of lipid materials to products of engine com bustion (K nothe, 2010)... 64
Figure 12. Biodiesel (FAME) Blend Wall Schematic...66
Figure 13. RFS2 2010-2035 and EIA forecasts. (EIA, 2012a). ... 68
Figure 14. Gallons of jet fuel consumed in the US and scenarios. ... 70
Figure 15. Increase in jet fuel price for different renewable fuel price premiums in the civil m andate scenario... 71
Figure 16. Civil scenario impacts on jet fuel prices...72
Figure 17. Reference and Civil Mandate Scenario GHG emissions for two estimates of L C -G H G ... 7 3 Figure 18. Percentage change between Reference and Civil Mandate Scenario GHG emissions for two estimates of LC-GHG. ... 74
Figure 19. RFS2 Schedule under the Energy Independence and Security Act of 2007....91
Figure 20. Schematic of nested RFS2 fuel categories... 92
List of Tables
Table 1. Cumulative US carrier outcomes on the North Atlantic, 2012-2020...25
Table 2. Cumulative US carrier outcomes on all routes, 2012-2020...28
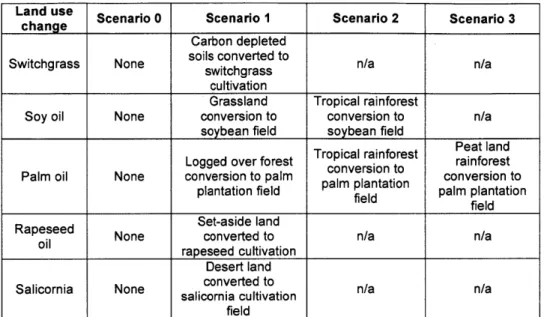
Table 3. Cumulative consumer and producer surplus changes relative to BaU ($, billion), 2 0 12 -2 02 0 ... 2 9 Table 4. Land use change scenarios (Stratton et al., 2010, pg 96)... 51
Table 5. Literature Price Estimates: Assumptions and Sources...54
Table 6. Industry Price Estimates: Assumptions and Sources. ... 54
Table 7. Literature Estimates Results... 56
Table 8. Industry Estimates Results... 56
T able 9. Scenarios. ... 62
Table 10. R esults.... ... ... 72
Table 11. Scenario greenhouse gas emissions results...74
Table 12. RIN equivalency values. Source (ERS, 2011). ... 93
Table 13. LC-GHG emissions per Mega Joule. ... 98
Table 14. LC-GHG emissions per gallon... 98
Table 15. LC-GHG normalized to baseline conventional jet fuel...99
Table 16. Cost premium goals of low ($25/tCO2e), medium ($1 00/tCO2e) and high ($ 175/tC O 2e) SC C ... 100
Table 17. Literature Estimates Assumptions...101
Chapter 1
1 Introduction
1.1 Motivation
Air transport currently accounts for a small but increasing proportion of greenhouse gas emissions from human activity. In 2010 the air transport industry emitted 2% of global carbon dioxide emissions (IATA, 2011). Between 1971 and 2009, air transport's carbon dioxide emissions grew by 153% while global carbon dioxide emissions grew by 102% (IEA, 2010)1. The Intergovernmental Panel on Climate Change (IPCC) estimates that by 2050 air transport carbon dioxide emissions will account for 3% of carbon dioxide emissions from human activity (IPCC, 2007).
There is good evidence that carbon dioxide and other greenhouse gasses will change the earth's climate and pose risk to human and natural systems. The International Panel on Climate Change (IPCC) report in the Climate Change 2007: Synthesis Report that: "carbon dioxide is the most important anthropogenic greenhouse gas", and conclude that "there is very high confidence that the net effect of human activities since 1750 has been one of warming" (IPCC, 2007). In the United States, the National Academy of Sciences report that: "climate change is occurring, is very likely caused primarily by the emission of greenhouse gases from human activities, and poses significant risks for a range of human and natural systems" (NAS, 2011). Other scientific institutions agree. In October 2009 the American Association for the Advancement of Science (AAAS) and seventeen other groups, including the American Geophysical Union and the American Meteorological Society, wrote a letter to the United States Senate stating that: "observations throughout the world make it clear that climate change is occurring, and rigorous scientific research demonstrates that the greenhouse gases emitted by human activities are the primary driver" and that "the severity of climate change impacts is expected to increase substantially in the coming decades". (AAAS, 2006)
1In an analysis of 139 studies, Gillen et al. (2003) find that aviation has a median income elasticity demand of 1.39.
In the context of growing concern about climate change, there has been both national and international discussion about reducing aviation's carbon dioxide emissions. At the international level, the International Air Transportation Association (IATA) has implemented industry goals to cap aviation carbon dioxide emissions from 2020 (carbon-neutral growth), achieve an average improvement in fuel efficiency of 1.5% per year from 2009 to 2020 and reduce carbon dioxide emissions by 50% of 2005 levels by 2050 (IATA, 2009). In October 2010 the United Nation's International Civil Aviation Organization (ICAO) adopted resolution A37-19 (ICAO, 2010a) with similar aims to IATAs. In 2008, the European Commission adopted directive 2008/101/EC, to include aviation in the European Union (EU) Emissions Trading Scheme (ETS), effective January 1st 2012. Under the EU-ETS, all flights originating or departing from airports within the EU, irrespective of carrier nationality, have to acquire allowances to cover carbon dioxide emissions.
In the United States regulation pertaining to carbon dioxide emissions continues to be controversial. Although the United States ratified the 1997 Kyoto Protocol, no president has either signed, or rejected, the protocol. However, the United States has seen developments in terms of regulating greenhouse gas emissions. Since January 2011, The United States Environmental Protection Agency (EPA) has regulated greenhouse gas emissions from certain stationary and mobile sources under the Clean Air Act. Likewise, in June 2009 the House of Representatives approved The American Clean Energy and Security Act, also known as the Waxman-Markey Bill. The bill would have established a US emissions trading scheme. However, the bill did not pass a vote in the Senate (H.R.2454, 2009). In 2011 the United States Federal Aviation Administration announced
Destination 2025 which includes the stated goal "...one billion gallons of renewable jet
fuel is used by aviation by 2018". (FAA, 2011)
While these regulations and goals are likely to be of great importance in reducing aviation's carbon dioxide emissions, they may result in an effective increase in airline fuel cost, and resulting decrease in airline operations, as shown by Malina et al. (2012) and Winchester et al. (2011) for the EU-ETS and the Waxman-Markey Bill respectively. Air transportation is vital to the global economy and so the impacts of such policy should
be carefully considered. In 2010 ICAO member airlines2 carried 2.56 billion passengers and 48 million tonnes of freight using 24,684 aircraft (ICAO, 2010b) serving 3750 airports and resulting in 33 million people being employed by the airline industry and related tourism (ATAG, 2008). In 2007, the global air transport industry accounted for 7.5% of world GDP, or more than $3.5 trillion per year (ATAG, 2008). It is therefore important to adopt regulation that will both reduce greenhouse gas emissions, and have as little negative impact on air transport as possible. Given this background, in this thesis I set out to explore and compare the impact of select climate legislation on the United States aviation industry3.
1.2 Research Approach
In this thesis I assess the impact of the European Union Emissions Trading Scheme (EU-ETS) on US aviation. I also investigate the impacts of a hypothetical renewable jet fuel mandate on US aviation as well as quantify the greenhouse gas abatement cost and abatement cost goals of select renewable jet fuel pathways.
These three research threads are intended to stand independently. However, there is much interaction and relevance between each section. The research is broken down into four research questions:
Research Question 1: What is the impact of the EU-ETS on US aviation?
Research Question 2: What are the GHG abatement costs of renewable jet fuels? Research Question 3: What is the impact of a hypothetical renewable jet fuel mandate on US aviation?
Research Question 4: Is it currently cheaper for airlines to purchase renewable jet fuel or emissions allowances in an emissions trading scheme?
A brief overview of research methodology follows. Chapter 2 addresses research question 1. The chapter research methodology follows Winchester et al. (2011) and Jost (2011). An economy-wide computable general equilibrium (CGE) model is used in conjunction with an airline partial equilibrium model. The CGE model is used to determine the impact of the EU-ETS on fuel prices and Gross Domestic Product (GDP), and the partial
2 Comprising the vast majority of airline traffic with its 191 member countries.
3 I select the US aviation industry because this research was partly funded by the US Federal Aviation
equilibrium model is further developed and used to assess the impact of the EU-ETS on US airlines. The chosen CGE model is the Emissions Prediction and Policy Analysis (EPPA) model. The EPPA model is a recursive dynamic model of the global economy that links GHG emissions to economic activity (Paltsev et al., 2005)4. I model the aviation industry using the Aviation Environmental Portfolio Management Tool for Economics (APMT-E). A Matlab and SQL script was written to connect EPPA and APMT-E. The APMT tool suite is designed to assess the effects of aviation on the environment, and APMT-E focuses on airline responses to policy changes. The model has been used in support of International Civil Aviation Organization/Group on International Aviation and Climate Change (2009) and International Civil Aviation Organization/Committee on Aviation Environmental Protection (2010) and is outlined by MVA Consultancy (2009). In the model, airlines can respond to carbon dioxide costs by raising prices (and flying less) and, when purchasing new aircraft, selecting more fuel efficient alternatives. The model is calibrated using 2006 data from the Bureau of Transport Statistics Form 41 PS2, ICAO and the Aviation Environmental Design Tool (AEDT) based on the System for Assessing Aviation's Global Emissions or SAGE.
To investigate research question 2, renewable jet fuel abatement costs, I apply an analytic relationships from the literature (CBO, 2010 and DEFRA, 2008), which I re-derive for my purpose. Research question 3, the impacts of a mandate, is investigated using a heuristic model and through a literature review and descriptive approach, and research question 4 is investigated by combining results from previous sections.
1.3 Thesis Contributions
This thesis adds to an extensive literature on the environmental impacts of aviation, for example Waitz et al. (2004) and IPCC (Penner et al., 1999). In terms of investigating the impact of climate policy on aviation, Winchester et al. (2011), investigate the impact of the Waxman-Markey Bill of US aviation. Although several authors have examined the impact of the EU-ETS on aviation e.g., Anger (2010), Wit et al. (2005), Mayor and Tol (2010), Vespermann and Wald (2010), Chapter 2 of this thesis adds to the literature by
4 Note that the EPPA model was modified and run by Niven Winchester and Chris Gillespie from the
providing a focused analysis on US aviation, as well as adding a welfare economic impact assessment. It also adds to the literature by quantifying when it is cost-effective for airlines to purchase renewable jet fuel as apposed to emissions allowances under recently proposed EU legislation.
Although the existing literature deals extensively with cost and environmental impacts of renewable jet fuels (Stratton et al. (2010), Hileman et al. (2009, 2010, 2011), Pearlson (2011), IATA (201Gb)), chapter 3 adds to the literature in several ways. Section 3.2 relates renewable jet fuel greenhouse gas abatement cost to renewable jet fuel cost premium and life-cycle greenhouse gas (LC-GHG) emissions reduction. While other studies have looked into the greenhouse gas abatement cost of corn ethanol and biodiesel (DEFRA, 2008) and the greenhouse gas abatement cost to taxpayers of ethanol and biodiesel renewable fuel tax credits (CBO, 2010), this thesis relates greenhouse gas abatement cost of current renewable jet fuels. Further, this section adds to the literature by using the social cost of carbon to estimate goals for renewable jet fuel cost premium for different renewable fuel production pathways. This knowledge could be used by industry, airlines and policy makers to estimate fuel cost premium goals. Section 3.3 provides the first analysis of a hypothetical renewable jet fuel mandate.
1.4 Thesis Organization
The thesis is divided into five chapters. An overview of the remaining chapters follows.
Chapter 2 presents research background, approach, results and conclusions regarding the impact of the European Union Emissions Trading Scheme on US aviation (research question 1). This chapter is a slightly modified version of Malina et al. (2012), with an additional analysis of the opportunity for US renewable jet fuel production and consumption on the North Atlantic under the EU-ETS.
Chapter 3 addresses research questions 2, 3 and 4. Renewable jet fuel greenhouse gas abatement cost estimates are addressed and used in the section on assessing the impacts a hypothetical renewable jet fuel mandate.
Chapter 4 discusses and concludes the content of this thesis and provides recommendations for future research.
Chapter 2
2 The Impact of the European Union Emissions Trading
Scheme on US aviation
52.1 Introduction
In 2005, the European Union (EU) implemented an emissions trading scheme (ETS) for certain industries and installations to partially fulfill its obligations under the Kyoto framework to reduce greenhouse gas emissions (European Union, 2003). The EU-ETS is currently in its second phase (2008-2012) and a third phase will operate from 2013-2020. The EU will develop post-2020 climate policies according to future international policy developments and progress in the understanding of the science of global climate change (European Union, 2009a).
The EU-ETS sets progressively lower caps on annual greenhouse gas (GHG) emissions and caps 2020 emissions at 79% of 2005 emissions. The EU-ETS operates in all 27 EU member states plus Iceland, Liechtenstein and Norway. It covers carbon dioxide (C0 2) emissions and nitrous oxide emissions from installations in the energy sector such as power stations, combustion plants and oil refineries, and emissions from most other industrial installations (e.g., iron and steel works; and brick, cement, ceramics, lime, pulp, paper and board manufacturing).
In 2008, the European Commission adopted directive 2008/101/EC, which states that aviation will be included in the EU-ETS from the beginning of 2012 (European Union, 2009b). All flights to or from airports in the 30 ETS countries, irrespective of carrier nationality, will have to acquire allowances to cover CO2 emissions. While the
International Civil Aviation Organization (ICAO) and International Air Transport Association (IATA) generally support market-based policies to abate aviation emissions,
5 Please note that this is a slightly modified version of the paper: "The Impact of the EU Emissions Trading
Scheme on US Aviation", Robert Malina, Dominic McConnachie, Niven Winchester, Christoph Wollersheim, Sergey Paltsev and Ian A. Waitz, Journal of Air Transport Management, Volume 19, March 2012, Pages 36-41. http://dx.doi.org/10.1016/j.jairtraman.2011.12.004. My contribution to this paper included: APMT-Economics modeling, assisting with external data collection and analysis and assistance writing the journal article and editing.
the inclusion of aviation in the EU-ETS has been challenged outside the EU. Some foreign governments and airlines argue that EU-ETS in its current form is both unjustly harmful to airlines and contravenes international treaties, such as the Chicago Convention. In this connection, the US government has requested an exemption from the EU-ETS for US carriers. Additionally, some US airlines and their trade body, the Aviation Transport Association (ATA), have filed a case in the European Court of Justice. A court ruling is expected by early 2012 (Kanter, 2011, ATA, 2011)6. Other countries, such as China, are also calling for exemptions (Flottau et al., 2011). Under current EU legislation, an exemption may be granted for airlines from countries that implement measures "equivalent" to those in the EU to reduce GHG emissions (European Union, 2009b).
In extending the EU-ETS to aviation, the European Commission will allocate aviation allowances for 97% of average annual emissions from 2004-2006 in 2012, and 95% of the same historical average from 2013-2020. However, aviation emissions may exceed the quantity of aviation emissions allowances if aviation buys allowances from other sectors covered by the EU-ETS and/or purchases emissions credits from certain clean energy projects. Under current regulations, 85% of aviation emissions allowances will be granted for free (grandfathered) each year based on each carrier's market share in 2010, and 15% of allowances will be auctioned. However, EU legislation allows policy makers to revise the number of allowances grandfathered from 2015 onwards.
In our analysis, we assess the economic impact of including aviation in the EU-ETS on US airlines. Although several authors have examined the impact of the EU-EU-ETS on aviation (e.g., Anger, 2010), to our knowledge, no study focuses on US aviation. We also add to the existing literature by assessing welfare changes in the aviation industry due to the EU-ETS.
This chapter has five further sections. Our modeling framework is detailed in Section 2.2. Section 2.3 presents and discusses our core results. We conduct a welfare analysis in Section 2.4, and a sensitivity analysis is implemented in Section 2.5. In
6 In March 2012, Airlines for America (formerly Air Transport Association) formally ended this lawsuit against aviation's inclusion in the European Union's Emissions Trading Scheme (EU ETS) (ATW, 2012).
Section 2.6 we explore the opportunity for US airlines using renewable jet fuel under the EU-ETS. Section 2.7 concludes.
2.2 Modeling Framework
Following Winchester et al. (2011), we assess the impact of the EU-ETS on aviation by linking an economy-wide computable general equilibrium (CGE) model with a partial equilibrium model that focuses on the aviation industry. We use a CGE model to determine the impact of the EU-ETS on fuel prices and GDP, and simulate the impact of changes in these variables in a partial equilibrium model of the aviation industry.
Our chosen CGE model is the Emissions Prediction and Policy Analysis (EPPA) model. The EPPA model is a recursive dynamic model of the global economy that links GHG emissions to economic activity and has been widely used to evaluate climate policies (see, for example, Paltsev et al., 2007 and 2009). The model is described in detail by Paltsev et al. (2005).
We model the aviation industry using the Aviation Portfolio Management Tool for Economics (APMT-E). APMT-E is one of a series of models that is being developed by the FAA and the Partnership for Air Transportation Noise and Emissions Reduction Center of Excellence. The APMT tool suite is designed to assess the effects of aviation on the environment, and APMT-E focuses on airline responses to policy changes. The model has been used in support of US-ICAO/GIACC (2009) and ICAO/CAEP (2010) and is outlined by MVA Consultancy (2009). In APMT-E, airlines can respond to CO2 costs by raising prices (and flying less) and, when purchasing new aircraft, selecting more fuel efficient alternatives. The model is calibrated using 2006 data.
APMT-E identifies 23 route groups (e.g., North Atlantic, Domestic US, North America-South America and Europe-Africa). As we wish to determine the impact of the policy on US airlines, our analysis focuses on the North Atlantic. Based on Kincaid and Tretheway (2007), in APMT-E, the price elasticity of demand on the North Atlantic for passenger travel is assumed to be -0.72 and -0.99 for freight.
Existing functionality in APMT-E does not allow us to consider at least two second-order effects of the EU-ETS on US airlines. First, we do not consider the impact of the policy on US carriers on routes outside the North Atlantic, such as decreased US
domestic flights due to reduced connecting passengers from North Atlantic flights. Second, we do not consider asymmetric effects of the EU-ETS on competitiveness. For example, cost increases for US airlines transporting passengers to non-EU destinations via the EU relative to airlines that bypass the EU. This argument has been widely voiced by the EU aviation industry, but Albers et al. (2009) conclude that competitive distortions due to the EU-ETS will be small.
To evaluate the impact of the EU-ETS on US airlines, we need to identify impacts on the North Atlantic route by carrier nationality. APMT-E identifies airline nationality for passenger travel, but not for freight. We extend APMT-E using market share data from the International Air Transport Association (IATA, 2010) and the US Department of Transportation (US Department of Transportation, 2011 a) to estimate freight transported by US carriers on the North Atlantic. We do not consider freight transported by passenger aircraft (belly freight).
Grandfathered permits will be allocated according to 2010 markets shares in total EU-ETS traffic, measured in revenue tonne kilometers (RTKs). In our APMT-E modeling exercises, augmented to identify freight by nationality, the 2010 market share of US carriers is 9%. We validate this figure using data from the Marketing Information Data Transfer (MIDT) database. The market share of US airlines in total European traffic using this database is 10.2%. However, our MIDT market share calculation is biased upwards, as we are only able to obtain cargo data for US operations on the Atlantic. Consequently, our calculations include US cargo to and from several non-European regions, including Africa, the Middle East and India. Additionally, the external calculations apply to traffic to, within and from all European countries, not just EU-ETS countries. For these reasons, and to be consistent with APMT-E baseline assumptions, our allocation of free allowances to US airlines is based on a 9% market share. We consider a US market of 11% in a sensitivity analysis.
Our analysis focuses on the period 2012-2020. We limit our analysis to this time frame as the third phase of the EU-ETS will end in 2020 and information on future provisions is not currently available. We do not consider climate policies in regions other than the EU, so we do not model potential interdependencies between policies imposed
by different regions. APMT-E does not identify individual carriers, so our results represent average industry impacts.
To investigate the impact of the EU-ETS on US aviation, we compare three scenarios with a reference case ("business as usual", BaU). Our reference scenario is based on US-ICAO/GIACC (2009). As we aim to examine the incremental impact of including aviation in the EU-ETS, we modify US-ICAO/GIACC forecasts to account for the impact of the EU-ETS on other sectors. Specifically, using predictions from an EPPA simulation of the EU-ETS that excludes aviation, we update US-ICAO/GIACC fuel prices and demand forecasts. Also, guided by Lee et al., (2001), we assume an annual increase in the fuel efficiency for new aircraft of 1.4%, rather than 1% in the US-ICAO/GIACC forecast. We consider a case with a 1% annual increase in fuel efficiency
as a sensitivity study.
In our scenarios, we calculate an effective fuel price, which is equal to the BaU
fuel price plus the cost of CO2 emissions from fuel combustion. The price of CO2
emissions allowances hovered around 615 per tonne of CO2 (tCO2) for most of 2010
(European Energy Exchange, 2011). There is also evidence that firms are banking allowances for use in later years (Grubb et al., 2009). Consequently, we assume a carbon price of 6 15/tCO2 in 2010 and increase the price by 4% each year. Our 4% annual
increase is approximately equal to the current yield on 10-year German bonds, a low-risk investment, plus a 1% risk premium. EU legislation prevents airlines from selling allowances to other sectors, but there are no restrictions on airlines purchasing allowances from other sectors. Under these regulations, the price of aviation allowances could differ from that for other sectors. However, empirical evidence (e.g., Winchester et al., 2011) and our simulations indicate that CO2 abatement costs are higher for aviation
than other sectors, so it is likely that aviation will purchase allowances from elsewhere. Therefore, we assume that there is a single price of CO2 allowances for all EU-ETS covered sectors. Values in APMT-E are expressed in US dollars. We convert euro values to dollar values using a purchasing power parity (PPP) exchange rate of 1.24 dollars per euro (OECD, 2011).
Airlines' cost pass-through behavior is an important determinant of the impact of the EU-ETS on aviation. Consistent with profit maximizing behavior in competitive
markets, most studies assume that airlines will pass on the full cost of CO2 allowances,
including opportunity costs associated with 'free' allowances. However, airfares may rise by less than the cost of CO2 allowances for at least two reasons. First, there may be
opportunity benefits from using free allowances. Opportunity benefits arise when current traffic is used to determine future allowance allocations. The presence of opportunity benefits creates an incentive for airlines to reduce fares (and expand demand) relative to a case without opportunity benefits. If there are opportunity benefits, airfares will increase by less than the cost of allowances or may decrease.
The allocation of free allowances for aviation in the EU-ETS is currently based on a one-off benchmark using market share data for 2010, measured in RTKs. This benchmark will likely be used until 2020. If the EU follows current regulation, future allocations will be based on market shares in the year ending 24 months before the start of the next trading period (2020). As operations from 2012-2017 and from 2019-2020 would not influence the share of free allowances allocated post 2020, opportunity benefits are unlikely to be present in these years. Opportunity benefits may exist in non-benchmark years, if current market shares depend on past operations, but incentives to inflate market shares in non-benchmark years are likely to be second order. Overall, we expect opportunity costs to be passed on to consumers during all years except 2018.
In 2018, opportunity benefits may exist, but would depend on the proportion of allowances grandfathered for future years. Although there are no historical observations for aviation, the European Commission has decreased the share of allowances grandfathered to other sectors over time. For example, nearly all allowances were grandfathered in the first trading period (2005-2007) and in the third trading period (2013-2020) around 50% of allowances will be grandfathered (European Commission, 2009b). This indicates that the number of allowances which are granted for free to airlines may be reduced, once the introductory trading period for aviation ends in 2020. It therefore appears that opportunity benefits in 2018 will be small.
Market distortions due to imperfect competition are a second reason why airlines might not fully pass on additional costs. Economic theory suggests that full cost pass-through will occur in competitive markets, in which prices reflect marginal production costs and no abnormal profit margins are present. That is, the absence of significant
profits leaves no room for firms to absorb costs without going bankrupt. If a firm has
market power, however, it can charge a price that exceeds marginal production costs and earn higher profits than in a competitive market. The existence of profits leaves room for firms to raise prices by less than the increase in costs without going bankrupt. Under most theories of imperfect competition, an airline will absorb a proportion of costs increases,
so fares will increase by less than the cost of CO2 allowances.
While several empirical studies investigate market structure and cost pass-through for other industries (e.g., Sijm et al., 2006, Ellerman and Joskow, 2008; and Butraw and Palmer, 2008), few studies focus on the airline industry. One exception is Forsyth (2008), which concludes that full cost pass-through is a likely outcome, if airlines do not have
substantial market power.
The number of suppliers is sometimes used to infer market power. Airline schedule data for June 2011 shows that 91% of all routes (defined as airport pairs) on the North Atlantic are served by one or two carriers. At face value, this suggests that airlines have market power on most North Atlantic routes. However, a small number of carriers on a particular route may not be a good indicator of market power as (a) some airport-pairs serve overlapping catchment areas (e.g., EWR-LHR and JFK-LHR), (b) direct routes may compete with routes involving a connecting flight (e.g., SFO and
FRA-BOS-SFO), (c) connecting passengers for whom the non-stop flight is only part of their
journey might select other itineraries (e.g., SFO-AMS-BUD instead of SFO-FRA-BUD) and (d) the threat of entrants (except in congested airports such as FRA, JFK, LHR and ORD) may prevent airlines from offering fares significantly greater than costs.
To assess actual market power on the North Atlantic, it is informative to examine profit margins. According to data from the Bureau of Transportation Statistics (US Department of Transportation, 2011 b), the annual average profit margin for Atlantic divisions of US airlines was 3.4% of operating revenue between 2000 and 2010, and
3.8% between 2006 and 2010. These profit margins are lower than the average profit
margin for publicly listed US companies, which was 5.3% between 2000 and 2010 and
4.8% between 2006 and 2010 (Damadoran, 2011). Therefore, we conclude that the North
Atlantic market for air services is, on average, competitive. This conclusion is consistent with the antitrust immunity analyses conducted by the US Department of Transportation.
In its tentative decision to grant antitrust immunity for a joint venture between oneworld airlines on some North Atlantic operations, the US Department of Transportation stated that, "no single airline [on the North Atlantic] has a dominant share of nonstop passengers, indicating a general competitive market" (US Department of Transportation, 2010).
Overall, because we conclude that opportunity benefits are likely to be small and that the North Atlantic route is competitive, we believe airlines are likely to pass on all costs associated with CO2 allowances. When firms pass on all costs (including opportunity costs) and allowances are grandfathered, firms receive windfall gains (William-Derry and de Place, 2008). Nevertheless, we acknowledge that imperfect competition among airlines and the presence of opportunity benefits may result in airfares rising by less than the cost of CO2 allowances. To account for uncertainty about airline
behavior and opportunity benefits, we consider three scenarios.
In our first scenario, FULL, we assume that airlines pass on all costs associated with CO2 allowances, including opportunity costs for free allowances. Airlines pass on
expenses from purchasing allowances but not opportunity costs for free allowances in our second scenario, which we label EXPENSE. In our third scenario, ABSORB, airlines do not pass on any costs associated with CO2 allowances. The three scenarios cover a broad spectrum of airline responses to the EU-ETS. As noted above, we believe the FULL scenario is the most accurate representation of future airline behavior.
To foreshadow our results, the largest rise in airfares and decreases in traffic and CO2 emissions will occur in the FULL scenario. We also expect profits to increase in the full scenario, as airlines receive a large proportion of allowances for free and pass on opportunity costs of these allowances to consumers. Airfares will increase and traffic and CO2 emissions will decrease in the EXPENSE scenario, but by smaller amounts than in the FULL scenario. In the ABSORB scenario, there will be no change in airfares, traffic, or CO2 emissions, and profits will decrease.
2.3 Results
As noted in Section 2, we start from an emissions price of El 5/tCO2 in 2010 and increase the price by 4% each year. Using a PPP exchange rate, the CO2 price, in 2010 dollars, is
$20/tCO2 in 2012 and rises to $27.45/tCO2 by 2020. The price of a gallon of jet fuel in BaU is $2.29 in 2012 and $2.77 in 2020. Our BaU fuel prices are an extrapolation of 2006 (the base year for APMT-E) fuel prices based on long-run forecasts and accounting for the impact of the EU-ETS applied to other sectors. As such, our BaU prices do not necessarily reflect current fuel prices, which can be influenced by business cycles and speculation. When aviation is included in the EU-ETS, the effective price of jet fuel (including CO2 allowance costs) when flying to or from the EU in 2020 is $2.82 per
gallon, 10% higher than in BaU.
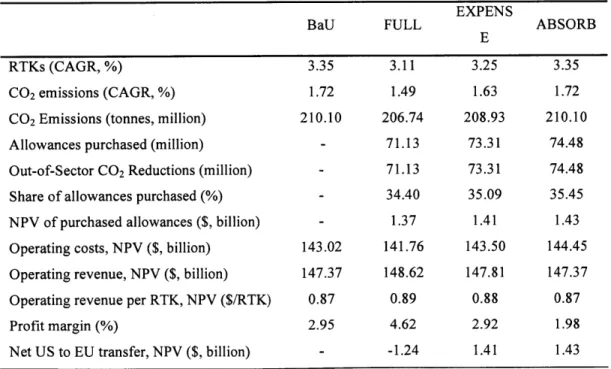
Table 1 presents cumulative modeling results for US carriers on the North Atlantic for the period 2012-2020. We evaluate cumulative traffic changes by calculating the compound annual growth rate (CAGR) for RTKs. In the FULL scenario, demand decreases relative to BaU but RTKs continue to grow. Between 2011 and 2020, RTKs increase by 31.8% in the FULL scenario, compared to 34.5% in BaU. Airfare increases are smaller when airlines only pass on the costs of purchased allowances rather than all costs, so the annual growth rate for RTKs in the EXPENSE scenario exceeds that in the FULL scenario. There are no changes in RTKs in the ABSORB scenario relative to BaU, as airfares are the same in the two scenarios.
Table 1. Cumulative US carrier outcomes on the North Atlantic, 2012-2020.
EXPENS
BaU FULL ABSORB
E
RTKs (CAGR, %) 3.35 3.11 3.25 3.35
CO2 emissions (CAGR, %) 1.72 1.49 1.63 1.72
CO2 Emissions (tonnes, million) 210.10 206.74 208.93 210.10
Allowances purchased (million) - 71.13 73.31 74.48 Out-of-Sector CO2 Reductions (million) - 71.13 73.31 74.48
Share of allowances purchased (%) - 34.40 35.09 35.45
NPV of purchased allowances ($, billion) - 1.37 1.41 1.43 Operating costs, NPV ($, billion) 143.02 141.76 143.50 144.45
Operating revenue, NPV ($, billion) 147.37 148.62 147.81 147.37
Operating revenue per RTK, NPV ($/RTK) 0.87 0.89 0.88 0.87
Profit margin (%) 2.95 4.62 2.92 1.98
Increases in traffic drive increases in CO2 emissions, but emissions increases are smaller
than traffic increases as the fleet becomes more efficient over time. The lowest annual growth in emissions occurs when airlines pass on all costs associated with CO2
allowances. Table 1 also reports cumulative CO2 emissions between 2012 and 2020. Comparing emissions for or policy scenarios to the BaU indicates that 3.35 million tonnes of CO2 are abated in the FULL scenario and 1.17 million tonnes in the EXPENSE scenario. These numbers represent small proportional decreases in emissions relative to BaU - 1.6% in the FULL scenario and 0.6% in the EXPENSE scenario. Annual CO2
emissions from US airlines on the North Atlantic increase from 21.9 million tonnes in 2011 to 25.2 million tonnes in 2020 in the BaU, and to 24.7 million tonnes in the FULL scenario. In the FULL scenario, US airlines purchase approximately 71.13 million emissions allowances. This is estimated to lead to out of sector abatement of 71.13 million tonnes CO2 in the EU between 2012 and 2020, or about one third of total US airline emissions for the North Atlantic routes. All airlines purchase about 840 million emissions allowances which leads to the abatement of about 840 million tonnes CO2 between 2012 and 2020, or approximately 2% of all EU emissions (UNFCC, 2008).
Although emissions abated by aviation differ across scenarios, abatement aggregated across all sectors is constant due to the economy-wide emissions cap. That is, the increase in aviation emissions is facilitated by purchasing allowances from sectors with lower abatement costs. In this connection, our EPPA simulations indicate that EU electricity emissions will be 57% below 2012 emissions in 2020. Between 2012 and 2020, in the FULL scenario, US airlines purchase allowances for about one-third of total allowances required by US airlines. Allowance purchases are largest in the ABSORB scenario, as traffic is largest in this scenario.
Net present values (NPVs) for financial indicators for US operations on the North Atlantic during the period 2012-2020 are presented in the second half of Table 1. Our NPV calculations use a discount rate of 4%, which is similar to the discount rate recommended by the US Office of Management and Budget (2003). As airfares in the ABSORB scenario equal BAU airfares, total operating costs rise by the cost of allowances in this scenario. In the EXPENSE scenario, the increase in airfares reduces traffic and operating costs net of CO2 costs. However, the cost of purchasing CO2
allowances results in a rise in total costs relative to BaU. Total costs decrease in the FULL scenario, as decreases in cost due to reduced traffic exceed the cost of purchasing allowances.
Operating revenues are a function of traffic and air fares. As demand is inelastic, the revenue impact of reduced RTKs is more than offset by an increase in airfares in the FULL scenario, so operating revenues increase. Operating revenue also increases in the EXPENSE scenario. Airfares and traffic in the ABSORB scenario are unchanged relative to BaU, so there is no change in operating revenues. Decreased RTKs and increased revenue result in revenue per RTK increasing in both the FULL and EXPENSE scenarios.
The impact of the policy on profit margins is of key interest to airlines. We calculate average profit margins for the period 2012-2020 by dividing the NPV of operating revenues by the NPV of operating costs. Airlines pass on the cost of purchasing allowances in the EXPENSE scenario, so the profit margin in this scenario is very similar to the profit margin in BaU. However, total profits decrease relative to BaU because the profit margin is earned on a lower volume. In the ABSORB scenario, as airlines incur additional costs that are not passed on, the average profit margin decreases. In the FULL scenario, there is a large increase in the profit margin because, in addition to the cost of purchasing allowances, airlines pass on opportunity costs associated with grandfathered allowances. Windfall gains from grandfathering are worth $2.6 billion in the FULL scenario.
Windfall gains from free allowances represent a transfer from the EU to the US. However, allowances purchased by US airlines from the European Commission and from EU firms represent a transfer from the US to the EU. In the FULL scenario, the NPV of free allowances exceeds the value of purchases resulting in a net transfer from the EU to the US. In the EXPENSE and ABSORB scenarios, there are no windfall gains, which
result in net transfers from the US to the EU. Consistent with the scope of our economic analysis we do not address the distribution of environmental damages associated with the US aviation operations on the North Atlantic, although we anticipate impacts in both the EU and US (in addition to other impacts globally).
To summarize our analysis so far, for all cost pass-through assumptions, traffic
and CO2 emissions continue to increase over time when aviation is included in the
EU-ETS. When some CO2 costs are passed on to consumers, there are small decreases in
emissions relative to BaU. Unlike CO2 emissions, the impact of the EU-ETS on airline
profitability varies widely for alternative cost pass-through assumptions. If there is full cost pass-through, which we believe is the most likely case, US airlines will experience a
windfall gain of $2.6 billion over the period 2012-2020 from the granting of free
allowances. On the other hand, if airlines are only able to pass on the costs of allowances purchased or are unable to pass on any costs, US airline profits will decrease.
Our analysis has focused on the operations of US airlines on the North Atlantic, which accounts for about 12% of total operations for US airlines measured in RTKs. To gauge the overall impact of the EU-ETS on US aviation, we report selected metrics for total US operations in Table 2. The results indicate that the EU-ETS will have a very small impact on aggregate RTKs and CO2 emissions. In the FULL scenario, which
generates the largest decrease in emissions, total US airline CO2 emissions fall by only 0.19% relative to BaU. Similarly, for all scenarios, there are small changes in operating
revenues, operating costs and profit margins relative to BaU. These results indicate that the EU-ETS will have a relatively small impact on the overall operations of US airlines.
Table 2. Cumulative US carrier outcomes on all routes, 2012-2020.
BaU FULL EXPENSE ABSORB
RTKs CAGR (%) 3.65 3.62 3.63 3.65
CO2 Emissions (tonne, million) 2,139 2,136 2,138 2,139
Operating costs, NPV ($, billion) 1,589 1,588 1,590 1,591
Operating revenue, NPV ($, billion) 1,637 1,639 1,638 1,637
Profit margin (%) 2.92 3.07 2.92 2.83
2.4 Welfare Analysis
Policies such as the EU-ETS aim to reduce future damages from global warming. Benefits from avoided climate damages will not be limited to aviation, but will occur across the global economy. Additionally, the impact of the EU-ETS will depend on policies in other nations. Ellerman and Buchner (2007 and 2008) discuss the effectiveness of the EU-ETS in mitigating climate change, but a similar analysis is
beyond the scope of our study. Instead, we evaluate the cost of including aviation in the EU-ETS within the aviation sector and investigate the distribution of costs across airlines and consumers. Our welfare calculations only concern aviation operations on the North Atlantic.
We use producer surplus, measured by operating profits, to calculate costs to airlines and consumer surplus to evaluate costs to consumers. Aviation consumers include travelers, consignors and freight recipients. We assume a linear demand curve to calculate changes in consumer surplus. For each year and scenario, the change in consumer surplus, ACS, is given by:
ACS = }(go + qi)x(po - p1) 2.1
where qo and q, are North Atlantic air traffic (measured in RTKs) in, respectively, BaU and the policy scenario; and po and p, are airfares in BaU and the policy scenario respectively.
We summarize annual changes in producer surplus and consumer surplus by calculating NPVs for each measure aggregated over the period 2012-2020, again using a discount rate of 4%. Although it would be informative to calculate welfare changes specifically for US producers and consumers, our modeling framework does do not track consumers by country of origin. Additionally, although there are estimates of future US passengers on the North Atlantic, there is little guidance on how to measure consumer benefits from freight. Instead, we calculate consumer surplus changes for all consumers on the North Atlantic. To facilitate comparison of producer surplus changes with consumer surplus changes, we also calculate producer surplus for all North Atlantic carriers.
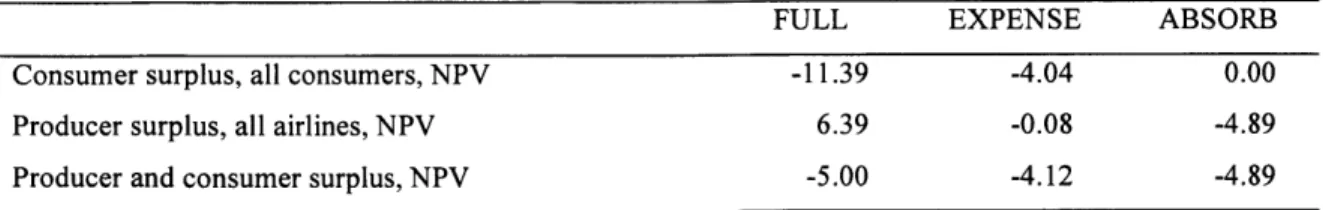
Table 3. Cumulative consumer and producer surplus changes relative to BaU ($, billion), 2012-2020.
FULL EXPENSE ABSORB
Consumer surplus, all consumers, NPV -11.39 -4.04 0.00
Producer surplus, all airlines, NPV 6.39 -0.08 -4.89
Table 3 presents NPV consumer and producer surplus changes relative to BaU for the 2012-2020 period. In the FULL scenario, consumer surplus decreases, due to higher fares and less traffic. Producer surplus increases in this scenario, as windfall gains more than offset the impact of reduced traffic. There is a smaller decrease in consumer surplus in the EXPENSE scenario, as airfare increases are smaller in this scenario than in the FULL scenario. There is little change in Producer Surplus in the EXPENSE scenario, as airlines pass on the costs of purchasing permits and there are no windfall gains. In the ABSORB scenario, there is no change in consumer outcomes and producer surplus decreases.
The sum of changes in consumer and producer surplus is negative in all scenarios. This result is not surprising, as the EU-ETS imposes additional costs on airlines and we do not consider benefits from emissions abatement or revenue from purchased allowances. However, as noted above, the inclusion of aviation in the EU-ETS is expected to reduce EU emissions by about 840 million tonnes CO2. The change in social
surplus differs across scenarios, but the numbers do not indicate that a particular cost pass-through behavior is preferable, as we do not consider interactions with other sectors. For example, greater demand for allowances in the ABSORB scenario relative to other scenarios, will increase the price of allowances and decrease consumer surplus in other sectors.
2.5 Sensitivity analysis
A key finding in our analysis is that the EU-ETS will have a relatively small impact on aviation emissions. This result is driven by high marginal abatement costs in aviation relative to other sectors and is consistent with findings from other studies (e.g., Winchester et al., 2011). Consequently, we do not investigate the sensitivity of this result to our modeling assumptions. Our finding that the EU-ETS may increase profits for US airlines is potentially more controversial. Influential drivers of this result, which we consider in sensitivity analyses, include future demand for air services on the North Atlantic, and the number of allowances grandfathered. We also examine the sensitivity of our results to the annual increase in the fuel efficiency of new aircraft, and the market share of US airlines in total European operations. The EU-ETS has little impact on profits in the EXPENSE scenario, so our analysis focuses on the FULL and ABSORB scenarios.
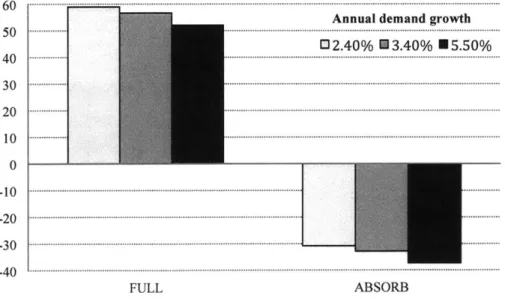
Our BaU demand forecasts are derived from US-ICAO/GIACC estimates. Faster or slower underlying demand growth will influence the quantity of allowances required by aviation and ultimately airline profitability. Demand for air services on the North Atlantic grew by 3.4% per year in the core scenarios. In separate sensitivity analyses, we consider demand growth rates of 2.4% and 5.5% in both BaU and our policy scenarios.
Figure 1 displays proportional changes in average 2012-2020 profit margins relative to BaU for the core demand growth scenario and for low and high demand growth alternatives. In high-growth scenarios, airlines need to purchase more allowances than in our base case and fewer in low-growth scenarios. In the FULL scenario with high growth, the relative contribution of (fixed) windfall gains decreases, so the increase in profit margin is lower than in the core FULL scenario. The opposite is true in the FULL scenario with low growth. In the ABSORB scenario, airlines also have to purchase more allowances if there is higher demand growth. Consequently, the average profit margin in the high growth scenario decreases by a larger amount than in the corresponding core
scenario.
60. -. -
.-.-.-Annual demand growth 50 -02.40% E3.40% 05.50% 40 - -30 -- 20-0 -10 -20 ---30- ---40 FULL ABSORB
Figure 1. Changes in 20 12-2020 average profit margins relative to BaU for alternative demand forecasts,
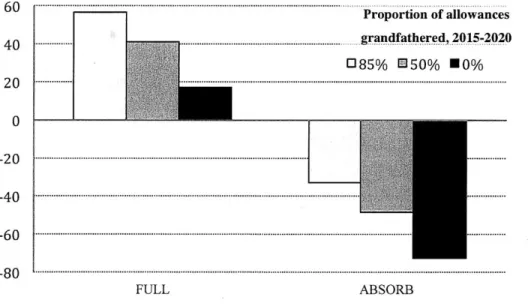
Regarding allowance allocations, we followed current legislation in our core scenarios and assumed that allowances for 85% of 2010 emissions will be grandfathered each year from 2012 to 2020. However, EU regulations provide scope for changes to allocation
rules from 2015 onwards and the European Commission has reduced the number of allowances grandfathered to other sectors following introductory periods. Consequently, we consider cases where, beginning in 2015, (a) 50% of aviation benchmark allowances are grandfathered, and (b) aviation receives no free allowances.
Changes in average profit margins for alternative allowance allocation assumptions and our base case, which assumes that 85% of allowances are grandfathered each year after 2015, are displayed in Figure 2. Airlines have to purchase more allowances when fewer allowances are grandfathered, which reduces profit margins in all scenarios. The largest decrease in profits is in the ABSORB scenario, but the average profit margin is still positive. However, 2012-2020 average profit margins mask important annual variations. In the ABSORB scenario, profit margins decrease to 1.03% by 2020 when 50% of allowances are grandfathered, and are negative (-0.06%) in 2020 when all allowances are auctioned. Profits are always positive in the FULL scenario as grandfathering fewer allowances only erodes windfall gains.
Proportion of allowances
40 .grandfathered, 2015-2020
0385% M50% M0%
0
FULL ABSORB
Figure 2. Changes in 20 12-2020 average profit margins relative to BaU for alternative allowance allocations, %.
Decreasing the proportion of allowances grandfathered also has a large impact on net transfers from the US to the EU. When all post-2015 allowances are auctioned, net US to EU transfers between 2012 and 2020 are $2.21 billion in the FULL scenario (compared to -1.24 billion when 85% of allowances are grandfathered). The
corresponding value in the ABSORB scenario is $3.15 billion (compared to 1.43 billon when 85% of allowances are auctioned).
In another analysis, we examine the sensitivity of our results to the annual improvement in fuel efficiency for new aircraft. In our core scenarios, guided by Lee et al. (2001), we assumed a 1.4% annual improvement in fuel efficiency. We now consider a 1% annual increase in fuel efficiency, as used by US-ICAO/GIACC (2009). When fuel efficiency is lower, airlines have to acquire more CO2 allowances per flight. Traffic is
largest in the ABSORB scenario, so lowering fuel efficiency has the largest impact in this scenario. However, the value of permits purchased between 2012 and 2020 in the ABSORB scenario with lower fuel efficiency is only 2.3% higher than in our core ABSORB scenario. Consequently, a lower increase in fuel efficiency also has a minor impact on profit margins. For example, in the ABSORB scenario, the profit margin for US airlines is 1.97% when the annual increase in fuel efficiency is 1%, compared to
1.98% in our core analysis.
As mentioned above, the share of allowances grandfathered will be based on 2010 market shares in total traffic to, from and within EU-ETS countries. Official market share data had not been released by the European Commission at the time of writing. The 2010 market share of US airlines in total EU-ETS operations derived from APMT-E was 9%, and an estimate from an external data source was 10.2%. To investigate the impact of a higher market share for US airlines on our results, we consider a market share of 11% in
a sensitivity analysis.
Increasing the market share of US carriers increases emissions from US airlines in the BaU and the policy scenarios, but has no impact on profit margins in our policy scenarios relative to BaU. This is because the number of free allowances increases with market share-driven increases in emissions. On the other hand, increasing total market share of US airlines has a large impact on international transfers. In the FULL scenario, the 2012-2020 NPV of transfers from the EU to the US is $1.5 billion when the US market share is 11%, 20% higher than when the market share is 9%. The increase in the EU-to-US transfer is driven by larger windfall gains to US airlines. In the ABSORB scenario, US airlines have to purchase more allowances when they have a higher market