Publisher’s version / Version de l'éditeur: Building Practice Note, 1982-03-01
READ THESE TERMS AND CONDITIONS CAREFULLY BEFORE USING THIS WEBSITE.
https://nrc-publications.canada.ca/eng/copyright
Vous avez des questions? Nous pouvons vous aider. Pour communiquer directement avec un auteur, consultez la
première page de la revue dans laquelle son article a été publié afin de trouver ses coordonnées. Si vous n’arrivez pas à les repérer, communiquez avec nous à [email protected].
Questions? Contact the NRC Publications Archive team at
[email protected]. If you wish to email the authors directly, please see the first page of the publication for their contact information.
NRC Publications Archive
Archives des publications du CNRC
For the publisher’s version, please access the DOI link below./ Pour consulter la version de l’éditeur, utilisez le lien DOI ci-dessous.
https://doi.org/10.4224/20337944
Access and use of this website and the material on it are subject to the Terms and Conditions set forth at
Estimating temperature gradients and dew point temperatures for
building envelopes
Scheuneman, E. C.
https://publications-cnrc.canada.ca/fra/droits
L’accès à ce site Web et l’utilisation de son contenu sont assujettis aux conditions présentées dans le site LISEZ CES CONDITIONS ATTENTIVEMENT AVANT D’UTILISER CE SITE WEB.
NRC Publications Record / Notice d'Archives des publications de CNRC: https://nrc-publications.canada.ca/eng/view/object/?id=2aa64730-07e9-40de-8bf1-a9c6f995bf61 https://publications-cnrc.canada.ca/fra/voir/objet/?id=2aa64730-07e9-40de-8bf1-a9c6f995bf61
ESTIMATING TFNPEBATURE
GRADIENTS
ANDDEW
POINTTEMPERATURES
FOR BUILDING M E L O P E S
Division
of Building
Research, National
R ~ S ~ T C ~
Council of
Canada
ESTIMATING TEMPERATURE GMDIEMTS AND DEW PQINT TEMPERATURES FOB
BUILDING
ENVELOPESE.C. Scheuneman
It is useful and often essantfal t o h o w the temperature a d moisture conditions that exist throughout buildlng assemblies and
components. Such temperature and mofsture information may be utilized when d e s i g d u g a
.new
building, investigating problemsin
an existingbuilding, and planning t o retrofit a building. The temperature gradient and smkr/winter temperature extremes are of
ten
useful data tod e t e d n e the materials t o be used in a building envelope (exterior
s h e l l ) . A knawledge of air-mo$~ture/temperature conditions and
relationships I s essential in locating the vapour barrier d t h respect
to other components in the building assembly.
The following sections give simplified versions of temperature and dew point calmlations that are generally useful for a variety of
purposes. Results
from
these calculations p l i l l be on the conservative s i d e , that is, they may indicate a problem whereas a more accurate analysis would show no problem. For such borderline cases or for c o q l i c a t e d and c r i t i c a l problem, it m y be necessary t o do a more precise analysia or consult a specialist in thermal analysis.TEMPERATURE Gl?ADmm
During c o l d weather the temperature at the interior surface of the building envelope, except for w i n d m s , will be close to t h e room
temperature. Moving outward through t h wall
or
ceiling the temperaturebecomes increasingly colder u n t i l 1 t reaches the outdoor tersgerature j u s t beyond the exterior fFnish. It: is poesXble to calculate and chart these tenperature changes through the various building caponents; this is
known
as the temperature profile or gradient. During warm or hotweather the outdoor temperature may be greater than the indoor temperature, h t the same general rules and procedures apply.
( 5 ) Temperature Change for Components
Before performing such calculations,
we
need t o examine b r i e f l yt h e basic relationshfp between thermal resistance of the building components and temperature drop {change) through each component.
The information in t h i s Note is based on reports given by DBR personnel
If we assttme that heat flows through each component under steady-
s t a t e parallel heat f l o w conditions,
then
the follawing f o r m l a can be uaed t o calculate the temperature change across each component.where
AT =
temperature change across a component R = thereal resistance o f the caqonent%
= total thermal resistance of a l l cornpadentsATT = total temperature change from interior to exterior
This assumption of steady-state condition means that the calculation w f l f be subject to errors, especially for rapidly changing outside a i r
temperatures. Nonetheless, i t provides useful information.
The forms, Ffgures 1
and
2, have been designed to a s s i s t with t h ecalculation
and
visualization of the temperature p r o f i l e through the building assembly. Figure 1 is for vertfeal assemblies (such as walls); Figure 2 is for horizontal assemblies (suchas
ceilings or roofs),(These £ o m may be reproduced t o carry out your awn s t u d i e s , ) The general procedure
i a
t o list the b u i l d i n g components in the table (left side) and draw lines representing their thickness on the graph (right slde) after choosinga
s u i t a b l e scale. The t h e m 1 resistance values(Bus) are found from Appendix A and used with the known interior and exterior teqexatures t o calculate the values (R, R/%, AT,T) t o
complete the cable. The temperatures are then plotted an the graph to give a p i c t o r i p l repreeedtation of the calculations. Note that. the Winter AT and T columns
are
uaed when the Exterior T is less than theInterior T; the S m r
AT
and T columne are used when t h e ExteriorT
is greater than the InteriorT.
TEM P E R A T U
RE
G
R A
I)
I
E N T
T A B L E
COMPONENT
G R A P H NAMEDATE
ADDRESSASSEMBLY
FIGURE 2H O R I Z O N T A L A S S E M B L Y
TEMPERATURE,OC
We w i l l now use the simple e q l e shown in Figure 3 to follow thtough the step-by-step procedure, The results are
shown
In F i g u r e 4.Determine the temperature gradient for the i l l u s t r a t e d wall assembly
(Fig. 3) with an interior temperature of 2 0 . 0 ° ~ and an exterior temperature of -15.U°C.
13 mrn G Y P S mrn M E T A L S I D I N G mm P L Y W O O D
Figure 3,
A
W a l l AssemblyStew 1
List the components in appropriate sequence in t h e table (Figure 4).
Step 2
Using a ruler or other straight-edge, draw the assembly on the
graph a f t e r choosing a s u i t a b l e scale. Designate the coupanents by
number. Step 3
Using t h e appropriate data from Appendix A, f i l l in the lt column in the t-kble.
S t e p 4
Add up a l l the R's t o give
%
( 2 . 5 5 ) and enter in the TOTAL r o w atbottom of t h e R column. Step 5
Calculate t h e ratio K/RT for each component. Total up the ratios
in this column and enter them in the TOTAL row at bottom of the R/% column. Note that t h i s total should always be very c l o s e or equal to
1.00; if not, recheck your c a l c u l a t i o n s for t h i s column.
S t e p 6
Write the i n t e r i o r ( 2 0 , 0 ° ~ ) and exterior ( - 1 5 . 0 " ~ ) temperatures in she appropriate p l a c e s under the Winter
T
column (or under the Summer T column if appropriate).S t e p 7
Calculate
ATT
by subtracting the Exterior T from the Interior T.Enter t h i s figure 135.0) in the TOTAL row at bottom of he AT column. (If the Exterior T is greater than the Interior T, subtract the Interior
T from t h e Exterior T . ) Step 8
Calculate AT for each component by m u l t i p l y i n g each R / K ~ times
ATT
(equation 1) and enter the figures. Note that the total of these A T ' Sshould equal, or be very close ta, ATT. Lf not, recheck the calculations.
S t e p 9
F i l l in the Winter T column by adding the first component No. 1,
AT (0.4) to t h e T in the row above (Exterior T of -15.0) and p l a c i n g t h i s new T ( - 1 4 . 6 ) i n t h e row below component No. 1. Continue t h i s sequence of adding each AT to t h e T above and entering the new T i n t h e r w below. (When Exterior T is greater than Interior
T,
each AT is subtracted from the T in the row above.)As
a check, the f i n a lcoqonent A T added to the preceding T (1.8
+
18.4 = 20.2) s h o u l d yield the Interior T (20.0) or be very close.By glancing down t h e T column in the completed table, one sees the
temperatures on each s i d e (interface) of each component.
On the graph, mark the temperatures ( T ' s ) at each coqonenr edge
( i n t e r f a c e ) , and then draw s t r a i g h t lf nes joining e a c h p o i n t to t h e next. This completes both the arithmetic and graphic representations of t h e temperature or thermal gradient.
( i f ) Temperature at a S p e c i f i c P o i n t and Location of a Certain Temperature
We
may want t o knowthe
temperature at a specific point in the assembly (besides the fnterfaces), or where in the assembly a certaintemperature w i l l occur. Et is possible t o deternine these temperatures or points
by
using either the table or graph.Suppose we wish to know
(1)
the temperature in the fibreglass batt 35 m from its cold s i d e and (2) where in the assembly the temperature w i l l be 5*.(a) Graphical Method
'Phis is the easiest and quickest method. Use a straight-dge
r u n d a g vertically t o l i n e up with 35 mm from the cold side of the batt (73 mm from interior) and note the point of interaeckion with the
teqerature gradient line. This gives a value of about -lo. See vertical dashed line on Figure 4.
Use a straight-edge ruaaing horfzwtally t o line up with 5' and note the point of intersection with the temperature gradient l i n e . This gives a value of about 41 nua into the batr
from
the warm s i d e ( 5 4 ram from interior). (See dashed horizontal l i n e on F i g u r e4.)
(b) Arithmetic Method
This method may be preferred by many as it gives more exact values
than the graphical me tho& h e f ollawf ng
f
0-1 a y i e l d s the temperature ata
s p e c i f i c point:where
T
= temperature at the specific po%ntTw
= teqerature at w a r m interface of conpoaent conLaining the specffic pointL
= distance of specific p o l n t f ram warm side of component LT
= total thickness of componentA = temperature change across component
The following f o r m l a w i l l yield the location of a certain
temperature:
where
L
= location of certain temperature from warm side of component Ifw = temperature at: warm interface of eomp~aent containing thespecific temperature
T
= temperature at the specific pointAT
= temperature change across component$
= total thickness of coqonentFor this e-ple dealfng with component No.
4,
we havewhich yields
The above two results are t h e same as those obtafned graphically (Figure 4 ) .
Note: The temperature gradient calculations for the Table qnd the
k i t h t i c Method are s h m w i t h a precis1 on of 1 or 2 decimal places; thig is done to maintain the relatfonship between the
d i f f e r e n t Rts, R / R ~ ~ s , AT'S and T's, It is m a t h a t i c a l l y convenient with electrouic calculators t o use t h i s degree of precision. The final results of calculaeions are rounded to the nearest whole unft of degrees C e l s i u s (OC) or m f l l t ~ t r e s (mm).
As previously mentioned, the temperature gradient
calculations assume steady-state conditioa~ which means that the rasulte are usually leas accurate than the nearest whole u n i t . However, the calculated values are generally close enough to be
useful, e s p e c i a l l y when looking at extreme or worst-case
situations.
Further explanation and examples can be found
in
references 1, 2a, and 3.(iii) Extreme Temperatures at Outer Surfaces
Qulte often the temperature of the outer surface of a b u t l d i n g assembly can be significantly higher or lower than the outside air
temp eratare. Higher temperatures result from absorption of solar (short-wave) radiation by the surface. Lower temperatures result from the surface g i v i n g o f f infrared (long-wave) radiation t o a clear n i g h t
sky or to o t h e r b o d i e s .
The following formulae have been developed to account for these
two effects on roof assemblies ( 4 , 5 ) . The references use degrees Fahrenheit (OF); this paper uses the formulae in degrees Celsius
(*C)-
They may also be used for walls that are exposed to the sky. Shaded walls would use the outdoor temperature as the e x t e r i o r surfaceterrrperature.
(a) High Heat Capacity Substrate
(such as concrete under the surface material)
HIGH DAY-TIME TEMPERATURE
TS =
TA
+
42a (sunny conditions)TS = TA
+
55a (sunny conditions p l u s reflected sunshinefrom other surf aces) LOW NIGHT-TIME TEMPEUTURE
TS =
TA
- 5 (clear night sky) (b) Low Heat Capacity Substrate(such as insulation under the surf ace mater-lal)
HIGH DAY-TIME TEMPEMTURE
TS =
TA
+
55a (sunny conditions)TS = TA
+
72a (sunny c o n d i t i o n s p l u s reflected sunshinefrom other s u r f a c e s )
LOW MZGHT-TIME TFXPERATURE
(clear night sky)
The deftnitions far the symbols are as follows: TS= temperature of surface ( O C )
TA = temperature of air (OC)
a = solar absorption coefficient (no units)
Appendix B gives a t a b l e of solar absorption coefficients for d i f f e r e n t
materzals. The value can be hfghly variable if the s u r f a c e
deteriorates, accumulates d i r t , or i s covered with water.
These extreme temperatures and temperature g r a d i e n t s s h o u l d b e u t i l i z e d when choosing materials requfred to withstand extreme
Example 2
A f l a t roof assembly built of a 100 m concrete deck (high density) with 25 mm extruded polystyrene on t o p covered w i t h built-up raaflng covered with grey gravel. Determine the extreme temperature gradients for this roof that receives no reflected sunshine for a summer high air temperature of 35% and a d n t e r low air temperature of -30°C. The following temperatures are u t i l i z e d :
-
interior T = 20°C-
winter minimum TA = -30°CReace, mintmum surface temperature T = TA
-
10 givingTS = -30°
-
lo0
= -40°CHence, maximum surface temperature
TS
= T A + 55awhere a = 0.75 {from Appendix
B)
givingSince the max5mm and mfnimum temperatures occur on the surface material rather than i n the
air,
the external air f i l m is omitted from theR,
R/RT andAT
calculations. A t a b l e is completed and the graph is drawnaccording
to the procedure described previously. The results are shown in Figure 5.For comparison, the procedure has been carried out in Figure 6 with no surface temperature effects ( s o l i d line)
and
the graphical results f r o mFigure 5 added (dashed lines). There is
a much
larger difference between the t w o maximum temperature gradients than between the twom i n i m temperature gradients. This illustrates that the heating effect
of solar radiation is nuch larger than the cooling efEecr produced by long-wave radiation, as shorn also by the temperature equations. For
further explanation
and
exaqles see ref erencea 1, 2a, 3, 4 , and 5.8 . DEW POINT TEIfFEBATURES
Relative humidity Ls the percentage ratio of the actual mount of water vapour h e l d in the air compared t o the maxtmrm I t could hold a t a given temperature. Far example, a relative humidity
CR.H.)
of 50% meansthat the air is carrying o n e h a l f the total amount of water vapmr it is capable of holding at that temperature. Air with 100% R.H. has reached i t s saturation point; the water vapour I t holds will begin t o condense if the temperature drops or moxe moisture is added. The water vapour
wfll
condense as l i q u i d if T is greater than O°C or as ice crystals ifT
is
lese than O°C. The temperature a t which condensation takes p l a c e is called the "dew point" temperature.Understanding the dew p o i n t and the moiature capacity of air is c r u c i a l to understanding condensation/moie ture problem f n bu i l d i n g a . When the temperature af air decreases, the m a d m u m amount of water vapour that the a i r can carry is reduced. For example, if air at 2 1 * C and 50% R.H. is cooled t o 1l0C, the RtR, w i l l reach 100% (the dew p o i n t ) . If the tenperature is lowered further, water w i l l condense out
of the a i r to maintan the R.H, at 100%. hferences 2b, 6 and 7 give further explanation and d e t a i l .
A
psychrometric chart (Figure 7) shaws the relationship between the relative humidity (R,E.) and temperature of air.me
curvedlines
beginning on the r i g h t v e r t i c a l scsle i n d i c a t e the, variation o f the r e l a t i v e humidity ( X ) . The straight l i n e s running verticallyfram
the bottom borlzoatalscale
to the saturation curve give the air temperature ( "C)(f) Finding the Dew Point Temperature
Par a Laom value of air temperature and relative humidity (R.H.]
one can use the psychromtric chart to f i n d the dew p o i n t temperature. The procedure is as folluws:
Step 1
Determine the air temperature inside the house by using a
thermonreter (or an assumed value),
Step 2
D e t e d n e the relative humtdfty i n s i d e the house using a sling psychrometer or a hygrometer (ar an assumed value). The R.R. values
recorded by hygrometers may be in error by as rsuch as
20%
so a c a l l b r a t e d instmnment should be used.S t e p 3
On
the psychrometric chart, locate the interior air temperature of the house an the horizontal (bottom) scale and mark the p o i n t where the vertical projection from t h i s temperature intersects the curve which represents the B.H. of the house air.Starting at the intersection p o i n t , run a straight-edge parallel to the bottom OC scale and left to cross the curved lOOX R.H. line. The crossing point gives the dew point temperature.
Example 3
Three examples are s h m in Fl.gure 8:
3(a) The house interror a i r temperature is 2S°C and the R.B. is
60%. The dew point teqerature at: which water v a p w r w i l l
condense as l i q u i d for this situation is 16.5OC.
Water vapour w i l l condense out as l i q u i d at 10.5V
3(c) T = 17%
R.H. = 25%
Water vapour will condense o u t as ice a t the dew point
temperature of -3*C.
Cii) Finding the New B.H. After a Temperature Change
As previously noted, the capacity of a i r t o hold water vapour 3 s
different fur different temperatures. The hfgher the
air
temperature, the greater the amount of water vapour that can be held.The procedure to f i n d the new R.H. after a temperature change is
as follows:
S t e p 1
Locate the point on the psychrametric chart that corresponds to the o r i g i n a l teuperature and relative humidity.
Step 2
U s i n g a straight-edge, p r o j e c t a horfeontal l i n e to the new
temperature. The point of intersection with the curved
R,H.
line gives Lhe new relative humidity.Example 4
Three examples are shown in Figure 9 :
4(a)
?he householda i r
is at; 20°C and 40%R.H.
What is the newR.E1. when the a i r Is cooled to 10°C? (R.H. becomes 75%,) 4(b)
T
= 2 S 0 CR.H. = 80%
What is the R.B. when t h i s
warm,
humid air cools t o 20'C? (R.H. becomes 100% and same water condenses to maintain the R.H. at 100%-)4(e)
T
= -15'C R.H. = 95%:What is the R.H. when t h h c o a l outside air is brought into
the house and warmed to 20"C? {R.B* becomes 8X which is very d q .
1
LOCATION OF DEW
POINT
TEMPERATURES FOR BUILDING ASSEMBLIES Three examples are g l m n t o i l l u s e r a c e the combined use of temperature gradients with the psycbrome.tric chart to locate the dewA double-glazed window has temperature gradients as shown in
F i g u r e 10. When t h e house T = 22°C and
R.H.
= 5 0 X , will water vapour condense on the inside glass when the outside T a -22"C?Ue calculate the values to complete the t a b l e and draw the
temperature profile. Referring to the psgchroretric chart ( F i g . 7 ) , we
f i n d that air at 22%
and
50X R.H. has its dew point at l l . S ° C . Either rhe t a b l e or gradient shows that the inside glass tenperature is 6.6"C.As the glass l a colder than the dew point, water vapour will condense as
l i q u i d on the wf n d w .
Since the i n s i d e glass of a window is usually the coldest surface in a room, it determines the m a d u u m R.H. that can be maintained without condensation. U s i n g t r i p l e glazing raises the inside glass temperature and, thus, the maintained R,H.
T E M P E R A T U R E G R A D I E N T
T A B L E
dNAME
DATE
ADDRESSASSEMBLY
GRAPHFIGURE 10.
E X A M P L E 5
Example 6
We have a partly-insulated wall as s h m fn Figure: 11. Where
will
water vapour condense in the wall assembly if there is no vapourbarrier? The conditions are as follows: Interior T = 18OC
Exterior T = -35OC inside R.H. = 30%
The table and profile are calculated and drawn, The psychrometric
thart reveals that the dew point temperature is 0°C- (1) Graphical Method
We can see at a glance that: O°C lies within the rack wool insulation. By drawing a horizontal line from the O 0 point on the teqerature scale, we find that 0' occure at about 22
mm
from theInterior s i d e of t h e batt (35 mm f r o m interior surface), Arithmetic Hethcd
using $pu.ation (33,
Results from both ti) and (ii) agree.
Note: This discussion applies when the temperature og the
-
iasulation has reached
or is
colder than the dew point temperature.Uuder steady-stalte conditions the water vapour would
continue to d i f f u s e through those tnsulatLons that have little resistance t o moisture flow; the water vapour would condense on the next colder interface such as the exterior sheathing which has a
much
larger resistance. However, the water vapour can condense i n the i n ~ u l a t i o n under norrsteady-state conditions which u s u a l l y occur more than 80X ~f each day. When theinsulation or other materiah in the assembly have a high resistance to moisture flow Cdlffusion), a vapour pressure
gradient s h w l d be drawn (see R e f erenee 71.
When
water
vapour is transported into a building assembly bywarm a i r f l o w rather than vapour diffusion, condensatton can occur within the insulation unless the velocity of the aZr flow ia high enough t o warm up the insulation and carry the vapaur
T E M P E R A T U R E G R A D
1
E N T
T A B L E
I
COMPONENT
I
I
I
SUMMER
I
WINTER
I
G R A P H
NAME
DATE
ADDRESS
ASSEMBLY
A c e i l h g is going to be reinsulated with
new
152 mm f r i c t i o n fftf i k r g l a s s batts over the origxual
63
mm rock wool batts. Canwe
place a 0.15mm
poLyethyleue vapvur barrier over the original insulationbefore adding the new i~aulation?
Lf
the dew point temperature w i l l occur on the colder s i d e of the vapour barrier, then we may use the polyethylene.The c o d i tioas are as follaws: inside T = 20%
attic
T
= -30aCinside
R.H.
= 30XThe table and temperature profile are completed as in Pigtrre 12.
Using the psychrometric chart w e find that condensation should occur at about 2°C. h o k i n g at the table and p r o f i l e we see that the vapour barrier temperature is 4°C. Since this 2s alightly higher than the dew p o i n t temperature, no condensation should occur under these condirions as the vapwr barrier w i l l prevent water vapour from reaching the dew p o i n t temperature which is located within the new insulation.
It should be noted that changing conditions can alter the s i t u a t i o n .
(i) If the R.H. of the house rises t o 3 5 % , the dew poFnt teuperature rises to 4OC. Water vapour can condense at the vapoux barrier (if vapour can pass through the c e i l i n g ) and then d r t p or d i f f u s e back d w n to the ceiling.
Iii) If the a t t i c temperature drops to -35°C instead of -30°C, then the vapour barrier temperature becomes 2.4' which is close to t h e dew point temperature,
When the vapour barrier temperature fs below the dew polnt temperature as a result of very cold weather a x high indoor R.H., there may nat be a condensation problem if t h i s situation occurs for only a few days each heating season s i n c e the building assembly can hold
certain
quantities ofmoisture with no
resultantproblem- This analysis assumes that the vapour barrier is camplete and that there are no air leakage paths through the polyethylene vapatr barrier.
T E M P E R A T U R E
G R A D I E N T
T A B L E
COMPONENT SUMMER
WINTER
R R/RT *
A T I
T
A T I
r
NAME
DATE
ADDRESSASSEMBLY
G R A P HT E M P E R A T U R E ,
OCFIGURE
1 2 ,
E X A M P L E
7
The following references . e v e more detailed and technical
explanat I o n of the concepts discussed in this paper,
( 1 ) LatEa, J.K. and Garden, G.K., Temperature Gradients Through
Building Envelapea, Matima1 Research Council of Canada, D i v i s i o n of Build- Research, CXD 36, 1962 (corrected 1968).
(2) Latta, J8K-b Walls, Windows and Roofs for the Canadfan Climate,
National Research Council of Canada, Divlsion of Building Research, Special Technical Publication No. 1, 1973.
NRCC 13487.
(3) Baker, M.C., Roofs: Design, Application a d Maintenance,
National Research Council of Canada, (Multiscience Publications Limited,
Montreal),
1980,
Chapter 5 .( 4 ) Stephenson, D.G., Extreme Temperaturea at the Outer Surfaces of Buildings, Nat ianal Research Council of Canada, M v i s i o n o f Building Research, CBD
47,
1963.(5) Garden,
G.K.,
Thermal Considerations in Rsnf Design, National Research Council of Canada, Divfsion of Building Research, CBD 70, 1965.( 6 ) Hutcheon, N.B., Humidity id Canadian Buildings, National
Research Council of Canada, Divf sion of Buildt ng Research,
CBD
1 ,1960 (corrected 2968).
(7) Lettta, J.K. and Beach, R.K., Vapour Diffusion and Condensation,
N a t i o n a l Research Council of Canada, Division of Building
THERMAL
RESISTANCE
OF SQPEE COMMON BUILDING MATERIALS* Thermal Resistance B u i l d i n g Material or Component S o l .-
a/-
For Imperial W i n . Fo r Thickness Thickness L i s t e d L i s t e d Insulation Fibreglass Batt Eeockwool Batt Fibreglass Loose F i l l ( B l m - I n ) Fibreglass Loose Fill (Poured)Rockwool Loose Fill (Blown-In)
Rodcwol Loose F i l l (Poured) Cellulose Pibre (Blown) Cellulose Fibre (Poured)
Expanded Mica
(Vermiculite, Zonollte, etc.)
Polystyrene Loose Pill
Expanded PoIystyrene { U g t d ) Extruded Polystyrene (figid] Polyurethane (Rigid)
Polyurethane ( F o a i ~ d i n Place)
Fibreglass Sheathing
Urea Formaldehyde (Foamed in Place, After Curiug)
Wood Fibre
Wood Shavings Cork
Glass F i b r e Roof Hoard
Mineral Aggregate Board Coupressed Straw Board Fibrebaard
Structural Haterials
Saf m o d Lumber (except Cedar) Cedar Logs and Lumber
Concrete 2400 kg/m3 (150 l b / f t 3 ) Concrete 176U k g l m 3 (1 10 l b / f t3)
Concrete 480 kg/m3 (30 l b / f t 3 1
* H E E n Scheuneman, S .
Moff a t t and M. Adelaat, Canadian General Standards Board. CGSB 51-GP-42MP, Ottawa, July 1980.
THERMAL RESISTANCE OF SOME COMMON BUILDING MATERIALS (Cont'd) Thermal Res 1 stance
Building Material or Component S.I. R/mm For I m p e r i a l Rlin. Po r Thickness Listed Thickness L i s t e d Structural Materials ( C o n t ' d )
Concrete Block (3 Oval Core) Sand and Gravel Aggregate
100 mm (4") 200 mm ( 8 " ) 300 mm (12") Cinder Aggregate
loo
mm ( 4 " ) 200 m (8") 300 mm (12") Lightweight Aggregate 100 mm ( 4 " ) 200 TJIIO ( 8 " ) 300 mm ( 1 2 " )Conrmon Brick, Clay, 100 nrm ( 4 " )
Common Brick, Concrete, 100 mm ( 4 " )
Stone ( L i m e or Sand)
S t e e l
Aluminum
Glass (No Air F i l n r s ) 3
-
6 mm(1/8"
-
1 / 4 " )Air
-
Enclosed Air Space (Non-Reflective) Heat F l o w Up, 25
-
100 mm(1'. - 4 " ) ---
Heat Flow Down, 25
-
100 mm(1"
-
4 " )--
Heat Flow Horizontal,25 - 100 mm (1" - 4 " )
--
6.17---
Air Surface F i l m sOutside Air Film (Pioving A i r ) -- 0.03
---
I n s i d e M r Film (Still Air)Horizontal, Heat F l o w Up
-
0.11--
S l o p i n g 4 5 " , Heat Flow Up
-
0.11-
Vertical, Heat Flow Horizontal --- 0.12--
Horizontal, Hear Plow Down --- 0.16-
THERMAL
RESISTANCE OH -SOME COMMUNBUILDING
MATERIALS (Cont'd) Thermal Resistance Building Material or Component: Roofing S . I .-
ImperialB/mm For
in.
ForThickness Thickness
Listed L i s t e d
Asphalt Roll Roofing
--
0 -03Asphalt Shingles -.- 0 -08
Wood Shingles (Cedar Shakes)
--
0 -17 Built-up Membrane (Hot Mopped)--
0.06Crushed Stone ( N o t Dried) 0.00055
--
Sheathing MaterialsSaftwoad Plywood
Mat-Formed Particle Board
Insulating Fibreboard Sheathing Gypsum Sheathing
Sheathing Paper
Asphalt-Coated W a f t Paper
Polyethylene Vapour
Barrier
Cladding Haterials 0,0087-
0.0087--
0.017---
O.UO62---
0.00040--
Negli ,-
N e g l i .--
Ffbreboard Sfding Medium I k n s i t yHardboard,
11 mm (7116")High Density Hardboard,
11 mm (7116")
Softwood Siding (Lapped)
Drop, 18 x 184 m (3/4" x 7
t " )
--
B e v e l , 12 x 184 aan ( * * I x 7 )")-
Bevel, 18 x 235 nm (3/4" x
9
f " )--
Plywood, 9 tam (3/8")
--
Woad Shingles
_-
Brick (Clay or Shale) 100
mm
(4")
-
Brick (Concrete, Sand-Lime)loo
mm
(4")---
Stucco, 25 mm (1") 0.0014 1.25 1-25 2.45 0.89 0.06 N e g l i.
N e g l i *THERMAL RBSISTANCE OF SOW
COMMON
BUfLDING HATEgIALS.(Cont'd) Thermal ResistanceBuilding Material
or Component
S.I. I m p e r i a l
R/w For
in.
FoxThf ckness Thicknes s
Listed L f s t e d
Cladding MaterLals (Conr'dj Hecal Siding
Horizontal Clapboard Profile
Horizontal Clapboard w i t h
Backing
Vertical V-Groove Profile
Vertical Board and Batten Profile
Interior Finishes
Gypsum Boaxd, Gypsum Lath,
Drywall, 13 mm
(4")
0.0062 0.08 0 . 8 9 Gypsum P l a s t e r Sand Aggregate, 13 mm( 3 " )
0.014 0.02 0.20 Lightweight Aggregate, 13 (+") 0.0044 0.06 0.63 Plywood, 7.5nrm
(5116") 0.0093 0.07 1.34 Hardboard, (Standard), hm0")
0.0053 0.03 0.76 Insulating Fibreboard, 25 mm (1") 0.017 0.42 2 . 4 5 FlooringMaple or Oak (hardwood), 19 mm ( 3 1 4 " )
Pine or Fir ( s o f t w o o d ) ,
19 mm ( 3 1 4 " )
Plywood, 16 nrm (518") Mat-formed Particle Board,
16 mm (5/8")
Wood F i b r e Tiles, 13 ma
Linoleum, Tile ( r e s i l i e n t ) ,
3 mm ( 1 1 8 " )
Terrazzo, 25 rmrt (I")
Carpet, Typical Thickness
with F i b r o u s Underlay
T H E W
RESISTANCE
UP SOME COMMON BUILDING MATERIALS (Cont'd) Thermal Resistance BuTldirtg Material or ComponentS.I.
Imperial R / m For R/fn.
For Thickness Thickness Llsced L i s t e d Windows(including i n s i d e and outside
air
f i l m ) Single GlassInsulated Glass (.Double Pane)
5 mm (3116") Air Space 6 mm
E*")
Air Space 13 mm (*") Air Space 19 m ( 3 1 4 " ) Air Space Insulated Glass {Triple Pane)6 mm
(i")
Alr Space13 mm
{i")
Air S p a c e19
aun
( 3 1 4 " ) Air SpaceS t o m Wtndows
Single Pane
+
25-
100 mm(1"
-
4 " ) Air Space 19 mm ( 3 1 4 " ) S e a l e d U n i t+
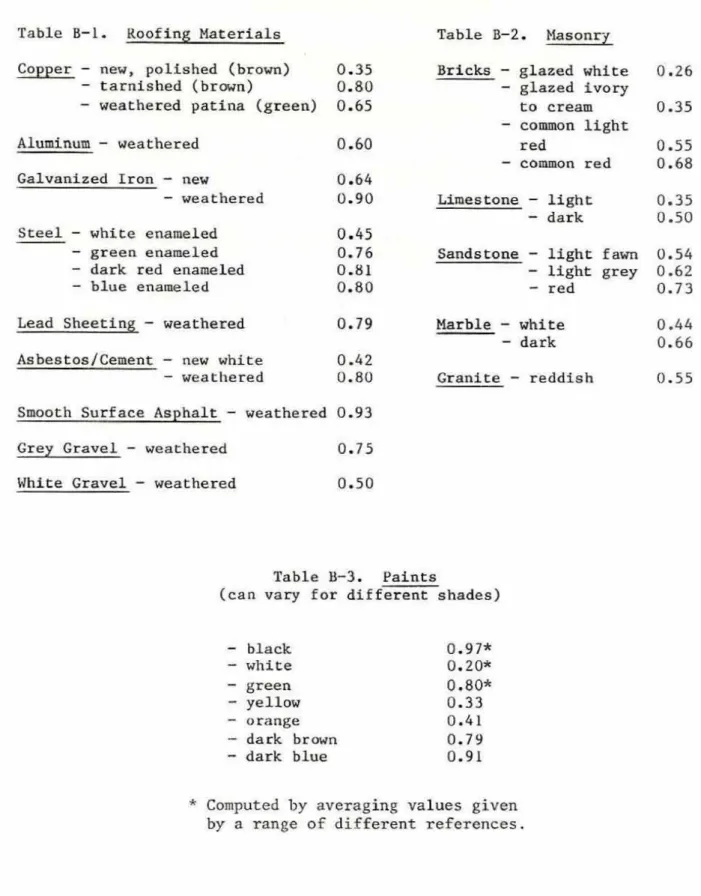
T a b l e B-1. Roofing Materials
Copper
-
new, p o l i s h e d (brown)-
tarnished (brown)-
weathered patina (green) Aluminum-
weatheredGalvamized Iron
-
new- weathered S t e e l
-
white
enameled-
green enameled-
dark red enameled-
blue enameledLead Sheeting
-
weathered~ s b e s t o s / ~ e w n t :
-
new white-
weatheredTable B-2. Masonry Bricks
-
glazed white-
glazed ivory Lo cream-
common light red-
coramun red Limestone - l i g h t-
darkSandstune
-
lightfawn
-
light grey-
red 0.79 Marble-
white-
dark0 -42
0.8U Granite
-
reddish Smooth Surf ace Asphalt-
weathered 0.93Grey Gravel - weathered 0.75 White Gravel
-
weatheredTable B-3. Faints
(can vary for different shades)
-
black-
white-
green-
yellow - orange-
dark brmn-
dark blue*
Computed by averaging values given by a rangeof
different references.References for Appendix 3
Baker, M.C., Roofs: Design, Application and Maintenance, Multiscience
Publications Limited, Montreal, 1980, page 134.
M f i e , J.A., and W.A. B e c h n , Solar Energy Thermal Process, Wiley- Interscfence, John Wiley & Sons, Toronto, 1974, page 97.
Garden, G.K., Therraal Considerations in Roof Design, Canadian Building Digest 70, National Research Council, O t t a w a , October 1965,
page 70-3.
Kreider, 3 . F . , and F. Kreith, Solar Heating and Cooling: Engineering,
Practical
Revised First Edition, HemispherePub1,isMng Corporation, McGraw-Hill, Toronto, 1977, page 247.
S t r o c k , C., and R.L. Koral, Handbook of A i r Conditioning Heating and Ventilating, Second Edition, Industrial P r e s s , New York, 1965, p. 1