Publisher’s version / Version de l'éditeur:
Journal of Thermal Insulation, 14, Jan, pp. 241-267, 1991-01
READ THESE TERMS AND CONDITIONS CAREFULLY BEFORE USING THIS WEBSITE. https://nrc-publications.canada.ca/eng/copyright
Vous avez des questions? Nous pouvons vous aider. Pour communiquer directement avec un auteur, consultez la première page de la revue dans laquelle son article a été publié afin de trouver ses coordonnées. Si vous n’arrivez pas à les repérer, communiquez avec nous à PublicationsArchive-ArchivesPublications@nrc-cnrc.gc.ca.
Questions? Contact the NRC Publications Archive team at
PublicationsArchive-ArchivesPublications@nrc-cnrc.gc.ca. If you wish to email the authors directly, please see the first page of the publication for their contact information.
NRC Publications Archive
Archives des publications du CNRC
This publication could be one of several versions: author’s original, accepted manuscript or the publisher’s version. / La version de cette publication peut être l’une des suivantes : la version prépublication de l’auteur, la version acceptée du manuscrit ou la version de l’éditeur.
Access and use of this website and the material on it are subject to the Terms and Conditions set forth at
Effect of time and temperature on R-value of rigid polyurethane foam
insulation manufactured with alternative blowing agents
Bomberg, M. T.; Kumaran, M. K.; Ascough, M. R.; Sylvester, R. G.
https://publications-cnrc.canada.ca/fra/droits
L’accès à ce site Web et l’utilisation de son contenu sont assujettis aux conditions présentées dans le site
LISEZ CES CONDITIONS ATTENTIVEMENT AVANT D’UTILISER CE SITE WEB.
NRC Publications Record / Notice d'Archives des publications de CNRC:
https://nrc-publications.canada.ca/eng/view/object/?id=2418df3d-861b-47d9-b2a7-89ff224fca0a https://publications-cnrc.canada.ca/fra/voir/objet/?id=2418df3d-861b-47d9-b2a7-89ff224fca0aEffect of time and temperature on R-value of rigid
polyurethane foam insulation manufactured with
alternative blowing agents
Bomberg, M.T.; Kumaran, M.K.; Ascough, M.R.; Sylvester, R.G.
NRCC-35471
A version of this document is published in :
Journal of Thermal Insulation, 14, (Jan), pp. 241-267, January-91
The material in this document is covered by the provisions of the Copyright Act, by Canadian laws, policies, regulations and international agreements. Such provisions serve to identify the information source and, in specific instances, to prohibit reproduction of materials without written permission. For more information visit http://laws.justice.gc.ca/en/showtdm/cs/C-42
Les renseignements dans ce document sont protégés par la Loi sur le droit d’auteur, par les lois, les politiques et les règlements du Canada et des accords internationaux. Ces dispositions permettent d’identifier la source de l’information et, dans certains cas, d’interdire la copie de documents sans permission écrite. Pour obtenir de plus amples renseignements : http://lois.justice.gc.ca/fr/showtdm/cs/C-42
Effect of Time and Temperature on
R-Value of Rigid Polyurethane Foam
Insulation Manufactured with
Alternative Blowing Agents
M. T. BOMBERG AND M. K. KUMARAN National Research Council Canada
Building Peiformance Section Institute for Research in Construction
Ottawa, Ontario KIA OR6 Canada
M. R.
ASCOUGH ANDR. G.
SYLVESTERDuPont C anada Inc. P.O. Box 2200
Streetsville
Mississauga, Ontario L5M 2H3 Canada
ABSTRAcr: A non-destructive technique, involving specimen encapsulation and determination of the dependence of thermal resistance on temperature, to measure the blowing agent pressure in cellular plastic insulation was recently presented. This technique was applied to a polyurethane foam manufactured with different blowing agents and the results were compared with those obtained from model calculations. The results indicate that the long-term solubility of the gas in the polymer matrix may differ from that determined from short-term experiments. The paper presents results for HCFC-123 and HCFC-141b as well as CFC-11 and discusses their im-plication for long-term thermal resistance of polyurethane foams.
This paper was presented at The Society of the Plastics Industry, Inc., (SPI) 33nd Annual Poly-urethane Technical/ Marketing Conference, Orlando, Florida, September 30-0ctober 3, I 989.
JOURNAL OF THERMAl INSUlATION Volume 14-january 1991 241
0148-8287/91/03 0241-27 506.00/0 ©1991 Technomic Publishing Co., Inc.
INTRODUCTION
I
T IS WELL known that the thermal resistance of gas-filled foam (cellularplastic insulation) diminishes with time. This phenomenon is referred to as aging and illustrated with aging curves, i.e., thermal resistivity (inverse of thermal conductivity) shown as a function of time. These aging curves, though useful in representing the average change of material performance, do not shed much light on the details of the aging phenomena. While it is believed that the transport of nitrogen and oxygen from ambient air into the material and that of the blowing agent (BA) out of the material dominate amongst the aging processes, there may be other mechanisms which arc yet not completely understood. For example, what is the part played by the polymer matrix as the foam ages? What is the effect of the environment in which the foamed insulation performs? In various environments the interac-tion between the polymer and the cell-gases may differ. Moreover, the abil-ity of the polymer matrix to retain the blowing agent may' change and hence alter the long-term performance of the insulation. These details can not be derived from the aging curves unless the investigation is complemented with other experimental techniques.
At a time when the industry is hard pressed to develop new blowing agents to replace CFCs, experimental techniques that can give detailed in-formation on the changes in the blowing agent pressure during foam aging are invaluable. One such experimental technique was recently developed and reported by the authors [1]. In this technique, the exchange of gases between specimen and its environment is prevented by means of specimen encapsula-tion. The encapsulation allows the measurement of the dependence of the thermal resistance of the encapsulated specimen on temperature without further aging. This paper reports the application of this experimental tech-nique to sprayed polyurethane foam and the interpretation of the ex-perimental results by comparing with those obtained from calculations based on an aging model [2].
Experimental Procedure
Three foams with the same chemical composition were manufactured under controlled conditions [3], however, with different blowing agents: CFC-11 in foam 1 (called Base 88 [3]), 123 in foam 2 and
HCFC-141 b in foam 3.
Four, 10 mm thick, 300 mm X 300 mm squares were cut from each material and allowed to age in the laboratory environment (temperature 22 ± 1 °C and relative humidity 50 ± 10'X>). Since these materials had aging curves previously determined (3] encapsulation of specimens was per-formed at preselected stages of aging. Most of the encapsulation took place
l"Lfnl <!I I IIIII' <lllcl it'IIIJll'l'a/un· o11 R-Valuc セセヲ@ rゥNセゥ、@ PolyrJrctham• Foam 243
during the first four weeks (short-term aging, e.g. , 10, 15, 20, and 25 days) . For comparison, however, one specimen wa ·also encapsulated in the middle term, after 62 days, when the frac tio n of air in the cell-gas was much hi gher but the process of air ingress was still incomplete, and one specimen after long-term exposure (365 days) , when th air in gress proccs w as e scnti ally completed [3]. Then, after approxim ately one more week of sto rage, to allow some cell gas equalization, the temperature dependence f the thermal resistance of these encapsulated specimens was measured. The specimens were again left in the laboratory environment for a period of up to one year, after which temperature dependence of their thermal resistances was remea-sured .
Research Approach
The above experiments were designed to observe the changes undergone by the encapsulated specimens while left in the laboratory. One or more of the following changes may possibly happen:
1. Redistribution of the gases in the enclosed space 2. Change in the physical properties of the polymer
3. Adsorption or desorption of the blowing agent from the cell-gas (affect-ing its partial pressure)
4. Adsorption or desorption of the air components from the cell-gas The above changes 1-4 will affect thermal resistivity-temperature curves. While using the curves to study the above effects, one must remember that the experimentally determined thermal resistivity-temperature curves will differ from one tc t specimen to anoth er. The ex perimental vari ability may be caused by thr e reason s. First, th e pcci mcn wc.re ncapsulated at different stages o f aging so th at th e above di cu sed changes mi ght have been advanced to diftc rent ex tent . Next each o f thl· specimens mig ht have tarred aging at different initi.al pressures of bl wing age nt (establish cl durin g foamin g) . Third , the rate o f gas diffusi n may differ between vari u speci-mens, so that different degrees of agin g arc attained during the ame time. This makes the interpretation of the experimental data a rather challenging task. Even if the experiments would include different specimens as well as the same specimen retested after different periods of storage, the experimen-tal data alone may not be sufficient to establish the cause-effect relations. On the other hand, if an appropriate model is used to establish the cause- effect relations and to simulate one or more of the above changes, their cumulative effect on thermal resistance can be calculated.
First, to examine the effect of experimental conditions on thermal resis-tivity-temperature curves, r = r(T), the model calculations were performed
244 M. T. BOMBERG, M. K. KUMARAN, M. R. ASCOUGH AND 1< . G. SYLVESTER
on a homogeneous layer of the ideal material (the blowing agent does not dissolve in the polymer matrix). These calculations examined such effects as the change in specimen thickness, applied thermal gradient or the period of storage after encapsulation.
Then, セィ・@ model calculations were used to provide a basis for the un-derstanding of such effects as redistribution of pressure in the encapsu-lated specimen, absorption of air components or absorption of the blowing agent by the polymer matrix. Some of these processes will result in a verti-cal, while others in lateral shifts of the thermal resistivity-temperature curves.
The next step in the research was to apply the experimental procedure and collect information on r
=
r(T) curves for foams manufactured with dif-ferent blowing age nts: CFC-11, HCFC-123 and HCFC-141b. To under-stand the actual processes occurring in the foam, some of the experimental data w ere compared with the model calculations. The use of model calcula-tions is, however, limited by the difficulty in developing the input data, par-ticularly the full description of aging conditions since the specimen manu-facture. Only the Base 88 was, therefore, analyzed with help of the model. These findings were further verifted with a technique [1] based on the Clausius-Clapeyron equation, called the beginning of condensation (BC) method. All the experimental results gave evidence to the fact that during the prolonged storage period a significant reduction in the blowing agent pressure took place within the encapsulated specimens. Some of the non-encapsulated specimens were also tested after long-term laboratory storage and found to have a similar reduction in the blowing agent press ure.The repeated testing highlighted also another issue, namely the material variability. To address the cumulative effects of material variability, short and long-term blowing agent solubility, environmental factors, etc., the authors postulate a new methodology making a division between time-dependent and time-independent variables and propose a new agenda for the research on performance of alternative blowing agents in foams.
MODEL CALCULATIONS
A finite difference model [2], was used for the calculation of thermal resistivity. This model accommodates the effect of condensation and evapo-ration of the blowing agent under conditions applied during the measure-ments of thermal resistivities. The different parameters needed for calcula-tions as well as typical values for the parameters for an idealized material [homogeneous polyurethane foam with no capability to absorb or dissolve the blowing agent (CFC-11) by its polymer matrix J are listed in Table 1.
If/len <!/ '1"111/(' 1111d 'Ji·tupcTatun· 011 R-l'{1fltc <!f l?(r,;id l'o/yurctlwtl£' hllllll 245
Table 1. Material characteristics used for an idealized material as input to the model of aging.
Material Characteristics Blowi ng agent (CFC-11) characteri zation:
initial pressure [ 5) solubility •
Foam structure characterization: (I) effective diffusion coefficient for
oxygen [8, 9, 1 OJ
nitrogen CFC.II
(2) mass extinction coefficient [2, 11) (3) fra ction of struts
Solid polymer characterization [8, 11): polymer thermal conductivity polym er density
polymer specific heat
• Solubility is zero by definition .
Value Used 0.66 atm 0 0. I x I 0-6 cm2/s 0. 1 x 10⁻⁷ cm2/s 0.2 x 10⁻⁹ cm2/s 55m2/kg 0.85 0.27 m. KIVV 1220 kg/m3 900 J/(kg .K)
measurements on the idealized material was considered . Theoretically, to get the true thermal resistivity, measurements should be carried out with ther-mal gradients that approach zcr . Tc generate this theoretical data, a temper-ature difference of 0.2° C was app lied across a 25 mm thick material, aged for two weeks in the laboratory, and thermal resistivity was calculated for the range of tempcrilture bt·twccn 40°C and - 20°C. The results arc denoted in Figure 1, as "theory." The above calculations were repeated for two other situations. First, measurements according to ASTM standard test methods C 177 or C518 were simulated by assuming a thermal gradient of 26°C across a specimen of thickness 25 mm. Next, the test conditions used in previous research [I J were stimulated (1 0 ° C difference across a specimen of thickness 10 mm). The results from these two calculations are denoted in Figure 1, as "ASTM" and "NRC test" respectively.
The theoretical curve shows that when the specimen is cooled from 40 ° C, its thermal resistivity increases linearly until a point where the blowing agent starts to condense. This point, called the beginning of condensation (BC) point may be observed at about 16.5°C on the theoretical curve. Any further reduction in temperature successively decreases the amount of the blowing agent in the cell gas mixture until the whole blowing agent has been liquified out of the cell gas mixture [1].
Because of a large temperature difference applied in the second curve in Figure 1 (corresponding to the typical conditions in an ASTM test), the blowing agent may condense at the cold surface while the rest of the
speci-246 M. T. BaMBERG, M. K. KuMARAN, M. R. AscouGH AND R. G. SYLVESTER 86
es
61 thermal resistivity, m.K/W r'/{
.!/
··· ..セ セ NI@
:
'·i<) sc
point ' (2 . ....' i ....
(3)[,
(1) theory (2) NRC teat (3) ASTM testl \
VY lMMM MMMMセMM MM MMセ MMMMセMMセMMMMMMMj@ -10 0 10 20 30temperature, C
FIGURE 1. Effect of thermal gradient on the average thermal resistivity of a test specimen as shown by model calculations.
men does not participate in the condensation process. Further reduction in specimen temperature will increase the region of condensation until at a cer-tain stage the blowing agent condensation occurs in all parts of the speci-men. In two regions: (1) when there is no condensation at all and (2) when all parts participate in the condensation process, the "ASTM" curve coincides with the theoretical curve. But in between these regions, the experimental curve determined according to ASTM standards C 177 or C518 deviates from the theoretical curve.
The third curve, (NRC test) shows a deviation in the region of partial con-densation, but smaller than that observed in the ASTM test. Since the agree-ment between the NRC test and the theoretical curve appears sufficient, all subsequent simulations are done on 10 mm thick specimens with 10°C thermal gradient.
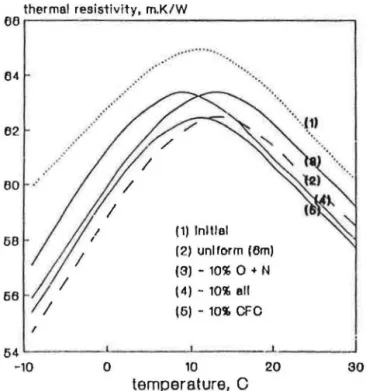
The "NRC test," i.e., the experimental curve in Figure 1 is denoted "(1) ini-tial" in Figure 2 since the thermal resistivity measurements were done im-mediately after the encapsulation. What could happen if the measurements are done after some time? How will the curve be affected if one or more of the changes listed earlier occur? To answer these questions the initial test
Ujfut <>f 'J'illlt' a11d 1i'111paature on R-Value <!l Rigid Polyurctlumc Foam 24 7
curve (1) in Figure 2 is compared to four other curves simulating the follow-ing conditions:
• Curve (2) uniform air pressure: the oxygen and nitrogen that entered the specimen prio r to the enca p. ulati o n had been redistributed, (e.g., during six mon ths toragc) and have unifo rm pressure throu ghout the specimen. • Curve (3) air absorptio n: uniform pressure but 10 % of air components
(each nitrogen and oxygen) were absorbed
by
the polymer matrix . • Curve (4) blowing agent absorpti n: uniform pressure but 10% of thebl win g ag nt alo ne was absorbed by the polymer matrix.
• Curve (5) cell-gas absorption: uniform pressure but 10% of each cell-gas (nitrogen, oxygen and blowing agent) was absorbed by the polymer matrix.
Figure 2 indicates that the redistribution of nitrogen and oxygen consis-tently reduces the thermal resistance through the entire range of temperature and hence there is a vertical shift between curves (1) and (2). When 10% each of nitrogen and oxygen is absorbed by the polymer matrix, thermal
resis-thermal resis-tivity, m.K/W Vb イMMMMMMMMMMMセMMMMMMMMMMMMMMMMMM MMMM セ@ 64 62 80 .· 58 58 I 54 -10 0
···
..
··
··
..
..····
··
..
···
... ···.(11···
... (1) Initial (2) uniform (Bm) (3)- 10% 0 + N (4) - 10% all (5)- 10'1. CFO 10 20temperature, C
·· ..
··. ·.
'•, 30FIGURE 2. Effect o f redistribution and absorption of gas components as shown by model calculatio ns .
tivities consistently increase through the temperature range producing again a vertical shift between curves (2) and (3).
Curves (4) and (5) address the effect of the blowing agent absorption. Curve (4) introduces 10 percent blowing agent absorption to the equalized cell-gas pre sure · that were obtained after six months of redistributi.on [curve (2)]. Curve (5) deals with uniform cell-gas pressure but ai r pressure is 10%, lower than in case (4)-in ther w rds b th air and blowing agent had their partiaJ pressures reduced by
"10%.
Comparing curve (4) to curve (2) and curve (5) to curve (3) (both analyzing the effect of 10% blowing agent absorption) one may notice a lateral shift. The magnitude of this lateral shift differs depending on cell-gas composition. The lateral shift between curves (3) and (5) is larger than that shown between curves (4) and (2). The same blowing agent absorption changes the cell-gas composition to a larger extent for the curve (5) than for the curve (4). This difference may be asso-ciated with the change in the air pressure that altered the cell- gas composi-tion since in the latter case the air pressure is 10 percent higher.Thus, the model calculations performed on the ideal foam showed that while vertical shift of the r
=
r(T) curves may be associated with a numberof phenomena, such as redistribution or absorption of the air components within the e!1capsulated specimen, there is only one reason for the lateral shift of these curves, namely a change in the blowing agent pressure. The fact that the lateral shift in the beginning of condensation (BC) point is uniquely correlated to the change in the blowing agent pressure will be uti-lized later in this paper.
EXPERIMENTAL RESULTS
Foam Blown with CFC-11
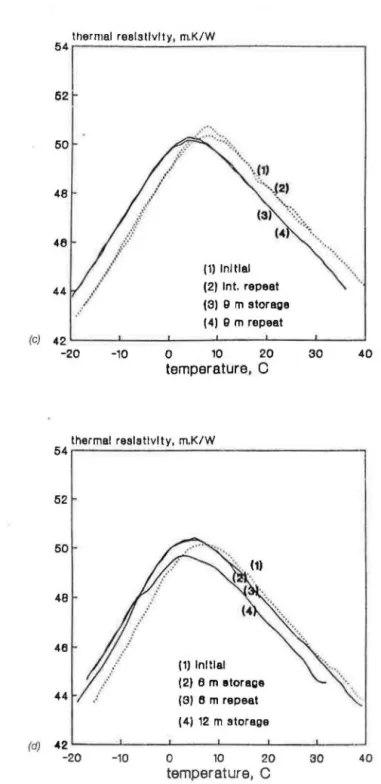
Figures 3(a) through 3(d) how the thermal rcsi tivities as a function of temperature measured on four specimens encapsulated during sh rt-term aging in the laboratory. These specimens were tested after 7 tO 14 day of laboratory storage, again stored for 6 to 12 month and retested . An excep-tion is shown in Figure 3(a) where the retesting was addiexcep-tionally performed after 1 and 4 months. One may observe the gradual shift in thermal resis-tivity-temperature curves that occurs with prolonged storage. Such a shift between curves established initially and after an extended laboratory storage may be also seen in all four specimens shown in Figures 3(a) through 3(d) . Figures 3(b) through 3(d) show a number of repeated measurements, pri-marily to illustrate that these measurements were made with the precision high enough to observe the gradual shift in the r
=
r(T) curves performed after different periods of storage.(a) 54 .. · BG BNjャャカャセQ@ 111.1\t セセ@ 52 50 48 46 (1) Initial (2) 1m storage 44 (3) 4 m storage (4) g m storage 42 -20 -10 0 10 20 30 40 temperature, C
therme.! resistiv ity, m.K/W
54r---. 52
60r
TX セ@
I 46 44 (1) Initial (2) Int. repeat (3) Q m storage (4) g m repeat セ@ TRセMMMjMMMMセMMMMセMMMMセMMMMセMMセ@ - 20 -10 0 10 20 temperature,C
30 40FIGURE J. F.xperilllL'IHal 、Zッエセ@ on ャャ [ エセエᄋ@ l:ll! (CF - 11) sp.:cillll'I'IS, t·no:apsu lntcd a1 cliflcrcut
stag..:s of セァゥョァ [@ (a) after 9 days, (b) セョャᄋイ@ IS cl. ys. (c) セヲQョ@ 20 days, セオ、@ (d) aftLT 25 days.
thermal resistivity, m.K/W UT イMMMMMMMMMMM セ MMMMMMMMMMMMMMMMMMMMセ@ 52 50 48 46 (1) Initial (2) Int. repeat (3) 9 m storage (4) 9 m repeat (c) 42 L - - L - - - . JL-- - - ' - - - - ' - - - - '--__J -20 -10 0 10 20 30 40 temperature, C thermal resistivity, m.K/W UTNM MMMMセ MMMMMMMMMMMMMMMMセ@ 52 46 (1) Initial (2) 6 m etorage (3) 6 m repeat (4) 12 m storage (d) 42 -20 -10 0 10 20 30 40 temperature, C
FIGURE 3 (continued). Experimental data on Base 88 (CFC-11) specimens, encapsulated at different stages of aging: (a) after 9 days, (b) after 15 days, (c) after 20 days, and (d) after 25 days.
':tit•' セセL@ ' ,, ,,, ,,,,, ' ' ' ' ' j ' tlc/111/t t ' ll I\ 1 dlllt セセセ@ Q|iLセiAijエャOIGャャャエエヲャ」ャOOャ@ J Od/11 ..:...:.J I 41'l 44 42 thermal resistivity, m.K/W encapsulated alter (1) 11 days (2) 20 days (3) 25 days (4) 62 days SX セ M MMMMセMMMMセMMMMセMMMMセMMMMMlMMMMセ@ -20 -10 0 10 20 30 40 temperature, C
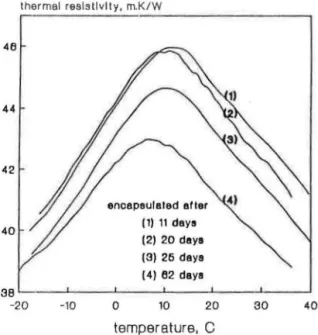
FIGURE 4. Experimental data on foam 2 (HCFC-123) specimens, encapsulated at different stages of aging.
Foam Blown with HCFC-123
Figure 4 sho ws initial measurements of thermal resisti vity on three sp d-mcns encapsulated 。ヲエ」セ@ short-term and one pecimcn encapsulated after medium-term aging. The latter specimen (cncap ulated after 62 days), di s-played thennal rcsi tivity-remperarure curve lower and laterally shifted from the curves obtained for three pecimens.
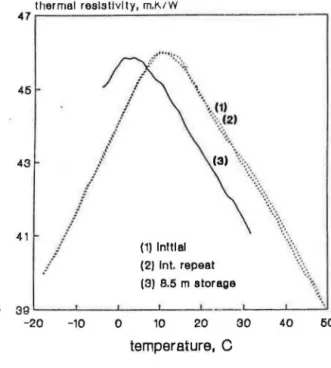
Figures S(a) through S(c) how th ermal re·i tiviry-tcmpcraturc curves for the same specimens wh en retested after long laboratory sroragc (8 to 9 months) compared with the initial measurements. Similar to the tests on specimens from CFC-11 blown material, retesting after long storage was associated with shifts in the thermal resistivity-temperature curves.
Foam Blown with HCFC-141b
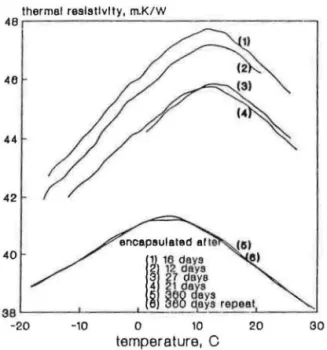
Figure 6 shows initial measurements of thermal resistivity, i.e., 7-14 days after encapsulating the specimens. The specimens were encapsulated after 12, 16, 21,27 and 360 days of aging. The latter specimen (encapsulated after 360 days), displayed a thermal resistivity-temperature curve much lower and laterally shifted from the curves obtained for the other four specimens. These four specimens that were encapsulated after short term aging, were
(a)
thermal resistivity, m.KIW
TWイM MMMMMMMMセMMMMMMMMMMMMMMMMMM ᄋ MMML@ 45 43 41 /
...
,
...\
.. 'II
\ __
... (1)i
··:; ..
(2) ,, ··::. セャᄋ@ MZセ@ .... セ@ .../
... . / / (1) Initial (21 Int. repeat (3) 8.5 m storage ·,\ \ SYセMMMlMMMMセMMMlMMMMlMMMMlMMMMlMMMセ@ -20 -10 0 10 20 30 40 50 temperature,C
· thermal resistivity, m.K/W 47r---, 45 43 41···=··· .. \\ ..
·.{1) '•i21ᄋセ ᄋL@
.... , .. r···· ••. (1) Initial {2) Int. repeat (3) 8 m storage (4) 8 m repeat··
...\\
セ|N@\ :...·
•...···
.... (b) 39 ' - - - L - - - - L- - -l - - - ' -- - - ' - -- - ' ' - - - - ' -20 -10 0 10 20 30 .40 50 temperature,C
FIGURE 5. Effect of storage period on the thermal resistivity-temperature curves for foam 2 (HCFC-123) specimens cncapsulatc·d at dilfeTl'Jlt stages of aging: (a) after 10 days, (b) after 15 days, and (c) after 25 days.
tillllllltil ltJHI:!liVIly, m.K/W TW イMMMMMMMMMMMMMMMMMMMMMMMMMMMMMMMMMMMMM セ@ セᄋᄋᄋ ᄋ ᄋᄋᄋᄋᄋᄋ@ '• 45 ···{1) ··•···• ...
··
... 43 41···.\·
...• (1) Initial (2) 6 m storage (c) :m ,__ __ ..__ __ ..__ __ _.__ __ _._ __ ...1.. _ _ _ _ , -20 -10 0 10 20 temperature, 0 30 40FIGURE 5 (continued). Effect of storage period on the thermal reststtvlty-temperature
curves for foam 2 (HCFC-123) spccimms encapsulated at differmt stag<·s of aging: (a) after 10
days, (b) after 15 days, and (c) after 25 days.
encapsulated art e
ケャ Q
Q
セ、セッセセ@
S セW@ oys 4 1 BJ:Sg g
m
repeat SXセ MMMセMMMMセセセセセ N MMセセMMMMセ@ 40 -20 -10 0 10 20 30 temperature, CFIGURE 6. Experimental data on t(,am 3 (HCFC-141 b) specimens encapsulated at different stages of aging.
RセT@ M. 1. HaMBERG, M. K. kオmaセanL@ M. 1<. aA^luu|N^セQ@ A"•u t>.. u. [Lイlカlセilk@
retested after 10-11 months of the laboratory storage. The results are shown in Figures 7(a) through 7(d). Again, all specimens retested after an extended storage time displayed signiftcant shift in the thermal resistivity-tempera-ture curves.
DISCUSSION
All encapsulated test specimens prepared from the three materials included in this work, when retested after long storage, exhibited shifts in their ther-mal resistivity-temperature curves. These shifts, however, varied depending both on the duration of aging before encapsulation and the period of time before testing.
Application of the Aging Model
As indicated earlier, to interpret these experimental findings, supporting model calculations were performed. To do so, the input data must comprise the following elements:
1. Material characteristics, i.e., quantities characterizing the structure of the foam and properties of solid polymer
2. Blowing agent characterization, i.e., distribution of the blowing agent partial pressure and solubility of the blowing agent in the polymer matrix at the stage of aging for which the calculation is performed 3. Other initial conditions, such as distribution of the oxygen and nitrogen
partial pressures and their solubility in the polymer matrix
4. Boundary conditions, i.e., temperature and gas pressures at the specimen surfaces for the whole period of aging starting from the moment of man-ufacturing and ending at the moment of calculations
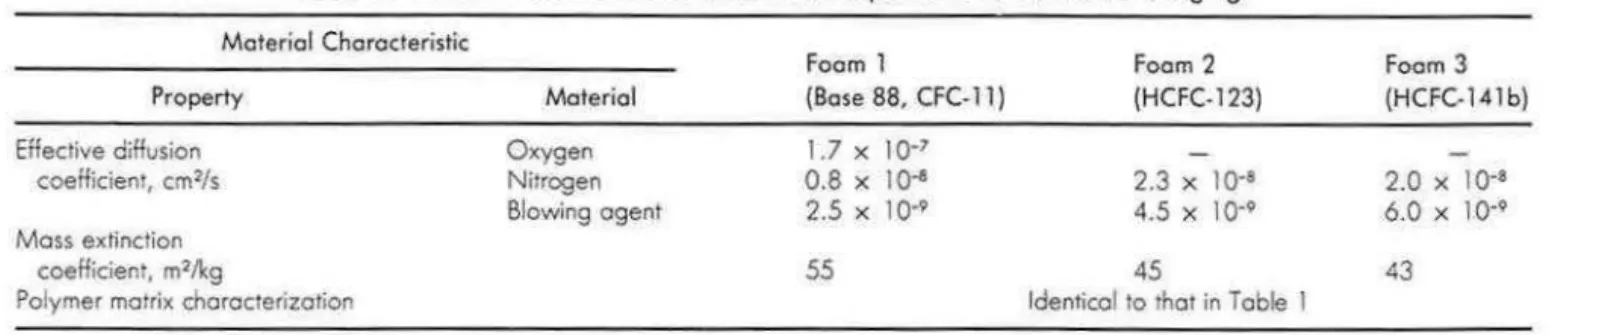
A list of material characteristics used in the calculations on actual materials, derived [2] from representative experimental data on attenuation of infrared radiation, initial thermal resistivities and aging curves, can be found in Table 2. In addition to these material characteristics, initial condi-tions (initial pressure distribucondi-tions of oxygen, nitrogen and blowing agent) and boundary conditions are needed as the input to the model. While the ac-tual cold and hot plate temperatures in the Heat Flow Meter apparatus were used as the boundary conditions, the determination of the pressure distribu-tions of each cell-gas component at the actual stage of the aging process was much more difficult.
The pressure distributions of oxygen and nitrogen were calculated as a function of time for each type of subsequent exposure since the material manufacturing (e.g., transport and storage of a 60 mm thick board for 45 days, cutting 25 mm specimens and their storage in the laboratory, cutting
47 45 43
.··· .
... ::::::::: .•.•... :::::::::··.(1) (2)·:· . ... ...··
•.. (1) Initial (2) Int. repe at (3) 10 m storage (4) 10 m repeat···
...
•··
...··
..
•·· ... セ@ SYセMMセMMMMセMMMMセMMMMセMMMMセMMセ@ -20 -10 0 10 20 temperature,C
thermal resistivity, m.K/W 47 ... ··· ...セQ I@
·.
···
...···
... 45 43 41 (1) Initial (21 11 m storage 30 セ@ SYセMMセMMMMセMMセMMMMセMMMMセMMセ@ -20 -10 0 10 20 30 40 temperature, CFIGURE 7. cffi·ct uf ウ キイョセャ G@ pl•riod ()II tlw tlwrnml n-sistivity- tl'lllp<·ratun· ('llfVCS fi,r foam .1 (H C FC- 141b) spcdn11·ns 」ョ」セーセ オャ。エ 」、@ セセ@ difl'Nct1t s tat-;cS of :agi ng: (a) n(tn 12 dJys. (b) aftt•r 16
、セケウN@ (c) alter 2 1 、。ケセN@ :ami (d) aft<'r 27 days
(llt.JIIIIUIItt::u •. H I YilY,ItLf\/VV 47 45
... ···· ··· ..
HQセ N@ •"·•···
...··
..
··
...
43 41 (1) Initial (2) 10 m 'torage セセ@ SPセMMセMMMMセ MMMMセMMセMM MMセMMセ@ -20 -10 0 10 20 30 40 temperature,C
thermal resistivity, m.K/w 47... ···.
....
ᄋᄋ ᄋᄋᄋᄋᄋᄋᄋ セセᄋ@
··
..
46···· ...
43 41 (1) Initial (2) 10 m storage···
...··
..
'··· ...
·· ..
..
...·.
··.
SqセMM⦅j MMMM MlMMMMセMMMMセMMMMlMMMセ@ (d) -20 -10 0 10 20 30 40 temperature, CFIGURE 9 (continued). Ct>mp:lrisonuf t•xpt:rilllcntnlthcrma l イ」ウゥ ウ イゥカゥエ ケM エセ ᄋ ョQー 」イZ Qエオイ 」@ curves
dncrmincd 1111 IWt' 「。エ」ャエセᄋウ@ of foam 2 (HC FC- 123) ウー」、 ュセ ᄋ ョ ウ@ cncapsu lnt<·d at dilfcrcnt stag,·s or 。セゥ ョァ Z@ (a) after lOI II days. (b) a lin 20 days. and (c) after 25 days.
IV
U'
-...!
Table 2 . Material characteristics used as the input data to the model of aging.
Material Characteristic Property Effective diffusion coefficient, cm2/s Moss extinction coefficienr, m21kg
Polymer mouix chorocterizotion
Material Oxygen Nitrogen Blowing agent Foam 1 Foam 2 (Bose 88, CFC-11} (HCFC-123) 1.7 X 10•7 0.8 X 10⁴ 2.3 X 10·4 2.5 X 10"9 4.5 X 10·9 55 45
Identical to rhor in Table 1
Foam 3 (HCFC-141b)
2.0 X 10·8 6.0 X 10·9
RUセ@ M . T. BaMBERG, M. K. KUMARAN, M. t<. Asc.uuuH ANU 1<. G. セョカセセャャk@
'10 mm thick specimen, further aging for 9 days prior to the encapsulation and finally 14 days storage after encapsu lation). Then , the calculated pressure disrribut.ions of oxygen and nitrogen were used as the input (initial condi-tions) ro the model simulations of the r == r(T) curves. The in.itiaJ partial pressure of the blowing agent was determined to be 0.52 atmosphere by means of applying Clausius-Clapeyron equation (1
J.
Using the e input data, the model generated therma l resistivity- tempera-ture curves, which are shown in Figure 8. The encapsulation was simulated in the model calculations by adding a very high flow resistance at the speci-men surface and the calculation was continued for the actual storage period. Sim.ilarly to the results hown io Figure 2 on the ideal foam, the cell-gas pressure equa"lization occurring as the effect of encapsu lation introduced only a vertical shift into ,.
=
r(T) curves. To reproduce the lateral shift shown by the experimental curve determined after 9 months of laboratory storage [see Figure 3(a)] the blowing agent pressure had t be changed. Fur-thermore, it became clear from repeated model calcu lations, that to match the actual shift in r=
r(T) curves of the encapsulated specimen, the process of nitrogen and oxygen redistribution had to be complemented by their ab-sorption. The best fit, shown in Figure 8, was obtained with blowing agent pressure equal to 0.46 atmosphere, i.e., reduction of 0.06 atm and with the average oxygen and nitr gcn pressures reduced to 94 percent of those at the moment of encapsulation.Lateral Shift in Thermal Resistivity-Temperature Curves Since the goal of our work was to examine the long-term changes in cell-gas concentration, the encapsulated specimens were stored, for a period of minimum 6 months, to complete the redistribution of nitrogen and oxygen within the specimen. Uniform distribution of pressure across the specimen allows application of the BC method [1] to find if any change in the blowing agent pressure occurred during the torage period.
Figure 8 compared model cal ul, tions with the experimental results shown in Figurt· 3(a) [typical of the rc ult presented in Figures 3(a) through 3(d)] . T hey all how shifts in the thermal resistivity-temperature curves that can be attributed to two effects:
1. Cell-gas pressure equalization 2 . Absorption of cell-gas components
Figures 3(a) through 3(d) show that the effect of redistribution of oxygen and nitrogen on r
=
r(T) curves, the vertical shift, is gradually decreasing with increasing the aging period before encapsulation . (Similar conclusion had been drawn from the ideal foam results shown in Figure 2.) A few weeks increase in the aging period, however, did not affect the lateral shift [shift ofH.Jji·ct (!/ Ti111e and 'lc111perature Ml R-Val11e of Rigid Polyurethane Foam 259 64 62 60 46 44 thermal resistivity, m.K/W • (1) measured, Initial t:. (2) measured, 9 m storage (3) calculated, Initial - (4) calculated, 9 m storage TR セMMセMMMMMlMMMMMlMMMMセMMMMセMMMセ@ -20 -10 0 10 20 30 40 temperature, 0
FIGURE 8. Comparison of measured and cxpnimcntal thermal rcststtvtty-tcrnperature curves for Base 88 (CFC-11) specimens encapsulated after 9 days of aging.
the beginning of condensation (BC) pointJ . The shifts in BC point of 4.0 and 4. 0 determined for the pccimcns cnca1 su latcd after 20 and 26 days
of aging arc not significantly different from the va.lu s f 5.0 and 4.8°C shown by the pccimcns encapsu lated after 9 and IS days of agin .
The 」aセ・」エ@ com.mon to all
fc
ur encapsulated test pccimcn of Base 8ap-pears to be a significant decrease in the blowing agent pressure during the extended storage. Model cal.culations performed t reproduce the experi-mental data shown in Figure 3(a) through (d) indicated that after ex tended storage of the en cap ulated specimens blowing agent partial press ure ranged between
0.42
and0.46
atmosphere. These figwcs arc comparable to the esti-mates derived from BC method (0.43-0.44 atm) (fable 3). These va lues are, however. much lower than the range of0.60
to0.65
cstab li bed on the fresh foam by means of indirect tesr methods[4,5].
Measurements performed on foams manuf:1 turcd wi h HCFC-123 and HCF -141b showed even larger appnrcnt* hifts in the BC point. A shown in Thb lcs 4 and 5 th · apparent shift in the U point varie in the range be-tween 8.5 and 6.0°C for foam manufactured with HCFC-123 [Figures S(a),
*The word apparent underlines the eセ・エ@ that the non-uniform distribution of oxygen and
Table 3. Changes in thermal resistivity-temperature curves observed over 7 to 9 months period in the spray polyurethane foam manufactured with CFC-11.
Encapsulated Apparent Shift Long Term Values far
Figure after in BC Point BC Point BA Pressure
Number Days
oc
oc
atm3(a) 9 5.0 2.4 0.43
3(b) 15 4.8 3.0 0.44
3(c) 20 4.0 2.7 0.43
3(d) 26 4.3 3.2 0 .44
Table 4. Changes in thermal resistivity-temperature curves observed over 8 to 9 months period in the spray polyurethane foam manufactured with HCFC-123 .
Encapsulated Apparent Shift Long Term Values for
Figure after in BC Point BC Point BA Pressure
Number Days
oc
oc
atm4(a) 11 8.5 2.8 0.35
4(b) 15 6.0 2.8 0 .35
4(c) 25 6.5 3.0 0.35
Table 5. Changes in thermal resistivity-temperature curves observed over 10 to 11 months period in the spray polyurethane foam manufactured with HCFC-141 b.
Encapsulated Apparent Shift Long Term Values for
Figure after in BC Point BC Point BA Pressure
Number Days
oc
oc
atm7(a) 11 11.5 5.0 0.33
7(b) 16 14.0 4.5 0.33
7(c) 21 12.5 4.8 0 .33
7(d) 27 10.0 6.0 0.35
lf[Ji'cr ''' Fi111c 11111! 'Ji·111pcmturc 011 R-Valuc· エセO@ uHセゥ、@ Polyurethane 1-l!ll/ll 261 (b), (c)] and between 10 and 14°C for HCFC-141b [Figures 7(a), (b), (c), and (d)]. Such a large shift in the BC point indicates an increased solubility of the HCFC in the polymer matrix.
Larger solubility of the HCFC may also be inferred from the lateral shift in BC point observed during the initial testing. Figure 4 shows initial testing of the foam with HCFC-123 blowing agent for specimens encapsulated after 11, 20, 25, and 62 days. The curve for the last specimen shows also a lateral shift in BC point relative to the other three curves. Figure 6 shows initial testingoffoam manufactured with HCFC-141b for specimens encap-sulated after 12 16 21, 27, and 360 day . Ln the last case the BC point i ap-proximately 5.0°C giving ー。イエゥ[セャ@ pres ure ofHCFC-141b equal to 0.33 atm, i.e., identical to the results determjned on specimens encapsulated after 10 to 30 days and tested after 8 to 12 months of storage. It is important to realize, comparing the c encap ulated p cimens and those exposed to laboratory air, that even though their overall thermal resistivity differed approximately 10%, the same BC point was determined after one year time. The fact that the results obtained on encapsulated and non-encapsulated specimens were similar indicates that the blowing agent pressure reduction cannot be fully attributed to the outward diffusion ofblowing agent but that the total solu-bility of the blowing agent (either blowing agent absorption on the surface or blowing agent dissolution in a polymer matrix) must also be taken into
consideration. ·
Material Variability
Another issue examined in this work, was that of differences between ex-perimental results. There are four reasons to expect differences between thermal resistivity-temperature curves, namely:
1. Different initial pressure ofblowing agent (differences up to 30'Yo were shown previously (3])
2. Variation in the rate of gas diffusion (for Base 88 the effective diffusion coefficient for nitrogen varied between 0.8 and 1.8 cm2/s)
3. Variation in the cell structure (the mass extinction coefficient varied be-tween 45 and 55 m2/kg [3])
4. Variation in the blowing agent solubility in the polymeric material Thus, to examine variability in the thermal resistivity-temperature curves another batch of foam 2 (HCFC-123) was produced and an identical test program was performed.
Results obtained on the specimens representing the same product but manufactured at different occasions are reported in Figures 9(a) through 9(c). These figures compare thermal resistivity-temperature curves established on specimens from two batches but subjected to identical aging conditions.
L(>L M. I. !JUMULRG, M. K. Q|umaセanL@ M. 1<. AILUUGH AI•W li. G. ZLカlv」セilセ@
While results shown in Figures 9(a) through 9(c) display the same character of the r = r(T) curves, they also illustrate that direct comparisons between curves generated on different batches are difficult. Therefore, as previously postulated [3,6], one should perform two different types of measurements: 1. To establish variability in thermal performance of the product (e.g.
varia-tion in the initial thermal performance)
2. To establish time-dependent effects. The latter requires that a non-destructive testing is performed on the same specimen over extended period of time.
CONCLUDING REMARKS
To optimize thermal performance of the foams one must consider a num-ber of different physical and chemical phenomena, some of which are better understood than others. The importance of ingress of the air components into the foam has been known for many years. In a parallel fashion all reduc-tion in the blowing agent pressure has been associated with the outward diffusion of the blowing agent. This paper shows that such an assumption may be incorrect and that the solubility of the blowing agent cannot be neglected :
Long-Term Solubility of the Blowing Agent
This paper focused attention on the long-term changes in the cell-gas composition which are affected by the polymer matrix . To eliminate the change in the composition of cell-gas caused by the diffusion processes the experiments were performed on encapsulated specimens.
Significant shifts in thermal resistivity-temperature curves were measured on the encapsulated specimens. The shifts between r = r(T) curves estab-lished initially and after an extended laboratory storage were shown to exist in all tested specimens. Using the model of aging and comparing various calculated curves with those experimentally obtained, two reasons for these shifts were established:
1. Redistribution of the gases in the enclosed space, (pressure equalization) 2 . Sorption of various components of the cell-gas mixture which in turn affect the composition of the gas (reduction of pressure of the cell-gas components)
It is not known whether the latter process is caused by a surface phenome-non associated with a change in the interaction between the polymer and the cell gas, or by a penetration of the cell-gas into the polymer matrix. One may even assume that a change in the physical properties of the polymer may
111111 llltll 1 ealatlvlty, 1n.I\/W TWイM MMMMMMMMMMMMMMMMMMMMMMMMMMMMMMMMMMセ@ 45 ···· .. \\' .. (tl
2l ... .
··
..
... 43 {11 11 daya, batch 1 \ ..•.••••..•• \ •.. (2) 10 days, batch 2 \ ... . SYセMMセMMセMMセ セMMセMMセMMMMセセ@ 41 (a) -20 -10 0 10 20 30 40 50 temperature, C thermal resistivity, m.K/W 46 44 42 encapsulated after·.
40 (1) 20 days, batch 1 ... (2) 20 days, batch 2 (b) 38 -20 -10 0 10 20 30 40 50 temperature,C
FIGURE 9. Comparison of experimental thermal resi stivity-temperature curves determined on two batch<·s of foam 2 (HCFC-123) specimens encapsulated at different stages of aging : (a) after 10111 days, (b) after 20 days, and (c) after 25 days.
264 M. T. BaMBERG, M. K. KUMARAN, M. R. ASCOUGH AND R. G. SYLVtSitR thermal resistivity, m.K/W 46 (c) 1) 44 •• • • • u • ••
....
/i'./
"··· ... __
i21··
.. ._
/....
....
... . 40 ... ··/ / encapsulated after ·· .. (1) 25 days, batch 1 \ ... . (2) 25 days, batch 2 42 SX セMMj⦅MMセMMMMセMMセMMセMMMMセMMセ@ -20 -10 0 10 20 30 40 50 temperature, CFIGURE 9 (continued). Comparison of experimental thermal resistivity-temperature curves determined on two batches of foam 2 (HCFC-123) specimens encapsulated at different stages of aging: (a) after 10/11 days, (b) after 20 days, and (c) after 25 days.
further affect the interaction of gas and the polymer and affect the cell-gas composition. While we may not understand these mechanisms in a detailed manner, we should recognize their influence on long-term thermal performance f the foam.
For an idealized spray polyurethane foam (polymer with no capability of absorbing or dissolving blowing agent) , immediately after the foaming the blowing agent partial pressure ranges between 0.65 and 0.70 atm 14,5]. The specific polymeric composition used for Base 88 material resulted in a drop in the sh rt-tcrm CFC- 11 partial pressure to approximately 0.53 atmO-sphere
Pl.
a level close to that previously reported for polyurethane boards [7] .The CFC-11 pressure determined on the encapsulated specimens of the same material aged for one year were found to be much lower. While small differences between four tested specimens and two methods of evaluation were observed, the blowing agent partial pressure, ranging from 0.42 to 0.46 atmosphere, was much lower than expected . It appears that the long-term solubility of the blowing agent may differ from that obtained under short-term experiments on the same foamed cellular plastic.
1:11'" u1 ' ' " " 111111 1<'111)"'''11111< '"' hMセ@ <1111<' •U Q\QLセQ\Q@ J'oiyllll'lll<lll<' J·oa111 L.lJJ
the sntdicd foam, HCF contribution to its thermal resistance is only one half of rhe theoretically possible maximum contribution. This finding justi-ftes a rev ision of the many assumptions currently used both in the academic and the industrial rc carch on blowing agents to replace the CFCs.
Research Recommendations
One should observe a significant contribution of solubility to the effective diffusion coefficient of the blowing agent. The measurements of HCFC diffusion which do not take into consideration changes in the blowing agent solubility may result in signifiCant errors. Moreover, since the blowing agent solubility is such an important factor in the th rmal performance of the foam, one must also examine how the blowing agent solubility is affected by the environment in which the foamed insulation performs-for instance the interaction between polymer and cell-gas may differ in various environ-ments. Furthermore, the ability of the polymer matrix to retain the blowing agent may change and hence alter the gas diffusion characteristics.
The fact that for the studied material only a half of the HCFC initially helping to achieve high thermal performance continues to contribute to this end after one year period, indicates an urgency in the development of ex-perimental techniques for predicting long-term field performance of the foams. First of all, one must be able to measure long-term performance of the foam under laboratory as well as various environmental and service con-ditions. Secondly, one must develop some predictive techniques which shorten the time necessary to evaluate a given polymeric foam. Then, one may consider means to reduce the actual solubility of the blowing agent in the polymer matrix. In effect, such methodology would create a significant potential for improving thermal performance of the foams.
Such a methodology is being attempted in the collaborative research proj-ect between the Institute for Research in Construction of the National Research Council of Canada and DuPont Canada Inc. While this project is still in progress (e.g., environmental effects will first be addressed in the next stage), one may already see how the methodology of non-destructive testing on the material expo cd t vati o us conditions may be useful to evaluate per-formance of c mmcrcial polymer which may lead to significant improve-ments in I ng-term pt:rforman<.T of foams produced with alternative blow-ing agents.
ACKNOWLEDGEMENTS
The authors gratefully acknowledge the support from DuPont Canada Inc. for this work. They are indebted to Mrs. Nicole Normandin for carry-ing out the measurements reported in this work.
L.lJlJ lVI. I. lJUIVIULI\UI lVI. 1\, 1\UIYII\1\t\1'11 lVI . I\. Q|NaNNNvuviiエ |iセu@ I\. \....1, jilセlNjili |@
REFERENCES
1. Kumaran, M. K., M. T. Bamberg, R. G. Marchand, M. R. Ascough and
J.
A. Creazzo. 1989. "A Method for Evaluating the Effect of Blowing Agent Conden-sation on Sprayed Polyurethane Foams;' CFC, SPI, 2:84-91.2. Bamberg," M. 1988. "A Model of Aging of Gas-Filled Foams;'). rifCellu/ar
Plas-tics, 24 :327-347.
3. Bamberg, M. and M. K. Kumaran. 1989. "Report on Sprayed Polyurethane Foam with Alternative Blowing Agents;' CFC, SPI, 2:112-129.
4. Ascough, M. R. 1989. "Determination ofBiowing Agent Concentration in Cel-lular Plastics," Int. Workshop on Long-Term Thermal Performance of CelCel-lular Plastics, Proceedings, SPI Canada.
5. Bamberg, M. and D. A. Brandreth. 1987. "Evaluation of Long-Term Thermal Resistance of Gas-Filled Foams: State-of-the-Art;' ASTM STP 1030, (Thermal Insulation Conference, Florida), pp. 156-173.
6. Kumaran, M. K. and M . T. Bomb erg. 1990. "Thermal Performance of Sprayed Polyurethane Foam Insulation with Alternative Blowing Agents;' Journal
,y·
Thermal l11Sulatiorl, in press.
7. Wiederman, R. E., N. Adam and R. Kaufung. "Flame Retarded, Rigid PUR Foams with Low Thermal Conductivity;'
J.
Thermalllmilatio11, 11:242-253.8. Ostrogorsky, A. G. and L. R. Glicksman. 1986. "Aging ofPolyurethane Foams, the Influence of Gas Diffusion on Thermal Conductivity;' ORNL Report 84-9009/2.
9. Brehm, T. R. and L. R. Glicksman. 1989. "A New Sorption Technique for Rapid Measurement of Gas Diffusion and Solubility in Closed-Cell Foam Insulation;·
CFC, SPI, 2:3-8.
10. Schwartz, N. V., M. T. Bamberg and M. K. Kumaran . 1989. "Measurements of the Rate of Gas-Diffusion in Rigid Cellular Plastics;'
J.
of Thermal lns11latioll,13:49-61.
11. Schuetz, M. A. and L. R. Glicksman. 1983. "Basic Study of Heat Transfer Through Foam Insulation;· 6th 1111. Polpm·tlwlll' Co11jrrmce, Sa11 dィセヲ_oL@ CA, pp.
341-347.
BIOGRAPHIES
Mark T. Bornberg
Mark Bamberg is a Senior Research Officer at IRC. He obtained an M.Sc. in Civil Engineering and a D.Sc. at the Warsaw Institute of Technology, Poland. Between 1967 and 1975, he worked at the Division of Building Technology, Lund Institute of Technology, Sweden, where he received a Doctor ofTechnology degree. He joined NRC in 1975. His current respon-sibility includes assistance to industry and standard writing organizations to
develop test methods for evaluating performance of construction materials and systems. He is a member of ASTM Committees C-16 on Thermal In-sulation and E-6 on Performance of Building Constructions.
- • , J,\;111 1 , 1} o//( /l ,.o dt I t•tll/1 _,\.J 1
Michael R. Ascough
Mike Ascough is a Senior Technical Consultant with DuPont Canada Inc., located in Mississauga, with responsibility for new product development and technical programs related to alternative fluorocarbon blowing agents. A graduate of the Royal Institute of Chemistry, England, he joined DuPont Canada in 1969 and has held a variety of technical and supervisory assign-ments in Research and Development and Technical Service functions .
Mavinkal K. Kumaran
Kumar Kumaran is a Senior Research Officer at the Institute for Research in Construction, National Research Council Canada. He is responsible for the Thermal Insulation Laboratory at IRC. He received his B.Sc. and M .Sc. in Chemistry from Kerala University, India and Ph .D. in Chemical Thermo-dynamics from University College London, England, in 1976. He joined NRC in 1981.
Robert G. Sylvester
A B.Sc. Chemical E ngineering graduate of Queen's University at Kings-ton, Ontario, Rob received his M.B.A. from York University (Toronto) in 1986. Since joining uPo nt Canada in 1979, he has held a variety of manu-facturing, sales, and technical-service-related assignments. He is currently a Senior Technical Representative in DuPont Canada's Fluorocarbon Products Group, Mississauga, Ontario, and is responsible for alternate fluorocarbon blowing agent development and customer support.