Publisher’s version / Version de l'éditeur:
Canadian Journal of Civil Engineering, 19, pp. 987-991, 1992-12
READ THESE TERMS AND CONDITIONS CAREFULLY BEFORE USING THIS WEBSITE. https://nrc-publications.canada.ca/eng/copyright
Vous avez des questions? Nous pouvons vous aider. Pour communiquer directement avec un auteur, consultez la première page de la revue dans laquelle son article a été publié afin de trouver ses coordonnées. Si vous n’arrivez pas à les repérer, communiquez avec nous à [email protected].
Questions? Contact the NRC Publications Archive team at
[email protected]. If you wish to email the authors directly, please see the first page of the publication for their contact information.
NRC Publications Archive
Archives des publications du CNRC
This publication could be one of several versions: author’s original, accepted manuscript or the publisher’s version. / La version de cette publication peut être l’une des suivantes : la version prépublication de l’auteur, la version acceptée du manuscrit ou la version de l’éditeur.
Access and use of this website and the material on it are subject to the Terms and Conditions set forth at
Canadian highway bridge evaluation: reliability index
Allen, D. E.
https://publications-cnrc.canada.ca/fra/droits
L’accès à ce site Web et l’utilisation de son contenu sont assujettis aux conditions présentées dans le site LISEZ CES CONDITIONS ATTENTIVEMENT AVANT D’UTILISER CE SITE WEB.
NRC Publications Record / Notice d'Archives des publications de CNRC:
https://nrc-publications.canada.ca/eng/view/object/?id=4255ec12-b54f-48d6-a455-cff35aa8b92d https://publications-cnrc.canada.ca/fra/voir/objet/?id=4255ec12-b54f-48d6-a455-cff35aa8b92dCa na dia n highw a y bridge e va lua t ion: re lia bilit y inde x
N R C C - 3 5 2 2 0
A l l e n , D . E .
D e c e m b e r 1 9 9 2
A version of this document is published in / Une version de ce document se trouve dans:
Canadian Journal of Civil Engineering, 19, pp. 987-991, December-92
http://www.nrc-cnrc.gc.ca/irc
The material in this document is covered by the provisions of the Copyright Act, by Canadian laws, policies, regulations and international agreements. Such provisions serve to identify the information source and, in specific instances, to prohibit reproduction of materials without written permission. For more information visit http://laws.justice.gc.ca/en/showtdm/cs/C-42
Les renseignements dans ce document sont protégés par la Loi sur le droit d'auteur, par les lois, les politiques et les règlements du Canada et des accords internationaux. Ces dispositions permettent d'identifier la source de l'information et, dans certains cas, d'interdire la copie de documents sans permission écrite. Pour obtenir de plus amples renseignements : http://lois.justice.gc.ca/fr/showtdm/cs/C-42
987
Canadian highway bridge evaluation: reliability index
D. E. ALLENInstitute for Research in Construction, National Research Council Canada, Ottawa, Ont., Canada KIA OR6
Received September 3, 1991 Revised manuscript accepted May 14, 1992
So that the limited funds available for bridge upgrading can be spent in the most effective manner, the reliability index as umed for evaluation of existing bridges requires
a:
closer definition than that assumed for the design of new bridges. A reliability index which varies between 2.0 and 3.75 is determined for bridge evaluation in Clause 12 of CAN/CSA-S6-Ss ·on the basis for life--safety considerations and ca.libralion to experience. The reliability index is chosen by the evaluator as a function of structural behaviour, level of inspection and evaluation ,' and traffic situation for whjch the evaluation is made, all of which affect life safety. Economic considerations are also taken into account; the highway authority may, however, wish to increase the values of the reliability index for critical bridges whose failure seriously affects the traffic network.Key words: bridge evaluation, reliability index, life safety, economics.
Afin que les sommes allouces
a
!'amelioration des ponts soient depensces d'une maniere efficace, l'indice de fiabilite pris en consideration dans !'evaluation des ponts existants necessite une meilleure precision que celui utilise dans Ia conception des nouveaux ponts . Un indice de fiabilire variallt entre 2,0 et 3,75 a ete determine pour )' evaluation des pontsa
l'alinea 12 de Ia norme CAN/CSA-S6-88 en tenant compte de considerations relativesa
Ia securitc eta l'ctalonnage selon ('exper ience. L'indice de fi abilite est choisi par l'evaluateur cornme etant une fonction du comportement de Ia structure, du niveau d'inspcction et d'evaluation ainsi que du type de circulation, tous des elements qui innuent sur Ia securite. On a egalement tenu compte de considerations economiques; cependant, il est possible d'accroitre les valeurs de l'indicc de fiabilite dans Jes cas oil Ia defaillance des ponts aurait un impact majeur sur le reseau routier.Mots ctes : evaluation des ponts, indice de fiabilite, securite, economique.
Can. J. Civ . Eng. 19, 987-991 (1992)
1. Introduction
Increased truck loads combined with deterioration have resulted in the evaluation and upgrading of an increasing number of highway bridges. This activity will continue to grow in the future. A large percentage of existing bridges no longer satisfy current design standards, but the funds available to upgrade them are limited. This puts strong economic pressure to determine fully, without compromising human safety, both the capacity and life of bridges.
Current bridge design safety factors (CSA 1988; OMTC 1983) are based on a criterion of structural safety. The mea-sure used for structural safety is the probability of failure or reliability index. The reliability index, {3, used to deter-mine design safety factors for the ultimate limit states is gen-erally 3.5, based on a 50-year reference period. (An excep-tjon to this is steel connectors which is discussed later.) This basic criterion results in the same design safety factors for all bridge components irrespective of the different conse-quences of failure for different components. Epidemiological evidence as to the high safety level of current design re.quire-ments is the lack of bridge failures in recent years arising from inadequacy of the requirements. The use of a single safety criterion of {3
=
3.5 for bridge design is, however, economical because the marginal difference in cost for failure situations where the criterion could be reduced is small. For evaluation, however, even a small difference in the criterion can result in a major cost for bridge repairs.The Canadian standard for highway bridges (CSA 1988) has recently revised Clause 12 on bridge evaluation (CSA
NoTE: Written discussion of this paper is welcomed and will be received by the Editor until April 30, 1993 (address inside front cover).
Printed in Canada I lmprime au Canada
[Traduit par Ia redaction]
1990) making use of a reliability index which depends on the type of element failure, system behaviour (redundancy), inspection and evaluation, and the category of traffic. The reHability index, summarized in Table I, is based on a life-safety criterion. This paper provides the background for choosing the reliability index. in Table I.
2. Life-safety criterion
The probability of death or injury due to structural failure is equal t.o the probability of structural failure times the probability of death or injury given that the failure occurs. For designs based on a probability of structural failure, the latter probability is conservatively assumed to e.qual 1.0. Ex.perience shows, however, that some failures are much less likely to result in death or injury than others. For example, the uplift failure of a house floor in a tornado is likely to result in death or injury to the occupant, whereas the uplift failure of the roof is very unJikely to result in death or injury. To take into account the life-safety aspects of structural fail-ure, the following criterion (CSA 1981) was adopted for the determination of a reliability index for bridge evaluation:
AK
[1] Prs
=
-w.Jn
where Pr5 is the target annual probability of failure based on life-safety consequences (this is a notional probability of failure (as opposed to a measured one) used to determine the reliability index; the relationship between the two is given in Table 2); K is a constant based on calibration to existing experience which is known to provide satisfatory life safety;
A is the activity factor which reflects the risk to human life associated with activities for which the structure is used; W
988 CAN. J. CIV. ENG. VOL. 19, 1992
TABLE 1. Reliability index, {3, for bridge evaluation {J = 3.5 - [..1E
+
..1s+
..11+
..1pc] 2: 2.0where {3 is based on a 1-year time interval for all traffic categories except for permit controlled and supervised vehicles (PC), where {3 is based on a single passage.
Adjustment for element behaviour
Sudden loss of capacity with little or no warning Sudden failure with little or no warning but retention
,.1E 0.0 of post-failure capacity
Gradual failure with probable warning
Adjustment for system behaviour
Element failure leads to total collapse
0.25
0.5
Element failure probably does not lead to total collapse Element failure leads to local failure only
..1s 0.0 0.25
0.5
Adjustment for inspection level
Component not inspectable Component regularly inspected
Critical component inspected by evaluator
..1, -0.25
0.0 0.25*
Adjustment for traffic category
All traffic categories except PC Traffic category PC - permit
Ape 0.0 controlled and supervised passage of vehicle (PC) 0.6
•o.o
if element fails with sudden loss of capacity with little or no warning, i.e., if AE - 0.0. given failure or recognition of approaching failure, a personat risk will be killed or seriously injured ( W = 1.0 if warn-ing is unlikely); and .Jn is the importance factor based on the number of people,
n,
at risk if failure occurs (this is essentially an aversion factor that takes into account the pro-portionately greater public concern for hazards that may result in many fatalities as opposed to those that can result only in a few).In accordance with CSA 8408-1981, the activity factor, A, is taken equal to 1.0 for buildings of normal human occupancy. Highway bridges are associated with activities of much greater risk (see Table 3 - automobile) than are normal buildings. Also, people spend relatively little time on bridges as compared to inside buildings. Therefore a higher value of A can be used for bridges than for build-ings. However, because bridges are used by the general public, the value of A should not be as high as for offshore structures or for structures under construction, for which CSA S408 recommends a value of 10. A value of A equal to 3 is therefore assumed for passage of normal traffic.
For the importance factor,
.Jn, the number of people at
risk, n, if a bridge collapses is equal to the number of people on the bridge when it collapses plus the number of people who drive into the gap after it collapses. The latter depends on the traffic and visual circumstances such as the weather, time of day, lighting and geometry of approach. For normal bridges on heavily used highways under normal traffic and visual conditions, n is assumed equal to 10.With these values for A and
n,
[1] reduces to Prs Kl W. A base annual failure probability of K is obtained for the case where there is no warning of collapse, i.e.,W = 1.0. This is not a measured (actuarial) probability-it is notional probabilprobability-ity for the application of reliabilprobability-ity theory to set load and resistance factors. An acceptable value of K can therefore only be determined by applying reliability theory to existing design criteria and selecting a target value based on experience (epidemiological evidence) with past use of the criteria.
3. Calibration to existing design practice
The design criteria in CSA-S6-88 are based on a reliability index of 3.5 for a reference period of 50 years, whereas Clause 12 is based on a reliability index for a reference period of I year. This period was chosen as a more suitable one for bridge evaluation. For bridge elements governed by Clause 12 criteria, the reliability index for 1 year, corre-sponding to a reliability index of 3.5 for 50 years, is deter-mined in Appendix A to be between 3.5 for elements carry-ing dead load only and 4.0 for elements carrycarry-ing traffic load only. From Table 2, this corresponds to a base notional fail-ure probability, K, of approximately 10-4 per year. This level of safety has been used in bridge design for many years and has been associated with a satisfactory fatality rate for bridge users (construction fatalities excluded) of the order of 10 -7 per year (Table 3). Moreover, most, if not all, bridge collapses within the past 50 years can be attributed entirely to causes other than design criteria, such as human error or accidents. Thus the measured failure probability related to CSA-S6 design criteria is much less than the notional one, 10 -4
• The reasons for this are discussed in Allen (1968).
On the basis of these considerations, a base value of reliability index of 3.5 corresponding to a target annual fail-ure probability, K, of 2._3 x 10-4 was adopted for evalua-tion of components that are inspectable. This takes into account the fact that regular inspection programs and years of satisfactory performance have identified and corrected design and construction errors, thereby drastically reducing a principal cause of most failures. In the case where the spe-cific component is not inspectable, the base reliability index is taken as 3.75, which approximates that used for the initial design.
4. Adjustment for structural behaviour
Table 1 provides a reduction in the reliability index rang-ing from 0.0 to 1.0, dependrang-ing on the behaviour of the
ele-ALLEN 989
TABLE 2. Notional failure probability vs. reliability index (from normal
probability curve) Notional failure probability Pr 10-1
w-2
w-J
w-4
w-s
lO -6w-s
Reliability index (3 1.23 2.33 3.09 ·3.71 4.26 4.75 5.61ment and on the behaviour of the structural system given failure of the element. If an element, such as a girder in a multi girder bridge, fails without collapse because of alterna-rjye 11 hs of support (redundancy), then the risk to life is con • crably reduced. lf an element fails gradually, for exa1 ·le, by yielding, then the failure is likely to be noticed bef • collapse takes place, allowing time to avoi.d serious co1 セ ア オ・ョ」・ウN@ Such a grad ual failure also allows redistribu-tiol •) f the loads without large impact forces, and this helps to revent progressive coJiapse. In summary, structural bel viour affects the warning factor, W, in [1). i.e. , the pr ability that failure will result in life-threatening conse-qu tce , by either avoiding serious collapse or by providing clu , of approaching coiJapse in time to avoid serious con. equences.
-or a typical case of an element without alternate paths of su pporL, the reliability index from Table I is 3.0 for gradual failure with warning of failure probable and 3.5 for sudden failure with little or no warning. This corresponds reasonably closely to a similar assumption by Mirza and MacGregor (1982) based on calibration to existing design criteria for reinforced concrete building structures, where a reliability index of 3.0 based on a 30-year reference period was used for failure due to yielding of teel compared to 3.5 for failure in shear or compression of concrete. The decrease in reliability index from 3.5 to 3.0 corresponds to a 6-fold increase in notional probability of failure or, con-versely, a warning factor of I /6. Available information on steel connectors (Fisher
eta/.
1978; Gagnon and Kennedy 1989) shows that the present design criteria for buildings cor-respond to reliability indices of 4.5 for welds and 5.5 for bolts as compared to 3.0 for member failure. The criteria for bridges are similar. These differences in the reliability index correspond to large reductions of the notional failure probability of l/400and 1/700 OOOfor connectors as com-pared to members. Such reductions cannot be meaningfully related to life safety through the warning factol". For economic reasons related to evaluation, it is not reasonable to require a large increase in safety level beyond that required for other sudden failures such as shear and compression in concrete. Therefore steel connectors are not treated dif-ferently from other brittle components in Clause 12.The maximum reduction in the reliability index for system behaviour when element failure leads to local failure only is also set at 0.5, corresponding to a warning factor of approximately 116. When the element failure is gradual with probable warning and there are alternate paths of support
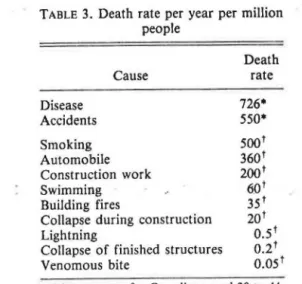
TABLE 3. Death rate per year per million people Cause Disease Accidents Smoking Automobile Construction work Swimming Building fires
Collapse during construction Lightning
Collapse of finished structures Venomous bite Death rate 726* 550*
soot
360t 200t6ot
35t 20to.st
0.2to.ost
•Average rate for Canadians aged 20 to 44. tprojected rate.if loss of resistance occurs, the total reduction in the reliabil-ity index is 0.5
+
0.5 = 1.0. For a typical application, the reliability index is reduced from 3.5 to 2.5, which corre-sponds to a warning factor of approximately 1/30. This reduction cannot be related to current design criteria because they do not take into account system behaviour. An analysis of current AASHTO criteria for bridge evaluation by Moses and Verma (1987), however, indicates that the reliability index is 3.5 for non-redundant structures and 2.5 for redun-dant structures. For this analysis, Moses and Verma (1987) assume that element behaviour is not a factor; although not stated, the reference period is approximately 2 years.The adjustments of the reliability index for structural behaviour are therefore in general agreement with existing practice, with the exception that, for evaluation, the excess safety for steel connectors as compared to other brittle failures used for design has been removed.
5. Adjustment for inspection and evaluation Clause 12 is valid only for bridges subjected to regular inspection by qualified inspectors when the results of inspec-tions are recorded and made available to the evaluators. The inspection includes an examination of all physical features of the bridge that affect its structural integrity, comparison of the structure with the drawings, identification of damaged or deteriorated sections, and collection of sufficient data to identify changes in condition and the reasons for their occurrence.
Experience shows that avoidance of bridge failures and inspection are closely related. The better and more systematic the inspection, the more likely it is that damaged compo-nents will be identified and evaluated and steps taken to avoid failure with life-threatening consequences. The com-ponents are inspected for fatigue damage, corrosion, and, also, local failures. Of course, the components must be inspectable.
The base value of the reliability index assumes a regular inspection of the bridge; if the component is uninspectable, the reliability index in Table 1 is increased by 0.25. Where inspection of a critical or substandard component has been carried out by the evaluator and such components are inspected at all subsequent routine inspections, the proba-bility of detecting defects before failure results is increased. Therefore a reduction in reliability index of 0.25, which
cor-990 CAN. J. CIV. ENG. VOL. 19, 1992
responds to a decrease in warning factor by approximately 500Jo compared to regular inspection, is applied in Table 1. This reduction, however, is not applied if the element would fail without warning and with sudden loss of capacity.
In summary, inspection affects the warning factor, W,
in [1] by providing clues of approaching or potential failure in time to avoid serious consequences.
6. Adjustment for traffic category
The base reliability index of 3.5 in Table 1 has been derived for normal bridges on heavily used highways under normal non-permit traffic (NP) and visual conditions, but applies also to mixed traffic containing permit vehicles, both single vehicle (PS) and multiple vehicles (PM). It could be argued that an adjustment might be applied for lightly used bridges on secondary routes or for very long span bridges carrying heavy traffic by application of the importance
fac-tor
..fiz.
In the first case, however, the decrease in thereliability index that would result is offset because load limits are usually not as well enforced on secondary roads. The second case of long span bridges is outside the present scope of CSA-S6, although the methodology presented here could be applied.
The only adjustment in the reliability index for traffic cat-egory is for a single-permit controlled and supervised vehicle (PC) when no other traffic is allowed on the bridge. In this case, the only person at risk is the driver of the PC vehicle and n = 1. Under such circumstances, the activity factor,
A, in [1] may be increased from 3 to 10, as is the case for offshore structures and structures under construction. These two changes would result in a 10-fold increase in the target annual failure probability or a reduction in the reliability index of approximately 0. 7. This reduction relates to a ref-erence period of 1 year, whereas the reliability index for PC traffic category relates to single events. Such events are rare, however, of the order of 1 per year. Based on these con-siderations, a reduction in {3 of 0.5 is assumed for the PC traffic category in Table 1.
7. Economic considerations
The first edition of Clause 12 in CSA-S6-1980, a leading effort in developing a rational approach for determining bridge evaluation criteria, adopted a reliability index that ranged from 1.0 to 5.0, depending on structural behaviour and the category of traffic, with values below 2.0 being used for controlled supervised permit vehicle. However, the upper limit resulted in safety factors more severe than the design safety factors, and the lower limit, corresponding to a notional failure probability of 1 in 6, placed considerable economic risk on the traffic network for the passage of a single vehicle over the bridge and higher risk to the truck driver.
Table 1 adopts a reliability index ranging from 1.75 to 3. 75 based on the application of the life-safety criterion [1] as well as calibration to existing experience. Economic con-siderations, not only related to the repair of a damaged bridge but also to the economic effect when a bridge in the traffic network is out of commission, should also be taken into account. The former is taken into account in Table 1 by specifying a minimum reliability index of 2.0, correspond-ing to a notional failure probability of 1 in 44. This mini-mum governs only for elements that are essentially fail-safe during a single passage of a controlled vehicle.
While many traffic networks may be flexible enough to accommodate without difficulty a bridge temporarily out of use, the case when a bridge failure results in a serious difficulty with the traffic network may require higher values of the reliability index than are given in Clause 12. The high-way authority should determine the appropriate values of the reliability index to be used based on such considerations as the effect of a failure on the traffic network and the ability to repair the bridge element while maintaining the traffic network.
Economic considerations also limit a maximum value of the reliability index. If the upper limit, {3
=
3.75, is increased, then, with the exception of steel connectors, the evaluation criterion becomes more conservative than the design criterion. Failure experience shows that this cannot be economically justified.8. Application of the reliability index to Clause 12 The reliability index specified in Table 1 is used by Kennedy eta/. (1992) as a basis for determining the load
and resistance factors contained in Clause 12 CSA Standard S6-1990. These factors were determined using the lognormal reliability model,
[2]
R
=s
exp((3..J
カセ@+
vp
where R is the element resistance; S, the load effect on the element; V, the coefficient of variation; and the bars denote mean values .
Equation [2] can also be used directly to evaluate bridge elements without the application of load and resistance fac-tors. Such a direct method is contained in the Commentary to Clause 12. The method makes direct use of the statistical assumptions of all loads and resistances, also contained in the Commentary. An example of the use of this method is given by Bartlett et a/. (1992).
9. Summary
A reliability index for use in bridge evaluation for traffic load has been determined on the basis of life-safety con-siderations and calibrated to experience in the design and evaluation of bridges. The values of the reliability index take into account the risk to life safety as affected by the behav-iour of bridge elements, the behavbehav-iour of the structural sys-tem (redundancy), the level of inspection and evaluation, and control of traffic over the bridge during passage of con-trolled and supervised vehicles. Economic considerations have also been taken into account; however, a highway authority may wish to increase the values of the reliability index for critical bridges whose failure seriously affects_ the traffic network.
Acknowledgements
Funding for the research that led to the 1990 version of Clause 12 was supplied by Saskatchewan Highways and Transportation under the direction of Lome· J. Hamblin, Director of Bridge Engineering. Participants in the research and subsequent preparation of Clause 12 are identified by Buckland and Bartlett (1992).
Discussions with members of the research team were most helpful to the author in developing the reliability index described in this paper.
ALLEN 991 Allen, D.E. 1968. Discussion of "Choice of failure probabilities"
by C.J. Turkstra . ASCE Journal of the Structural Division, 94(ST9): 2169-2173.
Bartlett, F.M., Buckland, P.O., and Kennedy, D.J.L. Canadian highway bridge evaluation: derivation of Clause 12 of CAN/ CSA-S6-88. Canadian Journal of Civil Engineering, 19(6): this issue.
Buckland, P.O., and Bartlett, F.M. 1992. Canadian highway bridge evaluation: a general overview of Clause 12 of CSA Standard CAN/CSA-S6-88. Canadian Journal of Civil Engineering, 19(6): this issue.
CSA. 1980. Supplement No. l-1'980 (Clause 12- existing bridge evaluation) to CSA Standard CAN3-S6-M78 (design of highway bridges). Canadian Standards Association, Rexdale, Ont. CSA. 1981. Guidelines for the development of limit states design.
CSA Special Publication S408-1981 , Canadian Standards Asso-ri1ltion, Rexdale, Ont.
C' \. 1988. Design of highway bridges. CAN/ CSA-S6-88, Cana-,tn Standards Associations , Rexdale, Ont .
... 1990. Supplement No. 1-1990 (Clause 12 - existing bridge ;al uation) to CSA Standard CAN/CSA-S6-88 (design of
high-ay bridges). Canadian Standards Association, Rexdale, Ont. er, J .W., Galam bos, T .V., Kulak, G.L., and Ravindra, M.K. J78. Load and resistance factor design criteria for connectors. .SCE Journal of the Structural Division, 104(ST9): 1427-1442. G:o c:non, D.P ., and Kennedy, D.J.L. 1989. Behaviour and ultimate tensile strength of partial joint penetration groove welds . Canadian Journal of Civil Engineering, 16(3): 384-399. Kennedy, D.J .L., Gagnon, D.P., Allen, D.E., and MacGregor, J.G.
1992. Highway bridge evaluation: load and resistance factors. Canadian Journal of Civil Engineering, 19(6): this issue. Mirza, S.A., and MacGregor, J.G. 1982. Probabilistic study of
strength of reinforced concrete members. Canadian Journal of Civil Engineering, 9(3): 431-438.
Moses, F., and Verma, V. 1987. Load capacity evaluation of exist-ing bridges . National Cooperative Highway Research Program Report 301, Transportation Research Board, National Research Council, Washington, D.C.
OMTC. 1983 . Ontario highway bridge design code. Ontario Ministry of Transportation and Communications, Downs view, Ont.
Appendix A. Reliability index vs. reference period The reliability index for Clause I2 is for a reference period of I year (corresponding to an annual notional probability of failure), whereas the reliability index of 3.5 used for CSA-S6 design criteria is for a reference period of 50 years. If a failure event in any year is completely uncorrelated with the failure event in any other year, then the reliability index for I year is determined by dividing the notional failure probability corresponding to a reliability index of 3.5 by 50 and determining the corresponding reliability index of 4.43 from a normal probability table in a handbook (e.g., see Table 2). For bridges, this assumption is incorrect because the resistance and the dead load are essentially fully cor-related from year to year (deterioration is not taken into account in determining the reliability index), and only the traffic load varies .
The reliability index for I year can be determined from that for 50 years by the application of the lognormal
reli-ability model used for determining the load and resistance factors for Clause 12, eq. [2]. For elements carrying dead load only, the statistical parameters in eq. [2] are the same for both periods, therefore the reliability index is the same, i.e., 3.5.
Consider the case for elements carrying traffic load only. Maximum truck load statistics used by Kennedy et a/. (1992) for determining the live load factor for normal traffic (NP) is based on a passage of 7796 heavy trucks per year, where truck weights are closely represented in the upper tail of the measured data by a normal curve with an average weight,
H,
of 46.5 t, a standard deviation of 7.92 t, and a coeffi-cient variation, V H• of 0.17. The probability of M trucks randomly chosen from this distribution being less than H is equal to the probability of any truck being less than H raised to the power M. This provides the following relationship:[Al] 1 - PHM
=
(1 - PH)Mwhere PH is the probability of a truck being heavier than
H and PHM is the probability of one in M trucks being heavier than H. Equation [AI] can be used to determine the probability distribution curve of the extreme event, PHM•
from the base curve for heavy trucks, PH. Kennedy et a/.
(1992) applied this procedure to determine the distribution for the maximum truck weight in 1 year, which they repre-sented in the upper tail by a normal distribution with mean H1 = 72.75 t and coefficient of variation VH1 = 0.069. By
a similar application of [AI], the distribution for the maxi-mum truck weight in 50 years (M = 7796
x
50 trucks) can be represented in the upper tail by a normal curve with mean,H
50=
80.34 t and coefficient of variation, VH5o=
0.051.Because of the small coefficients of variation for these extreme events, the normal curve approximates reasonably the lognormal curve assumed by the lognormal reliability model, [2].
For an element subjected only to NP traffic, application of [2) with the 50-year reliability index, {3
=
3.5, results in- - _/ 2 2 2
[A2) R = Hso exp(35v VR
+
VEL+
VH50)where VEL represents the uncertainty in lateral load distri-bution. Typical values of VR and VEL are O.I and 0.09
respectively (see Tables CI2.12 and C12.7 of CSA-S6-1990), which, along with VH5o = 0.051, results in
R
= 1.6546H50 • Equation [2] can be inverted to determine the reliability index for I year equivalent to 3.5 for 50 years:a
=
ln(1.6546H50/R
1)fJ ---,=,;===:::;;:=::::::::===;;= = 4. 0
GMG カ セ@ + カ セl@ + vセ
Q@
[A3]based on the parameter values already determined above. The reliability index of a bridge element subjected to dead plus traffic load corresponding to the 50-year reliability index of 3.5 is therefore between 3.5 and 4.0 for a 1-year reference period.
![TABLE 1. Reliability index, {3, for bridge evaluation {J = 3.5 - [..1E + ..1s + ..11 + ..1pc] 2: 2.0](https://thumb-eu.123doks.com/thumbv2/123doknet/14244561.487339/5.925.205.705.100.480/table-reliability-index-bridge-evaluation-j-e-pc.webp)