Characterization of Rocky Flats and Oak Ridge Glass Containing Mixed Wastes
by
Anthony Lawrence Brinkley
B.S., Mechanical Engineering
Virginia Military Institute, 1992Submitted to the Department of Nuclear Engineering in Partial Fulfillment
of the Requirements for the
Degree of
MASTER OF SCIENCE
in Nuclear Engineeringat the
Massachusetts Institute of Technology June 1994
Massachusetts Institute of Technology 1994 All rights reserved
Signature of Author
Debartment of Nuclear Engineering May 12, 1994
Certified by
Scott A. Simonson
Assistant Professor, Department of Nuclear Engineering
Thesis Supervisor
Certified by
Daniel R. Cohn
Senior Research Scientist
Acting Assistant Director, Plasma Fusion Center
Thesis Reader Accepted byAllan F. Henry
Professor, Department of Nuclear Engineering
Chairman, Departmental Committee on Graduate StudiesScience
Characterization of Rocky Flats and Oak Ridge Glass Containing Mixed Wastes
by
Anthony Lawrence Brinkley
Submitted to the department of Nuclear Engineering on May 6 1994 in partial fulfillment of the requirements for the Degree of Master of Science in
Nuclear Engineering
ABSTRACT
Vitrification of radioactive and RCRA listed hazardous materials is an excellent technology for effectively immobilizing these mixed wastes. In this thesis, mixed waste from Rocky Flats plant sludge and Oak Ridge plant sludge was vitrified for this purpose. In order to understand the factors influencing glass degradation, several experiments were performed on the Rocky Flats vitrified waste: 1 a hot (KOH) fusion determined post-furnace glass compositions; 2 MCC I leach testing defined leach rates and degradation trends; 3 curve fitting detem-iined the degradation mechanism; 4 SEM-EDAX analysis confirmed non-crystalline growth on the most chemically durable batches; and 5) the multivariate analysis statistically determined which variables improved or worsened chemical durability.
This thesis conducted the first MCC I test ever performed on low level radioactive Rocky Flats glass by testing chemical durability in room temperature and 90'C
environments. Glass compositions were analyzed for 3 7 14, 28, 90, and 180 days in an aqueous environment. Non-radioactive glass was tested at room temperature conditions only. Rocky Flats glass was assumed to contain 16 pprn plutonium at 100% waste
loading. This amount of Pu-239 was equivalent to the TRU limit of 100 nCi/grarn.
Thorium was used as a surrogate for plutonium.
Data were fit to diffusion and saturation limit controlled equations to better define
the degradation mechanisms of various Rocky Flats compositions. Results showed that the
most chemically durable glasses followed solubility limit controlled leaching and that the poorest of the glasses followed diffusion controlled leaching at room temperature and 900C tests. It was determined that high melting temperatures (1350'C) and high levels of Fe2O3 (8 wt%) increased chemical durability the greatest. Leach rates of Rocky Flats glass were within one order of magnitude to that of lead-iron-phosphate glass and two orders of magnitude lower than Savannah River borosilicate glass.Thesis Supervisor: Dr. Scott Simonson
Title: Assistant Professor of Nuclear Engineering
Table of Contents
T itle P a g e ...
I
A b stra ct ...
2
T able of C ontents ...
3
L ist of T ab les ...
6
L ist of F igu res ...
7
A ck n ow led gm en ts ...
11
Chapter 1. INTRODUCTION ...
12
1 I T hesis H istory ... 12
1.2
T hesis Sum m ary ...
12
Chapter
2.
BACKGROUND ...
14
2.1 Chapter Summary ...
14
2.2 G lass Properties ... 142.2.1 Network formers ...
15
2.2.2 Interm ediates ...
17
2.2.3 Network modifiers ...
18
2.2.4 SiO2-CaO-Na2O ternary system ...
22
2.3 Leaching Mechanisms and Chemical Durability ... 25
2.3.1 General glass degradation principles ... 26
2.3.2 Classical interdiffusion ...
27
2.3.3 Chemical ion exchange ... 27
2.3.4 W ater transport ...
27
2.3.5
Network hydrolysis mechanisms ...
28
2.3.6
Free energies of hydration ...
28
2.3.7
Solubility effects ...
28
2.3.8 Application of theory to experiments ... 29
2 .4 L each T ests ... 3 1
2.4.1
MCC-IP static leach test ...
31
2.4.2 Toxicity Characteristic Leaching Procedure (TCLP) ... 32
2.4.3 Product Consistency Test (PCT) ...
33
Chapter 3.
EXPERIMENTAL ...
34
3.1 Chapter Summary ...
34
3.2.1 B atch calculations : ... 35
3.2.2
Furnace melting ...
36
3.3 Glass Composition Verification ... 37
3.4 MCCAP Static Leach test method ...
40
3.4.1 Leach container ... 4 1
3.4.2 Test specimen preparation ...
41
3.4.3 Volume measurement and surface area measurement ... 43
3.4.4
Environmental chamber ... 43
3.4.5 Leaching an individual specimen ... 43
3.5 1C P Procedure ... 46
3.6 S E M -E D A X ... 46
Chapter 4. DISCUSSION AND RESULTS ...
5 1
4.1 Chapter Summary ... 5 14.2 Glass Production Summary ...
5 1
4.3
Normalized Release Results ...
52
4.3.1 Melts poured at 12500C ... 53
4.3.2 Melts poured at 13000C ... 55
4.3.3 Melts poured at 13500C ... 55
4.4 Elemental Analysis of Leach Test Results ... 57
4 .5 pH R esults ... 57
4.6 Multivariate Analysis Results ... 58
4.7
SEM-EDAX Analysis ...
60
Chapter 5. CONCLUSIONS AND FUTURE WORK ...
71
5.1 C hapter Sum m ary ... 71
5.2 C onclusions ... 7 1 5.2.1 Melting temperature ... 71
5.2.2 Oxide influence on chemical durability ... 72
5.2.3 pH significance ...
72
5.2.4 Comparison to lead-iron-phosphate and borosilicate glass ... 73
5.3 Future Experimental Work ...
74
5.3.1 Duplication of results ...
74
5.3.2 R adiolysis tests ...
74
5.3.3 Oak Ridge leach tests ... 74
5.3.4 Chemicals used to produce oxides ...
74
5.3.5 Diffusion vs. saturation limit test ...
75
5.3.6 Phase separation tests ...
75
Chapter 6. REFERENCES AND BIBLIOGRAPHY ...
76
Appendix A. VITRIFICATION TECHNOLOGY ...
79
A. I
Chapter
Summary ...
79
A.2 Vitrification Basics in Production ... 79
A.3 Industrial Size Vitrification Plants ... 80
Appendix B. MULTIVARIATE ANALYSIS RESULTS ...
87
Appendix C. SUPPORTING GRAPHS FOR THE MCC-1
LEACH TEST RESULTS ...
90
C .I A ppendix Sum m ary ...
90
Appendix D.
DATA COM PILATION ...
97
Appendix E. SAFETY AND RELATED TOPICS IN GLASS
M A K IN G ...
107
Appendix F. CURVE FIT RESULTS ...
109
F. I
Appendix Summary ...
109
Table Page 3-1 Composition of Rocky Flats and Oak Ridge Glasses 34
4-1
Rocky Flats Glass Composition Summary
61
D-1 Non-Radioactive Rocky Flats Glass Fusion Data Conversion 98
D-2
Th-doped Rocky Flats Glass Fusion Data Conversion
99
D-3 MCC I Leach Test Room Temperature Data Conversion 100D-4 MCC I Leach Test 90'C Data Conversion 103
F-I Room Temperature Diffusion Curve Fit Results 109
F-2 Room Temperature Saturation Limit Curve Fit Results 110
F-3 90'C Diffusion Curve Fit Results ill
F-4
90'C Saturation Limit Curve Fit Results
ill
6
List of Figures
Figure
Page
2-1 Function of important glass oxides. 15
2-2 Schematic representation of (a) ordered crystalline form and (b)
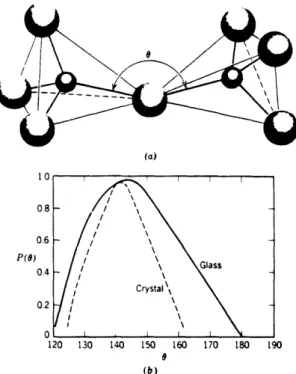
random-network glassy form of the same composition. 16 2-3 (a) Schematic representation of adjacent SiO4 tetrahedra showing
Si-O-Si bond angle. (b) Distribution of Si-O-Si bond angles in
fused silica and crystalline crystobalite. 16
2-4 Ternary phase equilibrium diagram of the system
CaO-B203-SiO2 with isotherms showing temperatures of
complete melting. 17
2-5 Effect of boric oxide on the field of devitrite, Na2O.3CaO.6SiO2
in the Na2O-CaO-SiO2 system. 1 8
2-6 Effect of alumina on the liquidus temperatures of some glasses in
Na2O-CaO-SiO2 system. 18
2-7 Schematic representation of the structure of the sodium silicate
glass. 19
2-8
Binary phase equilibrium diagram of the Na2O-SiO2 system.
20
2-9 Binary phase equilibrium diagram of the CaO-SiO2 system. 21 2-10 Melting point diagram of the binary system Na2O,2SiO2-Na2O, 2CaO, 3 SiO2. 22
2-11 Effect of Magnesia on the liquidus temperature of some glasses
in the system Na2O-CaO-SiO2. 23
2-12 Phase equilibrium diagram of the Na2O-CaO-SiO2 ternary
system. Temperatures are in degrees Celsius. Compositions
are in wt%. Straight lines indicate subsolidus compatibilityjoins.
24
2-13
Rocky Flats Glass Compositions.
25
3-1
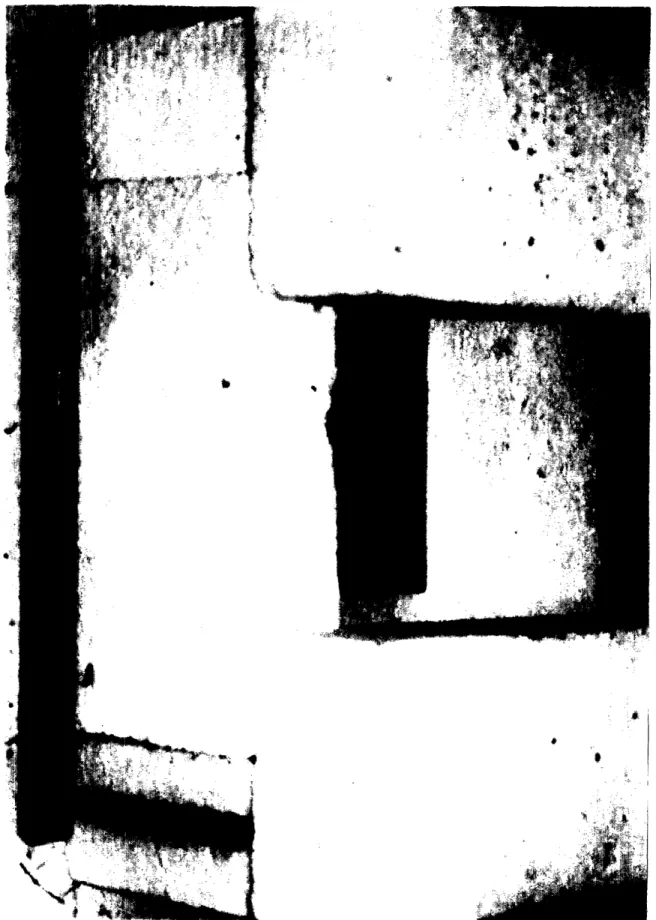
Fire brick housing used in glass pouring and cooling.
37
3-2 Lindberg/Blue M oven in which reagent grade chemicalsare melted into a glass. 38
3-3
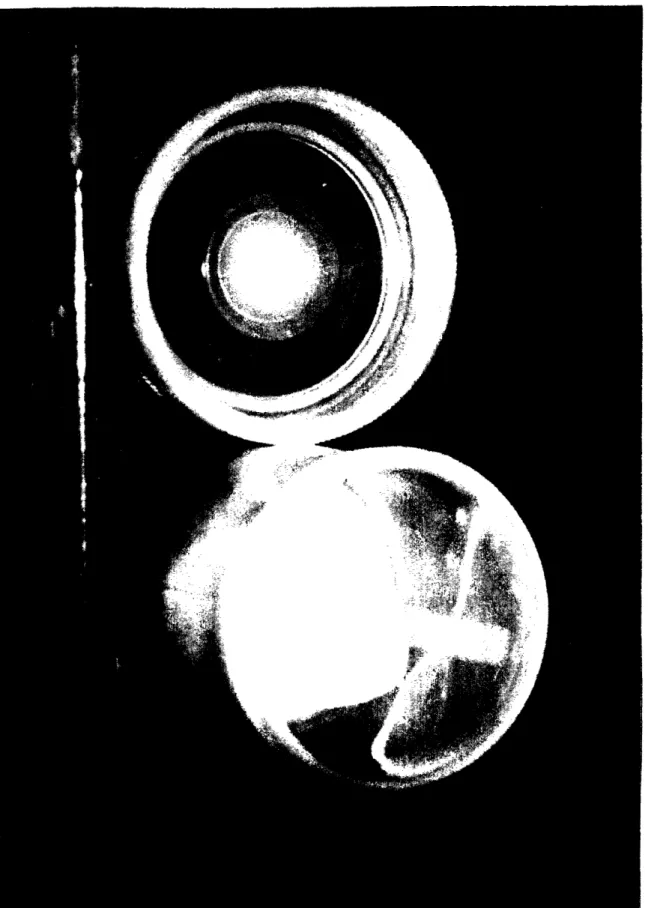
Teflon container with Teflon basket inside.
42
Figure
Pa2e 3-5Cross flow nebulizer (a), Ultrasonic nebulizer (b).
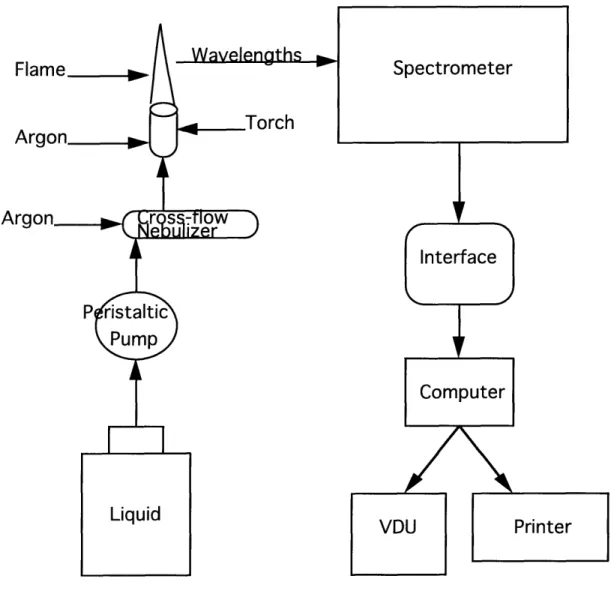
ICP flow chart.
(a) Scanning Electron Microscope (SEM) control panel in center. (b) Vacuumed LN2 cooled tungsten unit and EDAX machine.
47
3-6 48
3-7
50
4-1
Room Temperature, DI Water, MCC- 1,
Leach Results, Sodium.
Room Temperature, DI Water, MCC- 1,
Leach Results, Silicon.
Room Temperature, DI Water, MCC- 1,
Leach Results, Calcium.
Normalized
Normalized
Normalized
624-2
62 4-3 634-4
90'C, DI Water, MCC- 1, Normalized
Leach Results, Sodium.
90'C, DI Water, MCC- 1, Normalized
Leach Results, Silicon.
90'C, DI Water, MCC- 1, Normalized
Leach Results, Calcium.
63 4-5
64
4-6
64 4-7
Room Temperature, DI Water, MCC- 1,
Leach Results, Sodium.
Room Temperature, DI Water, MCC- 1,
Leach Results, Silicon.
Normalized
65
4-8
Normalized
65
90'C, DI Water, MCC- 1, Normalized
Leach Results, Sodium.
90'C, DI Water, MCC- 1, Normalized
Leach Results, Silicon.
Room Temperature, DI Water, MCC- 1, Solubility
Limit of Silicon Vs. Normalized Leach Results.Investigation of Mechanism of Dissolution of Rocky Flats
Sludge Glass 73% waste loading), Batch 58.
Room Temperature, DI Water, MCC- 1, Elemental
Analysis, Batch 29.
Room Temperature, DI Water, MCC- 1, Elemental
Analysis, Batch 61.
4-9
664-10
66 4-11 674-12
67 4-13 684-14
68 8Figure
Page#
4-15
90'C, DI Water, MCC- 1, Elemental
Analysis, Batch 52. 69
4-16
90'C, DI Water, MCC- 1, Elemental
Analysis, Batch 56. 69
4-17
Room Temperature, DI Water, MCC- 1, Normalized
Leach Results, pH.
70
4-18
90'C, DI Water, MCC- 1, Normalized
Leach Results, pH.
70
5-1 30 day corrosion rate at 90'C for Lead-Iron-Phosphate,
Borosilicate, and Rocky Flats glass. 73
A-1 AVM continuous/two stage process. 82
A-2 Savannah River Defense Waste Processing Facility. 83
A-3
Full-size canister cross-section of glass product SM58LWl I
with streaks.
84
A-4 West Valley HLW vitrification plant schematic. 85
A-5
WIP pot process flowsheet.
85
A-6 WVP continuous vitrification process. 86
B-1 Multivariate analysis of 28 day, room temperature,
non-radioactive and Th-doped glass, sodium leach test results.
87
B-2
Multivariate analysis of 90 day, Th-doped glass, room
temperature, sodium leach test results. 88
B-3 Multivariate analysis of 180 day, 90'C, Th-doped glass,
sodium leach test results. 89
C-1
Room Temperature, DI Water, MCC- 1, Normalized Leach
Results, Magnesium.
90
C-2
Room Temperature, DI Water, MCC- 1, Normalized Leach
Results, Potassium.
91
C-3 90'C, DI Water, MCC- 1, Normalized Leach
Results, Potassium.
91
C-4
Room Temperature, DI Water, MCC- 1, Elemental Analysis,
Figure
Pa2eC-5
Room Temperature, DI Water, MCC- 1, Elemental Analysis,
Batch 32: 1300'C 58%. 92
C-6
Room Temperature, DI Water, MCC- 1, Elemental Analysis,
Batch 35: 1250'C 72%. 93
C-7 Room Temperature, DI Water, MCC- 1, Elemental Analysis,
Batch 37: 1350'C 73%. 93
C-8 Room Temperature, DI Water, MCC- 1, Elemental Analysis,
Batch 52: 1350'C 74%. 94
C-9
Room Temperature, DI Water, MCC- 1, Elemental Analysis,
Batch 56: 1250'C 73%. 94
C-10
Room Temperature, DI Water, MCC- 1, Elemental Analysis,
Batch 59: 1350'C 64%. 95
C-11 90'C, DI Water, MCC- 1, Elemental Analysis,
Batch 58: 1350'C 74%. 95
C 12 90'C, DI Water, MCC- 1, Elemental Analysis,
Batch 59: 1350'C 64%. 96
C-13
90'C, DI Water, MCC- 1, Elemental Analysis,
Batch 61: 1350'C 77%. 96
G-1 (a) EDAX point analysis of sharp edge of b. (b) Scanning electron micrograph of batch 37 after annealing and before MCC- 1 leach test initiation showing smooth surface of glass
at 50OX magnification. 112
G-2
(a) EDAX analysis of point source on large chunk of b.
(b) Scanning electron micrograph of batch 61 at 75OXmagnification showing large chunk of glass on smooth surface
after annealing and before MCC- 1 leach test analysis. 113 G-3 (a) EDAX analysis of tears in glass of picture b. (b) Scanning
electron micrograph of batch 37 at 100OX magnification after annealing and before MCC I leach test analysis. Small holes and
tears are present on the otherwise smooth glass surface. 114
ACKNOWLEDGMENTS
I
would like to acknowledge Pacific Northwest Laboratories for giving me the opportunity to fulfill research in one of the most exciting fields today, nuclear waste management, and more specifically, vitrification of mixed nuclear wastes. The person Iowe the most thanks to is my advisor, Scott Simonson, who's sagacity kept the project
focused, interesting, and most of all, fun. Professor Simonson also had faith in my
abilities to complete the numerous tasks set out for this research.I would also like to thank Toni Korzan, Dave Freed, and Mark Sautman of the waste management group, who helped me learn the deep dark secrets of Microsoft word and to Mark for the help on the ICP spectrometer. To Tim Lawrence and Dan Doney I would like to thank you for the many pranks you inspired me to commit. I would like to
thank John Thomas, for purely selfish reasons, for introducing me to Objectivism.
My final gratitude goes to Virginia Military Institute (and the professors there who prepared me for solid, consistent work), the Southern Conference Athletics Committee,
and the U.S. Air Force, who each provided me with a graduate scholarship.
INTRODUCTION
1.1 Thesis History
This thesis was made as a result of cooperation between Pacific Northwest
Laboratories (PNL) and the Nuclear Engineering department at MIT. The purpose of this particular research was to design a glass which immobilized mixed wastes from two radioactive waste sites: Rocky Flats and Oak Ridge. PNL provided the direction of the research and the composition of the wastes to be vitrified. The goal at MIT was to vary the waste loadings of these compositions and then test the chemical durability using the MCC-1P static leach test. This thesis represents the first low level Rocky Flats glass tested by the MCC- I leach test. The facilities at MIT provided a furnace to melt the reagent chemicals into a glass, and room temperature and 90'C environments for leach testing. MIT also provided an 1CP-AES to analyze leachate, and a SEM-EDAX for surface crystalline identification.
1.2 Thesis Summary
This section gives a description of the upcoming chapters in the thesis. There are five chapters in total in the following order: 1) introduction; 2 background; 3)
experimental; 4 discussion and results; 5) conclusions and future work. There are seven appendices which discuss or give results on the following subjects: a) vitrification
technology; b) multivariate analysis; c) graphs; d) data compilation; e) safety, f) RS/1 curve
fitting results, and g) SEM-EDAX results.
The Background chapter gives an overview of literature relative to the work done
on this thesis. The basics of glass properties are discussed using binary and ternary
diagrams to study the effects of certain glass making oxides. Liquidus temperature is emphasized along with oxide percentages for each Rocky Flats glass composition.Following the discussion on glass properties, the basic leaching mechanisms of glass are presented in a manner that will facilitate the explanation of Rocky Flats glass leach rates. A discussion on some of the different leach tests available is given and reasons are given for preferring one leach test over another.
Following the Background chapter, the Experimental chapter looks at the
procedures followed in order to produce the data for this thesis. The first step in creating glass was the batch calculation process and furnace melting. Next, the Experimental chapter shows how the glass composition was verified by using a fusion technique while
2
leach tests were performed on the glass samples. The final part of this chapter discusses techniques used in the inductively coupled plasma spectrometer (ICP) and SEM-EDAX
analysis.
The Discussion and Results chapter is separated into five main parts. The first section discusses the glass compositions and issues and trends that were observed. The second section determines why leach rates existed as they did by using the Background chapter information. Two of the best glasses were analyzed using the scanning electron microscope (SEM) and energy dispersive auger x-ray analyzer (EDAX) before leaching and a section is devoted to these observations. The final section used the results from the multivariate analysis to reinforce past knowledge on glass oxide effects and attempts to explain any discrepancies found in these results.
This first part of the Conclusions and Future Work chapter discusses the main points of the previous chapter and draws the main conclusions of the thesis. The second part of this chapter looks at the possibility of any future work which may aid in better defining Rocky Flats glass and any other glass which may undergo similar tests.
Appendix A discusses the vitrification technology of the past and present relevant to the Rocky Flats glass compositions. A description of several vitrification plants is given and the difference in each of them discussed.
Appendix presents the data from the multivariate analysis which were used to reinforce past knowledge on glass oxides and other information important to glass durability. The graphs which were not shown in the results chapter, and any graphs relative to the thesis but not otherwised referenced are displayed in Appendix C.
Appendix. D shows how the data was manipulated for fusion results and leach test results. Appendix E was made specifically for students at MIT continuing work in the
glass area. In it, a description of safety procedures for working with glass, furnaces, and
acid baths are given. Curve fit values of T F and R2 generated by RS/ 1, are presented inAppendix F. Appendix G shows micrographs and the resulting EDAX charts for two of
the best glass compositions, batch 37 and 61.
Chapter 2
BACKGROUND
2.1 Chapter Summary
Wastes that contain both radioactive and RCRA listed hazardous wastes are known as mixed wastes. These wastes are being considered for vitrification in order to effectively immobilize the waste for a long period of time and/or eliminate the toxic component. This, incidentally, may reduce the volume of waste by orders of magnitude. In doing so, a
vitrified waste, i.e. glass, is produced that when optimized by methods such as those
presented in this study will produce a superior waste form for a repository or for potentialunrestricted release.
This chapter discusses the basic characteristics of Rocky Flats and Oak Ridge mixed waste glass investigated in this thesis. The main constituents of glass, silicon, sodium, calcium, and other elements are discussed relative to their properties and effects on glass. The two types of glass made were tailored to incorporate waste compositions from Rocky Flats plant sludge and Oak Ridge plant sludge. Rocky Flats wastes were generated
from the reprocessing of americium out of plutonium-239 weapons. The effects of the
major oxides in these glasses are discussed in this chapter. Following this analysis is adescription and history of the different theories of glass dissolution. The dissolution of
glass may be measured with many different tests and the following three types of tests eachhaveaspecificpurposewhichwillbediscussed: theMCC-IPStaticLeachTest;the
Product Consistency Test (PCT); and the Toxicity Characteristic Leaching Procedure (TCLP). Of these three tests, the MCC I Leach Test was selected for use to analyze the
mixed waste glass.
2.2
Glass Proverties
Glass can be divided into three types of oxides: network formers, network modifiers, and intermediates. Each group has a particular function in glass making.
Binary and ternary graphs of several different oxide combinations used in Rocky Flats and Oak Ridge glass are analyzed for their effects on the melt viscosity, liquidus temperature, and chemical durability. Fig. 21 shows the general properties of specific oxides in glass making with a more detailed description to follow. The only oxide not shown is Fe2O3 which would most likely be located near the A1203 line. The weight percentage of different oxides present in Rocky Flats and Oak Ridge glass are presented in Table 3- 1.
,ar,V17RIAICA 1ON
U91117Y
7OS17Y
XPAA2V
Fig. 21. Function of important glass oxides (1].
2.2.1
Network formers
Glass is defined as an inorganic product of fusion which has cooled to a rigid condition without crystallizing 1]. Glass atoms exhibit a random nature and do not exhibit
the patterned structure of crystalline solids as shown in Fig. 22. The three
network formers used in Rocky Flats glass were M2, B203, and P205. Silicon forms a
tetrahedral structure, SiO4, and is surrounded by four oxygen atoms as shown in Fig.
2-3. The smaller spheres represent silicon atoms and the larger spheres are oxygen atoms. As the percentage of Silicon in glass compositions increases, so does the temperature required to melt the glass. As can be seen from Fig. 2- 1, SiO2 adds viscosity to the melt and keeps the glass from thermally expanding. Silica is the most important glass oxide as it gives molten glass viscosity and cold glass its vitreous state, as well as generally imparting chemical durability.The oxide of boron, B203, was only used in limited attempts to reduce the melting temperature of the glass compositions studied. B203 acts as a small flux to reduce the
melting temperature of the glass. At low temperatures (500-600'C), boron forms =B04
groups in the glass structure. At higher temperatures, boron reduces to a trigonal plane coordination with three oxygens and becomes a network modifier and thus lowers theviscosity of the melt. The ternary diagram of Ca0-B203-Si02 in Fig. 24 shows that even
small additions of B203 such as that used in Batch 56 (-IO% B203) reduce the liquidus temperature significantly. Because many of the Rocky Flats glass had approximately 50% SiO2 and 20% CaO, an addition of 10% B203 should decrease the melting temperature from above 14OO'C to 12OO'C.(a) I 0 8 0.6 P(O) 0.4 0.2 0 120 130 140 150 160 170 180 190 (b)
Fig. 22. Schematic representation of (a) ordered crystalline from and (b) random-network glassy form of the same composition. From W.D. Kingery, Bowen, and Uhlmann [101.
(a) (b)
Fig. 2-3. (a) Schematic representation of adjacent SiO4 tetrahedra showing Si-O-Si bond angle. (b) Distribution of Si-O-Si bond angles in fused silica and crystalline crystobalite. From R. L. Mozzi, Sc.D. thesis, MIT, 1967 [II].
durable phase of glass in the SiO2-CaO-Na2O network which is extremely reluctant to devitrify [I]. Furthermore, boron reduces the expansion of the glass and helps to give it a glassy state. It is rarely found in devitrification products and may help to stabilize other elements contained in the glass and thereby increase the chemical durability of the glass[2]. P205 was used in very small percentages in the glass and was judged to have essentially no effect on the glass properties.
2.2.2
Intermediates
Intermediates are not glasses on their own, but in the presence of network formers may act as a network former[ I]. Intermediate oxides of importance used in Rocky Flats compositions were A1203, and Fe2O3. These oxides act as network formers in low concentrations, and increase the viscosity of the melt 3]. A1203 occurs as =- A104
tetrahedra in glass. According to Fig. 26 small additions of A1203 between one and three percent actually decreases the viscosity of the melt by lowering the liquidus
temperature. The thorium doped glass compositions (Batches 52-61) made for Rocky Flats contained an average of one to three percent. A203 is ideal for lowering melting
temperatures. This particular oxide retards crystallization and increases the chemical durability of glass when added 1].
Fig. 24. Ternary phase equilibrium diagram of the system CaO-B203-SiO2 with isotherms showing temperatures of complete melting. From Flint and Wells, Journal of National Bureau of Standards, Vol. 17
we'l GH r Pne C--,V r -Si 0
Fig. 2-5. Effect of boric oxide on the field of devitrite, Na2O-3CaO-6SiO2 in the Na2O-CaO-SiO2 system. From Morey, page 470 13].
ki I-k
welaHr ReR zcmr.4126
Fig. 26. Effect of alumina on the liquidus temperatures of some glasses in the Na2O-CaO-SiO2 system. From G.W. Morey, J. Am. Ceram. Soc., 15, 457 (1932) 14].
2.2.3
Network modifiers
Network modifiers are characterized by oxides which tend to decrease the liquidus temperature of melts and add favorable processing properties to the glass although other
properties may degrade. The balance of the oxides may be considered to act as network modifiers in the Rocky Flats and Oak Ridge system and are only considered when present in significant amounts: Na2O, MgO, CaO.
Na2O, also known as soda, acts as a network modifier by weakening the silicate structure in the glass and increasing its solubility in water. It is the main flux used in glass
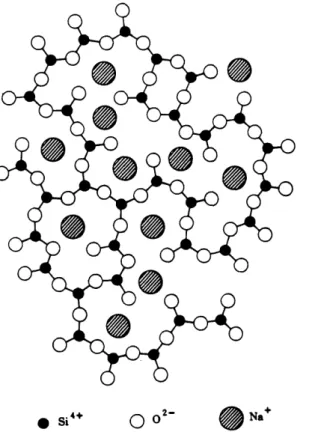
production. When present in glass, Na+ ions are sandwiched in between the SiO4
tetrahedral structure as shown in Fig. 27. No one unit in this structure is repeated at regular intervals in this system. When other network modifiers are added to glass, they also take up a position similar to that of sodium ions. Fig. 28 is a binary phase
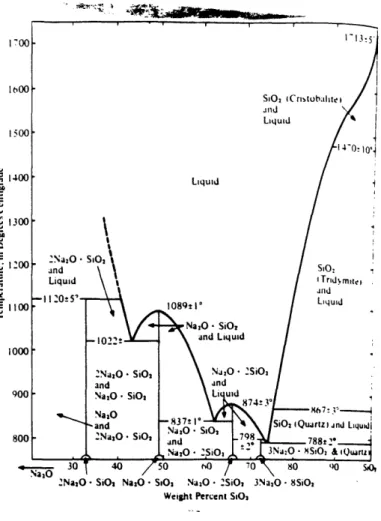
equilibrium diagram of the Na2O-SiO2 system. The dark line represents the melting point at various compositions. The minimum temperature (788'C) is reached at a 74% SiO2-26% Na2O composition. Any additional silicon added at this point increases the melting temperature sharply to the melting point of pure silica, 1713'C. However, no less than 46% SiO2 can be added before the temperature starts to climb again. Rocky Flats and Oak
Ridge glass silicon to sodium ratios averaged from 167 to 397 which corresponds to
approximately 62% SiO2 (melting point at 837'C) and 80% SiO2 (melting point at1 100'C), respectively.
Si 4+ 0 02- Na+
40
0
Fig. 2-7. Schematic representation of the structure of the.sodium silicate glass. From W.D. Kingery, Bowen, and Uhlmann [10].
CaO, also known as lime, acts as a modifier and lowers the melting temperature of glass (but only in a certain range of wt%) by weakening the structure of the melt at high temperatures (1000-1300'C) which decreases the viscosity. The binary phase equilibrium diagram of the CaO-SiO2 system is shown in Fig. 29. The range where calcium is most effectivein reducing temperatures is from 43% to 63% SiO2. The melting temperature at these concentrations ranges from 1455'C up to a maximum of 1544'C (5 1 % SiO2) and back down to 1436'C. Above and below these percentages, the melting temperature shoots up to above 2000'C. The addition of small aounts of CaO helps to retard devitrification [1 2. Large amounts of calcium oxide cause devitrifiation probably because there is not
enough silica present to form a strong coherent network. At low temperatures
(400-600'C), the double charge of the ion pulls the network together which increases the rigidity and chemical durability of the glass.1 .1 %a 1. r -1
Weight Percent SO,
Fig. 28. Binary phase equilibrium diagram of the Na2O-SiO2 sstem. Based on Moray and Bowen
(1924); Kracek 1930); Schairer and Yoder 1970) and Shahid and Glasser 1971). (Modified fi-om
"Professional Paper 440-L, "Geological Survey, U.S. Department of the Interior, Reston, Virginia.) 15].
With the addition of Na2O to the binary CaO-SiO2 system, the melting temperature is decreased significantly as can be seen from Fig. 2- 1 0. A small amount of calcium added to the system on the order of two to three wt% decreases the melt temperature. Most of the glass made for this project fell into the Na2O-2CaO.3SiO2 composition range. Thus with the CaO wt% ranging from 10 to 40 wt%, melting temperatures ranged from 1050'C to
1 2600 2 0 0 2400 I I - I I I I I I 2570'
CaO and Liquid 11 30'
1-070' 050-Cao and 3CaO SiO2 -,Cao . Sio and 0 0 3CaO SiO2 1464 141-0 2Ca - O - O-and 3CaO -SiO2 1 250' Cao and 2ca S-2300 2200 2100 2000 U 7 'I .p d W V n .S 1; V C. E V 1900 Liquid 1800 I I // Two Liquids I 3CaO - 2S1OJ 1('98' and I Liquid , ( ristobalite) nd II Liquid -II 1470'
1455' Ymite and Liquid
1436'
Ca - iO2 Liquid 67
C30 SiO2 and SiOz Tridymite)
3CaO - 'SiO,
and
CLIO SiO2
CaO SiO2 and Tridymite 1700 1600 1500 1400 1300 1200 1100 Cao io 20/ 30 40' 50 ',,,"60 70 80
2CJO - , 3CaO - Sio, CaO SiO2
3CaO - SiO, " io
-Weight Percent SiO2
90 SO,
Fig. 29. Binary phase equilibrium diagram of the CaO-SiO2 system. From Rankin and Wright 1915) and Welch and Gutt 1959). (From "Professional Paper 440-L, "Geological Survey, U.S. Department of the Interior, Reston, Virginia.) 161.
1300'C* . After this, any additional calcium increases the melting temperature. Based on the knowledge of these diagrams, it is possible to become accurate when predicting melt temperatures for Rocky Flats and Oak Ridge glass.
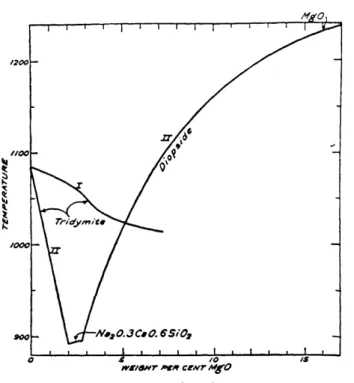
MgO as stated earlier has very similar properties and effects on glass as that of CaO but has a larger effect on glass temperature in small quantities. Fig. 21 shows these effects. Any addition of MgO decreases the melting temperature of the Na2O-CaO-SiO2 glass system until 3 wt% is added. After this point, the melting temperature rises to the original point of 1080'C at 7 wt% MgO. Whereas a the maximum temperature drop of the CaO addition was only 20'C or so, the drop for MgO is near 200'C. The amount of MgO added for glass in this project ranged from 5 wt% to 12 wt% which corresponds to a 100'C drop in melt temperature or a 100'C increase in melt temperature, respectively.
2.2.4 SiO2-CaO-Na2O ternary system
Now that the binary phase equilibrium diagrams of the Na2O-SiO2 and the CaO-SiO2 have been shown, they can be combined into a ternary diagram (Fig. 212). All temperatures are in degrees Celsius. The ternary diagram is valuable because it can be used
1200 1100 '1000 900 AMI -102io I I I -Va02Ca0.3Si0r,I 5 10 is 20 25 30
WEIGHT PER CENT O
Fig. 2-10. Melting point diagram of the binary system Na2O, 2SiO2-Na2O, 2CaO, 3Si02- rom Journal of the Society of Glass Technology p. 248 [17].
* Because MgO has similar properties to that of CaO, both oxides were added together when reporting CaO wt% in Fig. 212. The amount of MgO was about half that of CaO for most samples.
Fig. 211. Effect of Magnesia on the liquidus temperature of some glasses in the system Na2O-CaO-SiO2. From W.D. Kingery, Bowen, and Uhlmann [101.
to indicate trends in the minimum temperature required to melt the glass. Once this is known then, it can be used to predetermine if the glass is worth attempting.
Many of the glasses had a iO2 wt% below that of 50% which does not read on the available ternary diagrams. Batch 31 has a liquidus temperature (LT) of 1150'C according to the diagram, and 32 (LT of 1 100'C), and 59 (LT of 1040'Q also fall within the
Na2O-2CaO-3SiO2 phase. If the diagram is extended, it is possible that batch 35 (estimated LT
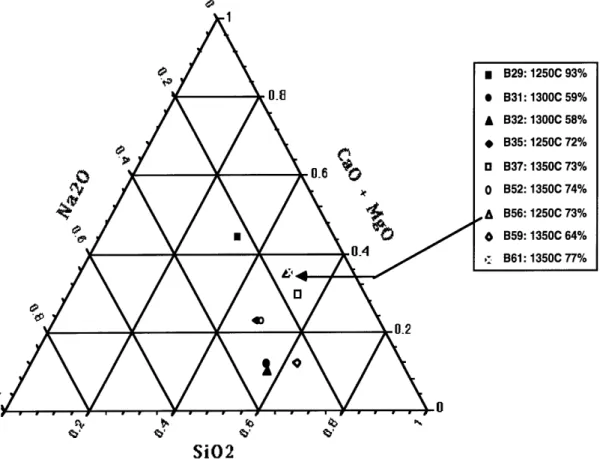
of 1280'Q and 52 (estimated LT of 1270'C) fall within that phase also. The phase for batch 29 is unknown as there is no diagram found to compare with that composition. Batch 37, 56, and 61 conglomerate together in the phase of - CaO-SiO2 and a similar LT near 1275'C. The various Rocky Flats glass compositions are shown on a ternary diagramin Fig. 213. In the Discussion and Results chapter, the location of these batches in reference to their leaching characteristics, liquidus temperature and melting temperature are
CaO I'l .1 545 45 40 5 'g-29
0
10 35 1707 25 20 15 40 10 45 107 si( a 1727 NaOFig.2-12. PhaseequilibriumdiagramoftheNa2O-CaO-SiO2temarysystem. Temperaturesarein
degreesCelsius. Compositionsareinwt%. Straightlinesindicatesubsoliduscompatibilityjoins. From K. A. Shahid and F.P. Glasser, Physics and Chemistry of Glasses Vol. 13 No.2 April 1972 [18].
Fig. 212. Rocky Flats Glass Compositions
4) 0i
4D 0.2 0 CO PQ CO,SiO2
Fig. 213. Ternary diagram of Rocky Flats glass compositions made in this thesis. Percentages are in MOM
2.3 Leaching mechanisms and chemical durability
The chemical durability of a glass refers to its ability to resist decomposition in the environment. The fact that glass will degrade is not the problem as virtually every
substance degrades to some extent in the environment. The problem is measuring how fast the glass degrades. The rate of degradation, a.k.a. leach rate, is affected by environmental conditions, glass composition, and glass structure. The mechanism of glass degradation has been described by several theories: 1) classical interdiffusion 2 chemical ion
exchange; 3 water transport; 4 network hydrolysis mechanisms, 5) free energies of
hydration; and 6 solubility effects 4]. These models will be discussed along with experiments which have incorporated these theories to explain their results.2.3.1
General glass degradation principles
Degradation rates are affected by several factors: glass composition; chemical composition and ionic strength of leachant pH of leachate; redox potential; flow rate; repository temperature; waste package components; surface layers; devitrification; and radiolysis 2]. Lutze has made the following conclusions on the chemical corrosion of
high-level waste (HLW) glass:
(1) Different glasses have different corrosion rates. The corrosion rate can be related to the free energy of hydration of the glass.
(2) The corrosion rate decreases with time in a closed system by several orders of magnitude, relative to its initial value.
(3) The corrosion rate is constant in a flowing water, if transport through surface layers is not rate controlling. The corrosion rate is typically on the order of 0. to
5.0 g rn-2 d-1, at 90'C in deionized water.
(4) The corrosion process is likely to proceed at a low rate over long periods of time. Long-term rates are on the order of 0.01 to 0.001 g m-2 d-1, at 90-C. (5) Solid reaction products form as layers on the surface of the pristine glass. Theses layers, which may contain elements from the glass and from solution,
consist of crystalline and non-crystalline phases (e.g., NaAlSi2O6.H20, analcime,
with Al and Si from the glass, Na and H20 from an NaCl leachant solution) 2].Network formers are covalently bonded in the glass network and along with
intermediates are released by the hydrolysis of metal-oxygen bonds. Intermediates as
discussed before, may act as a glass former in the presence of other network formers.
Modifiers are ion exchangeable cations in the network which are removed from the networkselectively via ion exchange reactions.
If flow rates in the repository are fast enough so that glass leaching does not affect the solution chemistry then dissolution kinetics are initially proportional to t.5 and over time become proportional to tl. If the flow of the water is slow enough, the glass constituents could saturate the solution and leaching could come to a halt. When predicting long term
leach rates and the transition time between diffusion, t.5, and t1 is unknown and is assumed, predicted leach rates could be poor representations of the real values.
Furthermore, changes in pH values between 3 and 12 can change the leach rates by a factor
of 10. If network formers form insoluble products, the change in pH could change leach
rates by a factor of 104 4]. The following six theories attempt to describe effects of thekinetics, glass structure, and pH changes into their models.
2.3.2
Classical interdiffusion
In this theory, the modifiers in the glass are selectively leached by an ion exchange process:
=-
Si - O-Na + H30 - - >=-
Si - OH + Na +
H20The model states that the transition from t.5 to t I is a change from selective glass
dissolution to uniform glass dissolution. The model overestimates the actual leach rates by a factor of 102-105. Assuming that the hydronium ion is the rate limiting factor, then it must move slower than the alkali ions which makes the prediction of leach rate even worse.
When elements leach from a glass, experiments show that the following order prevails Cs,
Rb>K>Na whereas classical interdiffusion predicts the reverse. It has been shown that
selective leaching can occur during the transition and full implementation of the t I leach rate, which this theory contradicts. This model also fails to explain solution chendstry effects 4].2.3.2
Chemical ion exchange
Assuming all water molecules have access to all ion exchange sites, an effective diffusion coefficient can be found for leaching:
DIOC 2
Dff = +pKD
/ewhere D is the ionic diffusion coefficient in water, a is the tortuosity factor, KD is the distribution coefficient, p the density of the glass, and the void fraction of the solid. Although the t.5 to tl transition is not explained in this model, it does accurately describe the chemical ion exchange qualitatively. The prediction turns out to be 102 to 104 faster than actual leach rates 4].
2.3.4 Water transport
Glass has pore sizes the same size or smaller than water molecule sizes. It can thus be assumed that most of the leach rate is controlled by reversible hydrolysis reactions. The predicted results agree to within one order of magnitude to the real results. The second part of this theory states that if the structure of the glass changes, then pore sizes increases and the diffusion layer does not stop or slow leaching and the rates follow the t1 curve. An
explanation of network hydrolysis mechanisms is needed to understand reversible
hydrolysis reactions 4].
2.3.5
Network hydrolysis mechanisms
In this theory, reactions cause dissolution and restructuring of the silicate network. Under most pH conditions the following reaction is dominant:
Si - 0 - Si(OH)3+
OH- _->=
Si - 0 - Si(OH)
<-=Si
- 0 + Si(OH)4
In this reaction, hydroxide ions attack non-bridging oxygen (nbo) sites and form unstable coordination intermediates. The intermediates can then decompose to break the Si-O-Si bonds. This explains why alkali silicates with a high nbo content dissolve faster than
tetrahedral or borate sites. Soda-lime glasses consist of high field strength modifiers which
phase separate into silica rich and modifier rich regions. Silica rich regions providehydrolysis barriers to protect modifier regions. Low field strength modifiers (Cs, K) have
randomly separated regions and as a result can not form a protective layer.In explaining the t.5 to tl transition, these glasses have a high number of silanol molecules after leaching which results in a porous aggregate structure of colloidal silica particles that do not act as a diffusion barrier 4].
2.3.6
Free energies of hydration
The structure of glass is ignored in this model and only the free energy of hydration
is concerned. For Silicon, results have been within one order of magnitude of real leach
rates. This model works well only with durable glasses that dissolve uniformly and do not saturate the leachate with saturation products. Problems occur with the oversimplification of the chemistry and pH effects 4].2.3.7
Solubility effects
This model works well for simple oxide minerals dissolving uniformly. The dissolution rate is strongly influenced by the degree of solution saturation. The equation used for this model follows the following pattern:
K = Q - M]I[M],)p
where [M] is the solution concentration of dissolved elements and [M]s is the concentration of M in a saturated solution. This model shows what the maximum concentration of elements in the solution can ever be. The kinetics of elemental release are based on short term tests. Unfortunately, the quickness with which a glass dissolves can not be predicted.
Even though the silicon concentration may be at saturation limits in the solution, the glass can continue to react with the water. The result is the glass becoming a mass of colloidal particles of amorphous silica which may or may not be retained in leached layers. Also, protective oxide layers may form on the glass layers.
As a result of the different glass dissolution theories, it is possible to predict leach rates within one order of magnitude of the actual rates provided that the structure,
composition, and chemistry of both solid and solution phases are known 4].
2.3.8
Application of theory to experiments
In tests done by Carrol et al. 1993), it was found that glass dissolution rates of
SRL 165 glass (I 8.2% Na 597% Ca, 11.68% A1203 843% B203, 55.73% SiO2)
were directly proportional to the amount of hydrogen and hydroxide ions in solution. Acombination of network hydrolysis theory, and water transport theory, was used to explain
the results. Pure silicon gel tests showed that very little reaction occurred between the gel and the DI water leachant which supports the fact that there were very few nbo's present in pure silicon gel. The manner in which sodium leached from the glass was unsure as to whether it enhanced dissolution or if it was a part of the depolymerization of the frameworkbonds.
The dissolution rate of glass is controlled by the breaking of bonds in the metal-oxygen framework. This is accelerated by H and OH- ions adsorption at the reaction sites. The rate limiting step is the detachment of the cation from the mineral/solution interface:
protonation:
>MOH + H<=> >MOH2+
K., = [> MOH,+
[> MOH]fH+1
1> MO-11H+j
deprotonation:
>MOH<=>>MO + H
K. =
2
[> MOH]
>M represents the metal surface species, Kal and Ka2 represent the conditional constants for mass balance expressions for absorption reactions. [i] and I i I are the concentration and activity of the ith surface of the aqueous species. Thus the dissolution rate is,
R = Kl[>
MOH2+] +KOH[> MO-]'where Ki is the dissolution rate constant attributed to the ith adsorbing ion. The number of ions absorbed prior to the detachment of the metal ion into the bulk solution are represented by n and m. The chemical durability of the glass is decreased if there are more
non-bridging silanol bonds following the network hydrolysis mechanism theory. H+
adsorption or dissolution at these sites accelerates the dissolution of the glass 5].A study by Van Isegham et al. showed that leach rates increased one order of magnitude when the surface area to volume ratio was decreased from 1.0 cm I to
0 I cm- 1. The basic theory behind this test supports the solubility limit theory. This glass had a composition of 66-70% SiO2 64% Na2O, and <IO% Fe2O3 or Fe2O2 and when
A1203 was used to replace Fe2O3, the chemical durability of the glass was improved. Leach tests were performed at 200'C, 90'C, and below 90'C. Results were presented by using the normalized leach specific weight loss (NSWL) found by the following equation,
NSW =
q
I
Q11O SA
where q is the amount of element in the leachant, Q the weight percent of the element in the glass, and SA the surface area of the glass. The glass tested at 90'C and at a SAN ratio of I
cm I showed diffusion controlled leaching which is represented by, Qj =
t0_5for Si, Na,
and K. The following relationship in glass dissolution quantities was found: NSVV =>
Na K > Si, Ca > Mg, Al > Fe. Tests below 90'C showed rapid decreases in corrosion
rates with time. The 200'C tests showed crystallization of the glass and corrosion rates remained constant with time. At 190'C, the solubility limit of Si, Na, and K are ten times greater than at 90'C and therefore it would be expected under saturation limit controlled leaching that the leach rate would be one order of magnitude larger than at 90'C. Also, the pH increased greatly at higher temperatures 7].Depending on the various repository conditions and properties of any glass, diffusion or saturation limit controlled rates would be the most likely mechanisms for leaching. Chick and Pederson 1984) [8] proposed three theories for glass dissolution as follows:
(1) The layer is a diffusion barrier for either water transport to the reaction zone and/or transport of reaction products away from the reaction zone (Hench 1977). (2) The layer has little or no effect on the transport of any critical species 9]. (3) A passive layer forms on the glass surface (Harvey and Jensen 1982).
For case one, the corrosion rate is proportional to the square root of time. For case two,
the rate of corrosion decrease is due to the saturation effects of the leachate and the rate does not depend on the surface layer thickness. The creation of a solid reaction product can control the leaching of silica from the glass and solution. In case three, the rate basically comes to a halt as soon as the surface layer forms 2]. In the test to confirm one of the theories, there were three leach tests carried out with four diffe rent glasses. The first test studied the influence of pre-formed reaction layers on elemental release. The second test replaced glass specimens with fresh specimens. The third test replaced leachant at fixed intervals for analysis of reaction layer thickness. The overall findings were that the leach rate was saturation controlled and that the reaction layer had a very small effect in some cases but not all. Chick and Pederson reinforced the Grambow tests on gel layer effects and glass dissolution by Grambow. This effect was investigated in the Results chapter.Tests by Grambow et al. 1984), were done to determine what effect the reaction layer on glass has during dissolution. There are two schools of thought in gel layer protection: the gel layer is protective; the gel layer is water permeable and is made of
absorbed species and "sparingly soluble solids". In the first theory, the overall leach rate is limited by the growth of the surface layer and saturation effects. MCC76-68 and C31-3 glasses were tested in DI water and 0.001 M M902 leachate for up to 158 days. It was found that the surface layer added no protection to the glass tested in DI water. However, when the reaction layer was removed in the M902 solution, the leach rates increased.
As silicon reached its saturation level, the density of the silicon/oxygen crosslink bond increases at the glass/surface layer transition zone, thus a decrease in leaching. In brine leachates, the glass continued to dissolve because of magnesium silicate formations. In DI WATER, the leach rates went to zero because the silicon became saturated. The basic results for the DI WATER with the surface layer removed were the same as those samples with the surface layer left intact. Furthermore, glass was preleached for 57 days, had the gel layer removed, and replaced back into the container with no gel layer fonrning even with testing up to 100 days. Thus reinforcing the saturation limit theory of glass dissolution 9].
2.4 Leach Tests
A leach test attempts to simulate potential waste storage conditions and the effect of the conditions on the ability of a material to contain its hazardous/radioactive components. In addition to simulating environmental conditions, the test must be rigorously performed by placing a certain amount of glass with a specific surface area into a certain volume of leachate in an inert container. The type of leachate used can either by deionized (DI) water or some type of brine solution which is representative of a repository. The length of the leach test can vary from hours to months and the temperature can vary from room temperature to 200'C. The longer a test is run under prototypical conditions, the more reliable the predictions of future durability become. There are three major leach tests used for glass dissolution and they are discussed in this section.
2.4.1
MCC-1P static leach test
The MCC I leach test matrix consists of a 3 7 14, 28, 90, and 180 day test. The
temperature range of the tests were room temperature, 40'C, and 90'C. Leachant was madeof DI water or some type of brine solution. This thesis performed tests with DI water to
conservatively estimate durability. Glass cubes were contained in PA Teflon bottles andMonolithic glass cube test specimens of approximately 13 mm per side were cut and polished from an original glass billet. The surface area to volume of leachant ratios were kept within 0.0005 of 0.01 mm-1. The glass used in the project had an average surface area of 10 cm2. Therefore, the amount of volume of leachant used averages 100 ml. Glass surfaces were finished by polishing the surfaces with a 320 grit SiC paper. Leachants were acidified with HN03 to one percent before being analyzed with an ICP-AES.
The MCC I test is not required for regulatory compliance, but is used as a tool to develop mechanistic understanding of material degradation behavior. Once the mechanism of degradation has been identified, a long term prediction about a particular glass can be determined using the results from the MCC I leach test. The other two tests, TCLP and PCT are used more for product and regulatory compliance and are more difficult to use
when predicting leach mechanisms and therefore long-term durability assumptions.
2.4.2
Toxicity Characteristic Leaching Procedure (TCLP)
The TCLP is the primary test required by the EPA for compliance with its waste form durability requirements. Because this is the only "required" test for waste forms, the Department of Energy (DOE) has widely adopted the test as a comparator of different wastes. The TCLP was designed for use in municipal landfill conditions, which may not be typical of DOE hazardous/radioactive disposal environments.
Several methods exist for conducting this test but the basic concept behind these various methods is the same. Glass is crushed into two sizes, mm<dp<4 mm and <l
mm, and mixed with a hydrochloric acid solution, heated, and cooled. The pH is recorded
and if it is >5.0 extraction fluid #2 is used otherwise extraction fluid #1 is used. Extraction fluid 1 is made with acetic acid, DI water, and sodium hydroxide and has a pH of4.98±0.05. Extraction fluid 2 is made with acetic acid and DI water and has pH of 2.88-+0.05. New glass powder is mixed with the extraction fluid to a 0: 1 ratio of liquid mass to glass weight. The bottle with this solution is placed into a tumbler and mixed for
18 hours. The leachant is then analyzed accordingly.
The drawback of this test is that only one time period is required, 18 hours. A time period of 18 hours is not sufficient to determine what mechanism is occurring with the glass corrosion. Also, only one temperature is used and even with a high surface area to volume ratio, glass leach rates will not represent accurate repository results. In effect, a leach rate may be low and pass the government standards for the short term but in the long term, the glass may corrode far differently than predicted. Some glasses may be much better than another glass but will yield the same results for the test once the solubility limit is reached.
2.4.3
Product Consistency Test (PCT)
This test was made for DWPF Savannah River site borosilicate glass. Although the
test is highly reproducible and yields rapid results, the test is designed as a quality control check and is usually conducted for one length of time, usually seven days. This test has a high surface area to leachate volume and the entire purpose of the test is to determine the maximum solubility limit of the glass in solution. Glass is crushed into 100-200 mesh size and a temperature of 90'C during the test is used. The ratio of volume solution to solid solution is 10 ml per gram. A single leachant, ASTM Type I water is used. Again, this test will not determine corrosion mechanisms because it automatically brings the glass to itssolubility limit. This does not represent actual repository conditions for glass and may be
too conservative as a predictor for underground glass disposal.3.1 Chapter Summary
This chapter discusses the procedures that were followed in order to create and test the glass made specifically for this thesis and Pacific Northwest Laboratory (PNL) master agreement No. 206005-A-L2. An in depth description of the following procedures is given: batch calculations; furnace melting; fusion/glass verification; MCC- 1 P static leach test; 1CP-AES analysis; and SEM-EDAX analysis. Glass forming chemicals were first mixed according to batch calculations, and melted in a furnace. Once the melt was homogeneous, the molten glass was poured into a graphite mold and annealed. A large portion of the glass billet was sectioned and tested using the MCC I P Static Leach Test while the glass composition was verified using a KOH fusion process. At the end of the leach test, the leachant was prepared for the ICP spectrometer. Glass samples were analyzed in the SEM-EDAX for crystallinity, structure and surface composition.
3.2 Batch Creation
MajorConstituents
MinorConstituents
Sample SiO2 A1203 Na2OK20
P205
CaO Fe2O3M90
B203
S03
ThO2 ZnO PbO C1`203 NiO BaO CdO Rocky Flats 28.51 - 54.850.79 - 831
10.27 - 25.82
1.31 - 654
1.40 - 447
4.93 - 15.23 2.13 - 14.76 2.82 - .80- 697
0.09 - 044
.0005 - 00193
0 0 0 0 0 0 Oak Ridge44.37 - 59.17
11.09 - 14.794.43 - 591
0 019.36 - 38.72
0 0- .00
0 00.01 - 0036
0.098 - 0196
0.15 - 031
0.15 - 031
0.098 - 0196
0.098 - 0196
Chapter 3
Waste compositions were supplied by Pacific Northwest Laboratories and originated from two major nuclear waste producers: Rocky Flats and Oak Ridge
Table 31.
Composition of
Rid2e Glasses (wt. )
Waste Loading 17.09 99.'/'/ V0
20 - 40
3 4
EXPERIMENTAL
OXIDE
-SiO2A1203
-Na2O
-P205
CaOFe2O3
-MgO
S03
K20
ThO2Wt. of Oxide
41.7
2.96
20.57
2.37
9.92
13.10
5.79
0.22
3.35
0.0014 1 . Fraction =-
1.00
-
1.00
. 0.369-
=
. 0.50
- 0.562
.
1.00
1 0.1572. 0.5882
-
0.465
=
. 0.470
=
Wt. of Chemical
41.7
2.96
55.74
4.74
17.6513.10
36.83
0.374
7.20
0.00298
Chemical Used SiO2 A1203 NaHCO3Na2HPO4
CaCO3 Fe2O3Mg(NO3)2-6H20
CaSO4 KNO3Th(NO3)4-4H20
Laboratories. The glass termed Rocky Flats sludge was made of contaminated low level waste which was created during plutonium purification processes. The glass termed Oak Ridge sludge originated from depleted uranium manufacturing operations. Table 31 shows the range of glass compositions developed in this thesis along with their waste
loading percentages.
3.2.1
Batch calculations
Waste compositions were given as oxide percentages for Rocky Flats and Oak Ridge glasses. Thus, the oxide percentage was exactly the gram amount needed if creating
a 100 gram glass batch. For example, if a particular glass contained 40% by weight SiO2,
then 40 grams 1.'SiO2 would be the amount required to produce a 100 gram batch of glass.To determine the number of grams of each chemical needed to create the glass, the chemical oxide mass desired was divided by the glass making oxide fraction of the
chemical used in preparing the batch (see below). For example, in batch 52, the following calculations were performed:
Total 99.98 1
---180.30
Some chemicals produced two oxides after decomposing such as Na2HPO4 which
produced the oxide P205 and a small amount of Na2O. In this case, the amount ofNaHCO3 was reduced so that the final composition compensated for the correct amount of Na2O. Once all of the weights were ascertained, each chemical would be measured out to ± 001 grams on an OHAUS TP2KS scale and placed into a single DFC Fused Silica 120 gram crucible. Hygroscopic chemicals were measured under a nitrogen atmosphere in a plastic glove bag to ensure that no moisture or C02 were adsorbed+. Once all of the
chemicals were placed into the crucible, they were thoroughly mixed with a spoon or
spatula.
If a particular glass sample was to be doped with thorium, such as R-52, thorium. (as Th(NO3)4.6H20) was in dissolved in HN03 and added to the batch. For all Th-doped batches, the Th was added last and then mixed in with the rest of the sample. Thorium. solutions were carefully droppered into the center of the powder mix so that the liquid
would not be adsorbed by the crucible walls.
3.2.2
Furnace melting
Mixed waste samples to be vitrified were placed in a Lindberg/Blue M furnace, model 51333 (rated to 1500'C), at or below 1000'C to ensure that no rapid chemical reactions took place and also for the decomposition of certain elements, i.e. CaCO3 to
proceed slowly. The furnace, shown in Fig. 32, was controlled with an OMEGA
PHB-47 bench microprocessor. Crucibles remained at 1000'C for at least thirty minutes before raising the furnace to the desired melting temperature of the glass. In some cases, the desired temperature produced non-homogeneous melts and the furnace would be raised to a higher temperature until the molten glass was homogeneous and had no gas bubbles. The majority of Rocky Flats glass and Oak Ridge glass became homogeneous whentemperatures were above 1250'C and almost always at 1350'C. Typically, the higher the waste loading, the lower the temperature needed to create a homogeneous melt because the majority of the wastes acted as network modifiers.
Once the.prescribed temperature was reached, the molten glasses were held at that temperature for two to three hours to ensure complete homogeneity. The molten glasses
were then poured onto a graphite block mold, 13.5 mm by 13.5 mm by 84 mm, and cooled
inside a fire brick housing shown in Fig. 3- 1.Generally, about 30 minutes was needed to cool the glass prior to removing it from the graphite block. If the glass survived the cooling process by remaining as one complete ingot, it would then be annealed in the furnace at 500'C for at least one hour and then
furnace cooled. f the glass fractured while cooling, it would either be discarded, crushed
and re-melted again in the same crucible, have flux added to it, or archived for later use. If re-melting failed twice, several things would usually be done to the composition, furnace temperature, or melt time in order to keep the glass from cracking in the fire brick housing while cooling$. After the annealing process, the glass would be used for three purposes:$ Many homogenous melts consistently cracked in the mold and there were no glass chunks large enough to facilitate a leach test. The mass of the graphite mold was reduced in order to lower the heat transfer from the glass to the graphite thereby avoiding stress cracking.
I
'I% I
-4 I
O *I-- .A
I
j i3
,, L I z -IAr a&E -,-Fig.3-2. Lindberg/Blue M oven in which reagent grade chemicals are melted into a glass.
1) A fusion/ICP analysis in order to find the exact composition of the glass, 2) MCC I static leach tests and,
3) SEM-EDAX/microscopic analysis.
3.3
Glass Composition Verification
The final glass compositions were determined by using a fusion process described in PNL procedure no. APSL-03. This procedure uses an alkali caustic (KOH) to dissolve the glass. This would require that two fusions occur to determine all of the elements composing the glass. Potassium hydroxide fusions were performed in a nickel metal crucible which determined all elements present except potassium.
The glass was crushed using an alloy tool steel mortar and pestle then passed through a 140 mesh sieve. If the glass did not pass through the sieve, it was crushed until
it became small enough to pass. The crushed glass was weighed out to 025 ± 0075
grams and placed into a nickel crucible.Approximately 1.8 ± 04 grams (about 20 pellets) of KOH was weighed and transferred into the Ni crucible. To further facilitate dissolution of the glass in the fusion, 0.2 ± 0.1 grams of potassium nitrate was added to the crucible. The contents were swirled until the ground sample was mixed with the flux. An electric Bunsen burner (model
number BA 6101, 12OV, 40OW, fuse 3.5A, 1000'C max.) was preheated. About three
minutes was needed to melt the KOH pellets and the total melt time was ten minutes. The crucible was removed from the burner and cooled to room temperature.Approximately 10 ml of DI water was slowly added to the crucible in order to dissolve the cake-like crystalline melt. Once dissolved, the liquid was transferred to a 250 ml volumetric flask. If all of the melt in the crucible was not completely dissolved, another
10 ml of de-ionized water was added until all of the melt dissolved. After the transfer was completed, the solution in the flask was diluted up to 100 ml. The solution was then acidified with 25 ± ml of concentrated hydrochloric acid. The solution was swirled, and if any precipitateremained approximately 03 ± .1 grams of oxalic acid crystals were added. The flask was then filled to the 250 ml mark on the neck. Because a KOH fusion was performed on the glasses the potassium concentrations were not determined from ICP analysis. The concentration of elements in the flask were typically near 1000 ppm.
ICP standards were created for the fusion analysis and were separated into two
![Fig. 21. Function of important glass oxides (1].](https://thumb-eu.123doks.com/thumbv2/123doknet/14246338.487576/15.924.236.609.108.383/fig-function-important-glass-oxides.webp)