Publisher’s version / Version de l'éditeur:
Journal of Architectural Engineering, 8, December 4, pp. 97-107, 2002-12-01
READ THESE TERMS AND CONDITIONS CAREFULLY BEFORE USING THIS WEBSITE. https://nrc-publications.canada.ca/eng/copyright
Vous avez des questions? Nous pouvons vous aider. Pour communiquer directement avec un auteur, consultez la première page de la revue dans laquelle son article a été publié afin de trouver ses coordonnées. Si vous n’arrivez pas à les repérer, communiquez avec nous à [email protected].
Questions? Contact the NRC Publications Archive team at
[email protected]. If you wish to email the authors directly, please see the first page of the publication for their contact information.
NRC Publications Archive
Archives des publications du CNRC
This publication could be one of several versions: author’s original, accepted manuscript or the publisher’s version. / La version de cette publication peut être l’une des suivantes : la version prépublication de l’auteur, la version acceptée du manuscrit ou la version de l’éditeur.
For the publisher’s version, please access the DOI link below./ Pour consulter la version de l’éditeur, utilisez le lien DOI ci-dessous.
https://doi.org/10.1061/(ASCE)1076-0431(2002)8:4(97)
Access and use of this website and the material on it are subject to the Terms and Conditions set forth at
Dynamic wind uplift performance of thermoplastic roofing system with
new seaming technology
Baskaran, B. A.
https://publications-cnrc.canada.ca/fra/droits
L’accès à ce site Web et l’utilisation de son contenu sont assujettis aux conditions présentées dans le site LISEZ CES CONDITIONS ATTENTIVEMENT AVANT D’UTILISER CE SITE WEB.
NRC Publications Record / Notice d'Archives des publications de CNRC:
https://nrc-publications.canada.ca/eng/view/object/?id=86a7321b-9b1f-4f7e-8c5c-1f05c3485514 https://publications-cnrc.canada.ca/fra/voir/objet/?id=86a7321b-9b1f-4f7e-8c5c-1f05c3485514roofing system with new seaming technology
Baskaran, A.
A version of this document is published in / Une version de ce document se trouve dans : Journal of Architectural Engineering, v. 8, no. 4, December 2002, pp. 1-11
www.nrc.ca/irc/ircpubs
NRCC-45393
PROOF COPY [AE/2002/021983] 007204QAE
Dynamic Wind Uplift Performance of Thermoplastic Roofing
System with New Seaming Technology
A. Baskaran
1Abstract: Wind dynamics, on a conventional roofing system, lift the membrane and cause fluttering, introducing stresses at the
attach-ment locations. To identify the component of the system that has the weakest resistance against wind uplift forces, a dynamic method of evaluating roofing systems is beneficial. A recent industry survey predicts significant growth for thermoplastic polyolefin ~TPO! mem-branes. Among others, hot-air-weld ability is an advantage of the TPO. In mechanically attached TPO roofs, seams are formed by welding one side of the bottom sheet with the top sheet using hot-air machines. Advancements in welding technology have led to double-side weld procedures or encapsulated seams for the TPO membranes. Wind uplift evaluations are being carried out on the TPO systems with one-side weld and double-side weld. Experiments have been conducted at the dynamic roofing facility ~DRF! of the National Research Council of Canada, using the SIGDERS ~special interest group on dynamic evaluation of roofing systems! wind test protocol. Systems with double-side weld performed better than the systems with one-side weld. Use of double-side weld minimizes asymmetrical stress concentration and improves the wind rating of the mechanically attached TPO roofing systems.
DOI: 10.1061/~ASCE!1076-0431~2002!8:4~1!
Introduction
The design of a roofing system must account for the effects of wind. Wind-induced pressures on a roof system can vary across the surface of the roof. The wind’s effects can also vary with time since pressure fluctuates with wind. This is particularly important in conventional roofing systems, where the waterproof component of the system, a flexible membrane, is on the outer surface and exposed to external environmental conditions such as wind and temperature changes. The present study focuses on the behavior of such roof systems, in which thermoplastic membranes are used as the waterproof component. Two main kinds of thermoplastic membrane, polyvinyl chloride ~PVC! and thermoplastic olefins ~TPO! are used in single-ply roofs. In PVC, both reinforced and nonreinforced varieties are available on the market, whereas only reinforced TPO membranes are used in roof assemblies.
In the early 1990s, TPO was introduced into the roofing mar-ket because of its environmental profile ~Beer 1997!. TPO mem-branes are positioning themselves well among the new generation of single-plies. TPOs may be produced either by a reactor process using a specific catalyst or from a physical blend of the olefin phase and an ethylene propylene rubber. Polyester scrim has been primarily used as the reinforcement in these membranes. Rela-tively new to the North American roofing market, TPOs claim excellence in UV and tear resistance. Hot-air weldability is also an advantage for rooftop applications of these membranes. The weathering resistance of the membrane is mainly derived from the
presence of the ethylene propylene rubber, while the olefin phase imparts chemical resistance, tear resistance, and hot-air weldabil-ity.
Sheet width of TPO membranes varies from nominal 1.8 m ~6 ft! to 3.6 m ~12 ft!. As shown in Fig. 1, membranes are placed on the rooftop and attached to the structural deck using mechanical fasteners. The attachment locations are then overlapped as seams. Wind-induced suction lifts the member between the attachments and causes membrane elongation and billowing. The magnitude of the wind-induced suction and the membrane elastic property determines billowing shape. Fig. F1 also shows the components of a mechanically attached single-ply roof assembly. Each com-ponent offers certain resistance to the wind uplift force. This can be illustrated through a force-resistance link diagram. All resis-tance links should remain connected for the system to be durable and to keep the roof in place where its belongs. Failure occurs when wind uplift force is greater than the resistance of any one or more of these links. For example, the roof assembly is considered failed when a fastener ~link 6! pulls out from the deck although the membrane and its seams are in good condition. Similarly, a system is considered failed when a seam ~link 2! opens under gusting wind while other components are intact. Conventionally, to maintain water tightness in roof assemblies with TPO mem-branes, one-side weld ~OSW! seaming methods are applied. OSW is known as traditional seaming. It normally has an overlap of 127 mm ~5 in.!, with the fastener placed 38 mm ~1.5 in.! from the edge of the under sheet and 89 mm ~3.5 in.! from the edge of the overlapping sheet. The portion of the seam beyond the fastener row is welded with hot air such that a waterproof top surface is obtained. The width of the welded portion varies between 38 and 45 mm ~1.5 and 1.75 in.!. Advancements in welding technology have led to double-side weld ~DSW! procedures ~Russo 1998; Baskaran and Xu 2001!. DSW is known as encapsulated seams. Mostly, it is used in conjunction with metal or plastic batten strips. The strip, usually 25 mm ~1 in.! wide, is centered inside a 100 to 127 mm ~4 to 5 in.! lap seam. A double-nozzle hot-air robotic machine is used to create an approximately 34-mm-wide
1Group Leader and Senior Research Officer, Bldg. M24 National
Re-search Council Canada, Ottawa, OH Canada K1A 0R6. E-mail: [email protected]
Note. Discussion open until May 1, 2003. Separate discussions must be submitted for individual papers. To extend the closing date by one month, a written request must be filed with the ASCE Managing Editor. The manuscript for this paper was submitted for review and possible publication on April 4, 2002; approved on August 23, 2002. This paper is part of the Journal of Architectural Engineering, Vol. 8, No. 4, Decem-ber 1, 2002. ©ASCE, ISSN 1076-0431/2002/4-1–11/$8.001$.50 per page.
PROOF COPY [AE/2002/021983] 007204QAE
~1.25 in.! weld on either side of the strip. The welding quality mainly depends on the temperature, speed, and compacting pres-sure ~weight!.
DSW systems are expected to strengthen the link 2 ~seam! on the force resistance chain. This can increase the wind uplift rating. An experimental program has been completed at the NRC/IRC on a variety of TPO systems to quantify this concept. This paper presents and discusses data from this investigation. All the speci-mens were subjected to the SIGDERS load cycle. By constructing field mock-ups in the DRF, systems with OSW and DSW were tested under dynamic environment. System responses are mea-sured based on three design factors: pressure, force, and deflec-tion. By presenting the comparison between the OSW and DSW systems, the paper quantifies the benefits of DSW systems.
Theory
When roofing systems are subjected to various levels of wind dynamics during their lifetime, wind forces cause membrane bil-lowing and introduce stresses at the attachment locations. In con-ventional roof assembly, wind loads are mainly transmitted in one of two ways. In a mechanically attached system where the fluc-tuation of the external wind pressure is slower than the membrane response time, the wind-induced load will be transmitted through the fasteners to the structural deck. This is known as the structural load path. In the fully bonded system, the load is transmitted through the pneumatic load path—that is, the load is shared among the components ~membrane, insulation, and deck! of the roof system by pressure differences across the components ~Cook
1992!. Since the wind’s effects on the roof systems are dynamic, it is useful to evaluate them using a dynamic procedure.
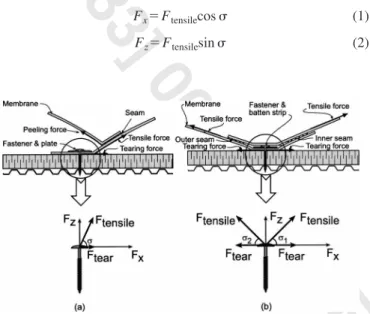
Fig. 2 shows a simplified force diagram of OSW and DSW systems. In OSW systems, tensile forces cause tear forces along the direction of the weld. With a weld on each side of the fastener, tensile forces cause tear forces that are developed along the two opposite directions of the welds. During wind gusting, at a given time these forces can be expressed as follows:
Systems with one-side weld:
Fx5Ftensilecos s (1)
Fz5Ftensilesin s (2)
Fig. 1. Wind effects on single-ply mechanically attached roof assemblies
PROOF COPY [AE/2002/021983] 007204QAE
Systems with double-side weld:
Fx5Ftensilecos s12Ftensilecos s2 (3)
Fz5Ftensilesin s11Ftensilesin s2 (4)
where Fx and Fz 5 the respective horizontal and vertical forces
and s, s1, and s2 are the membrane orientation angles due to
wind uplift.
It is evident from Eq. ~3! that part of the forces developed on the fastener in the horizontal direction for the DSW system can cancel each other because of their quasisymmetrical stress distri-bution pattern. On the other hand, the stress distridistri-bution is asym-metrical in the OSW system. This means that the induced force along the horizontal direction would be higher for the OSW sys-tem than the DSW syssys-tem. Consequently, the degree of fastener being rocked sideways and causing membrane tearing would be reduced by the DSW technology. Data from the present experi-mental investigation confirmed this theory.
Experimental Approach Dynamic Roofing Facility
Experimental work was carried out at the dynamic roofing facility ~DRF! established at the Institute for Research in Construction at the National Research Council of Canada ~IRC/NRC!. The DRF is shown in Fig. 3, and Baskaran and Lei ~1997! document de-tailed facility features. The DRF consists of a bottom frame of adjustable height upon which roof specimens and a movable top chamber are installed. The bottom frame and top chamber are 6,100 mm ~240 in.! long, 2,200 mm ~86 in.! wide, and 800 mm ~32 in.! high. The top chamber is equipped with six windows for viewing and with a gust simulator, which consists of a flap valve connected to a stepping motor through a timing-belt arrangement. Wind suctions as high as 10 kPa ~209 psf! over the roof assembly is produced by a 37 kw ~50 HP! fan with a flow rate of 2,500 L/s ~5,300 cfm!.
A computer uses feedback signals to control the operation of the DRF. The computer regulates the fan speed in order to main-tain the required pressure level in the chamber. Operation of the flap valve simulates the gusts having frequencies range from 0.5 to 5 Hz. Closing the flat valve allows pressure to build in the chamber, and opening the valve bleeds the pressure. A photograph of the DRF during an OSW system installation is shown in Fig. 3. To monitor the response of the roof system, typical design param-eters of pressure, force, and deflection were measured.
Wind Test Protocol
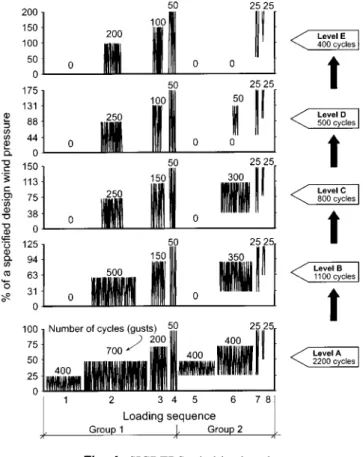
Based on the wind tunnel results, a review of existing standards, and computer simulations, and using DRF, devised a test loading procedure that allows a roofing system to be tested at any design wind pressure ~Baskaran and Chen 1998!. This procedure, repre-sented in Fig. 4, includes eight loading sequences in which a roof system is subjected to simulated gusts. The loading sequences are grouped into five different levels ~Levels A to E!. There are two groups of cycles at each test level: Group 1 cycles, which simu-late wind-induced suction over a roof assembly, and Group 2 cycles, which simulate the effects of exterior wind fluctuations combined with a constant interior pressure on a building. Each group consists of four loading sequences in which the pressure level alternates between zero and a fixed pressure. Allowable in-ternal pressure variations are explicitly specified in recent North American wind standards ~ASCE 1997; NBCC 1995! and are taken into account in the SIGDERS test protocol.
Each loading sequence is performed at a pressure that is a percentage of the design wind pressure stipulated by the building code for a given type of building and a particular location, start-ing with lower pressures and increasstart-ing gradually with each level. For example, the Level A tests include one sequence of 400
Fig. 3. Dynamic roofing facility
PROOF COPY [AE/2002/021983] 007204QAE
cycles ~gusts! at 25% of the design wind pressure, another se-quence of 700 cycles at 50% of the design wind pressure, and so on, for a combined total of 2,200 cycles. To evaluate the ultimate strength of the roofing system, testing begins at Level A. If all the resistance links ~Fig. 1! remain connected, the roof is considered to have ‘‘passed’’ and obtains a rating. Testing then proceeds to the next level, where the pressure is increased ~Fig. 4!.
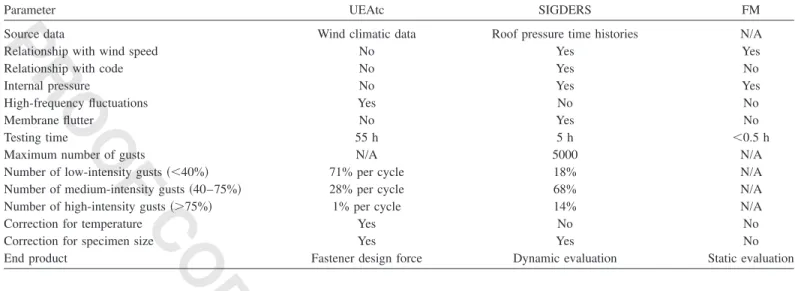
At present, mainly two test standards are being used in North America to assess wind uplift performance of membrane roof systems. They are the Factory Mutual Research _‘‘Approval’’ 1990! and Underwriters Laboratories ~‘‘Standard’’ 1991! test stan-dards. In Europe, Gerhardt and Kramer ~1988! developed the UEAtc 551 test procedure. It is the only available international standard for fatigue evaluation of roof assemblies. The FM, UEAtc, and SIGDERS load cycles were developed under differ-ent environmdiffer-ents and time periods. The general characteristics of these load cycles are grouped in Table 1. A discussion of these features has been published by Baskaran et al. ~1999!. Specifi-cally, the FM test method has the advantage of being simple and quick. An entire test may take less than 10 min to complete. Since, however, the FM procedure applies pressures statistically and not dynamically, its effects on roof systems do not represent the pressures induced by actual wind conditions in the field. The UEAtc load cycle produces failure modes representative of those observed in field conditions, but its major drawback is that it is time-consuming. One cycle with 1,415 gusts takes nearly 3 h to apply, and the UEAtc testing performed by the present study took more than 55 h to complete one system investigation. The SIGDERS load sequence produces failure modes similar to the UEAtc load cycle but takes much less time to complete. The test on the TPO system took less than 5 h to complete.
The tested system consisted of all three main roofing compo-nents, whose general physical and mechanical properties are sum-marized in Table 2.
• Deck: 22-Ga-~0.76 mm!-thick steel deck with a profile height of 38 mm ~1.5 in.! and a flute width of 150 mm ~5.9 in.!. The steel deck was fastened at every flute to the wooden beams of the DRF with size-10 round-head screws. The wooden beams are 152.4 3152.4 mm ~636 in.! in size and spaced 1,829 mm ~72 in.! apart.
• Insulation: 2 Polyisocyanurate ~ISO! boards each of 50 mm thick31,500 mm33,000 mm ~2348396 in.! were mechani-cally attached to the steel deck. Fasteners were 127 mm ~5 in.! long with a plastic plate 76 mm ~3 in.! diameter.
• Membrane: Reinforced TPO membrane sheets were used for both OSW and DSW systems.
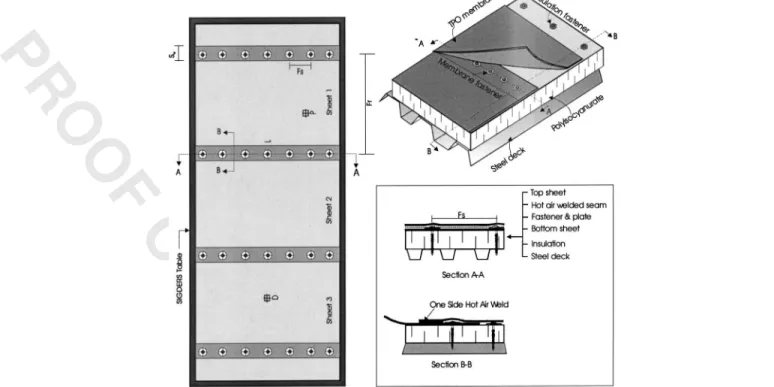
OSW System: Details of the tested OSW system are depicted in Fig. 5. It shows the top view of the test assembly installed in the DRF with three full-width sheets and a dummy sheet at either end. The four seams shown in Fig. 5 indicate the fastener loca-tions. For the tested system, membrane sheets were fastened at 305 mm ~Fs512 in.! spacing along the seam, resulting in seven fasteners per seam. The distance between any two fastener rows is known as fastener rows spacing @Fr 5 1,790 mm ~70.5 in.!# Fas-teners were 127 mm ~5 in.! long with metal plates of 61 mm ~2 3/8 in.! diameter. Fig. 5 also depicts the details of a typical seam. Each seam had an overlap of 111 mm (Sw54
3
8 in.!, with the
fastener placed 38 mm ~1 12in.! from the edge of the under sheet,
and 73 mm ~278in.! from the edge of the overlapping sheet. The
portion of the seam beyond the fastener row was welded with hot air such that a waterproof top surface was obtained. The width of the welded portion varied between 38 and 45 mm ~1 12 in. and 1
3
4in.! P, L, and D represent respectively, pressure, force, and
de-flection measurement locations.
DSW System: The DSW system layouts and component details are the same as those of the OSW system with the exception of seaming. Instead of fastener plates, polymer batten strips 25 mm ~1 in.! wide and 57 mil ~0.057 in.! thick were used. As shown in Fig. 6, the batten strip was continuously placed at the bottom membrane and the system was fastened to the metal deck using mechanical fasteners. These batten strips come with factory-drilled holes 152 mm ~6 in.! apart. Using these preset holes, fas-teners can be installed at 152 mm o/c ~6 in.! or its multiples. To compare the data of DSW with OSW system, the same fastener spacing of 304 mm o/c ~Fs512 in.! was maintained. Similarly, the seam width was also maintained constant at 111 mm (Sw54
3 8in.!
Hot-air process was used to form the seams with 32-mm-~1 12
in.!-wide welds on each side of the batten strip. The fastener row spacing was also maintained at Fr51,790 mm ~70.5 in.!
Result and Discussion OSW System’s Responses
Fig. 7 shows the measured response data for the OSW system. The roof system sustained a maximum pressure of 2.9 kPa ~60
Table 1. Features of SIGDERS, UEAtc, and FM Load Cycles
Parameter UEAtc SIGDERS FM
Source data Wind climatic data Roof pressure time histories N/A
Relationship with wind speed No Yes Yes
Relationship with code No Yes No
Internal pressure No Yes Yes
High-frequency fluctuations Yes No No
Membrane flutter No Yes No
Testing time 55 h 5 h ,0.5 h
Maximum number of gusts N/A 5000 N/A
Number of low-intensity gusts ~,40%! 71% per cycle 18% N/A
Number of medium-intensity gusts ~40–75%! 28% per cycle 68% N/A
Number of high-intensity gusts ~.75%! 1% per cycle 14% N/A
Correction for temperature Yes No No
Correction for specimen size Yes Yes No
PROOF COPY [AE/2002/021983] 007204QAE
psf! and passed all eight steps of Level A of the SIGDERS test. This means that the system configuration passed the gusts applied over a constant static pressure component in Group 2 ~refer to Fig. 4!, as well as those in Group 1. When the applied pressure was 3.6 kPa ~75 psf!, the system failed at the loading sequence 4 during gust number 12. The maximum sustained fastener force at the location L ~see Fig. 5! was about 1,223 N ~278 lbf!. This was measured at the sequence 4 of the Level A.
Measured membrane deflection at the center ~Fig. 5! of the 1,902-mm-~75 in.!-wide sheet is also shown in Fig. 7. Each se-quence has a minimum and maximum deflection value. Except for sequence 1, the minimum deflection is always greater than zero, because the membrane has already been stretched by the previous sequence. Moreover, for loading sequences 5 to 8 ~Group 2!, the membrane was lifted and gusts were imposed over a static component. This induces membrane stretching to a greater degree than Group 1. The maximum sustained membrane
deflec-tion was about 175 mm ~6.9 in.! for Group 1 during loading sequence 4 and about 183 mm ~7.2 in.! for Group 2 during load-ing sequence 8.
The system failed when the membrane tore around the fastener plate. Examination of the failure at seam #2 showed that the membrane had been stretched around the plate and then torn com-pletely away from around the plate, while the fasteners remained engaged with the deck. There was also an instance of delamina-tion failure, as the membrane peeled slightly at one fastener lo-cation. Fig. 8 shows a typical example of the failure mode. Ex-amination of the system’s seams after the test revealed that the membrane had experienced some stretching, and bore teeth marks from the metal fastener plates. This is similar to field observations of roof failures.
Kramer ~1994, 1995! quoted the most commonly observed failure for membrane roofs as ‘‘slippage of roof membrane from below attachment plate leading to loss of compression between
Table 2. Nominal Physical and Mechanical Properties of Components
Deck
Type Profiled metal sheeting 22-gauge
Thickness 0.76 mm ~0.030 in.!
Depth 38 mm ~1.5 in.!
Flute Spacing 150 mm ~5.9 in.!
Fastener Pullout as per ANSI/SPRI FX-1-1996 2120 N ~470 lbf!
Insulation
Type Polyiso
Dimension 2 boards of 1218 mm 3 2436 mm ~4 in. 3 8 in.! 3
50.8 mm thick ~2 in.!
Compressive Strength as per ASTM D1621-94 130 kPa ~18.8 psi!
Insulation Attachment
Type Mechanical fasteners with plates
Fastener Assembled 128 mm ~5 in.! screws & plates
Plate 77 mm ~3 in.! plastic lock plate
Fastening Pattern 4 fasteners per board
AirÕVapor BarrierÕRetarders
None used
Membrane
Type TPO
Width 1902 mm ~7478in.!
Thickness 45 mil ~0.045 in.!
Tensile property as per ASTM D 751-98 ~Grab! MD XD
Breaking strength, kN ~lbf! 1.3 ~293! 1.1 ~248! Elongation at Max. load, % 29 29
Membrane Attachment
Type Mechanical fasteners with Plates or Batten
Fastener 128 mm ~5 in.! #15
Plate 61 mm ~238in.! Dia. metal plate
Batten Strip 25.4 mm ~1 in.! wide, 1.45 mm ~0.057 in.! thick
Fastener Row Spacing 1790 mm ~7012in.!
Fastener Spacing 305 mm ~12 in.!
Seam
Type Hot air welding
Seaming Overlap: 111 mm ~4 38in.!
Type: One Side Weld or Double Side Weld Temperature: 950 °C ~510 °C!
Weld Condition Speed: 2.4m/min ~7.9 ft/min!
PROOF COPY [AE/2002/021983] 007204QAE
roof membrane, insulation substrate, and fastening elements and ultimately to membrane failure by way of tear spread around the fastener shaft.’’ This observation coincides with the SIGDERS failure mode and indicates that the SIGDERS load cycle is induc-ing wind fatigues on roof systems. Previous tests conducted usinduc-ing the FM static procedure, however, did not produce this effect on
the membrane, and therefore did not reveal the weakest link of the system’s wind-uplift resistance ~Baskaran et al. 1999!.
To validate the above findings, a second specimen ~OSW2! was tested with one-side weld configuration. Such components as the membrane, insulation fastener and plates, and membrane fas-tener and plates ~as shown in Fig. 5!, with similar physical and
Fig. 5. Layout and sectional view of tested roof assembly with OSW
PROOF COPY [AE/2002/021983] 007204QAE
mechanical properties ~Table 2!, were used for the reproducibility tests. However, OSW2 components were not from the same batch of the manufacturing process. Every effort was also made to have identical system layouts and instrument locations. Moreover, the
same roof installer was engaged to install the OSW2 specimen on the DRF.
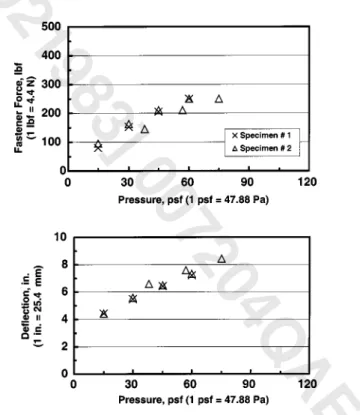
A comparison of the OSW1 and OSW2 is performed in Fig. 9 for the measured deflection and force data. These data correspond to the Group 1 load sequences of the SIGDERS load cycle. The graph indicates that the measured fastener forces from OSW1 system compare favorably with those from the OSW2 system, although the OSW2 shows slightly higher forces at the same pres-sure level. To quantify the difference between OSW1 and OSW2, deflection and force data pairs are selected. The mean difference is calculated as follows: D5
(
i51 nH
R1i2R2i R1iJ
3100 (5) where R1i 5 measured response ~fastener force or deflection!from OSW1 at a given applied pressure; R2i 5 measured re-sponse ~fastener force or deflection! from OSW2 at a given ap-plied pressure; n 5 number of pressure increments on the SIGDERS load cycle; and d 5 mean deviation ~%!. The mean
Fig. 7. Measured response of OSW system
Fig. 8. Failure mode of OSW system
PROOF COPY [AE/2002/021983] 007204QAE
difference is about 6% for the measured fastener force. At the membrane central location where the maximum deflections are expected, the mean difference for deflection is only 1%. A com-parison of this nature clearly reveals that the system responses are reproducible for experiments conducted at the DRF.
DSW System’s Responses
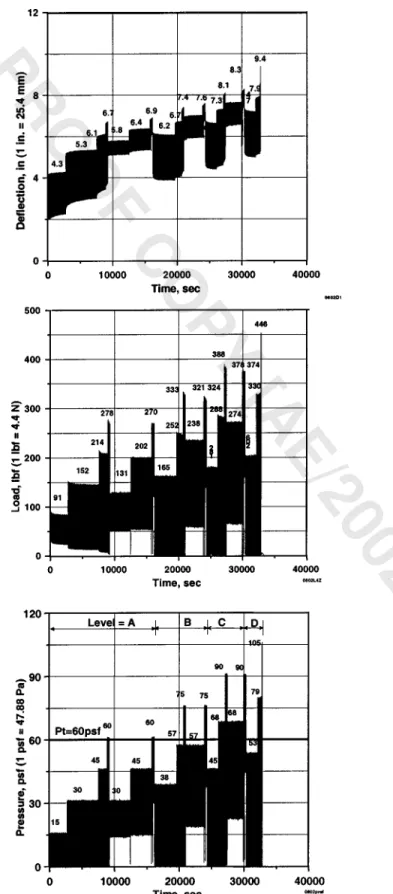
Fig. 10 presents the measured response of the DSW system in a format similar to that of Fig. 8. Several factors are evident from the figure, some of which are mentioned below:
• The DSW system sustained a pressure of 4.3 kPa ~90 psf! and failed at 5 kPa ~105 psf!. It passed all the gusts from Level A to C of the SIGDERS load cycle. Note that the OSW system passed only the Level A.
• Maximum measured fastener force at the sustained pressure was 1,707 N ~388 lbf!. This is about 40% higher than the OSW system’s 1,223 N ~278 lbf!.
• The sustained deflection of DSW system was 210 mm ~8.3 in.!, slightly higher than the OSW’s 206 mm ~8.1 in.!. How-ever, the maximum deflection of the DSW occurred under a much higher pressure.
Of particular interest is the failure mode observation of the DSW system. Fig. 11 shows an inverted view of a failed seam. Fastener pullout was the only observed failure mode. Neither the seam nor the membrane was damaged by the wind gusts. In com-paring the failure mode of the DSW system with the OSW sys-tem, the theoretical concepts presented are found be true. In other words, the DSW transforms force to the deck through a structural load path with minimal asymmetrical forces. ~This is further dis-cussed under Fig. 15, where the measured fastener horizontal forces are compared.!
The fastener pullout failure mode indicates that the weakest link was the fastener engagement with the deck. There are two ways to strengthen this link. The first is to use a high-tensile-strength deck, and second, to adapt a fastener that has a differ-ently engineered thread design. In terms of the latter, the present study used #15 fasteners ~Table 2!, which is one of the high-end fasteners in the industry for roofing applications. To avoid the observed weakest link, the experiment was repeated by using a high-tensile-strength deck.
By maintaining all other parameters constant to that of the tested DSW system ~DSW1!, metal decks with minimum 551 Mpa ~80 ksi! tensile strength were used to construct a new mock-up ~DSW2!. The DSW1 decks had a tensile strength of minimum 30 ksi ~207 Mpa!. The tensile strength values were not measured in the present study. They are reported as specified by the manufacture in accordance with the ASTM A 653 specifica-tion for the metal decks. However, pullout tests were carried out as part of this present study. With a #15 fastener, the pullout resistance with the 207 Mpa ~30 ksi! deck was 2,068 N ~470 lbf! and that with 551 Mpa ~80 ksi! deck was 3,036 N ~690 lbf!.
Fig. 10. Measured response of DSW system
PROOF COPY [AE/2002/021983] 007204QAE
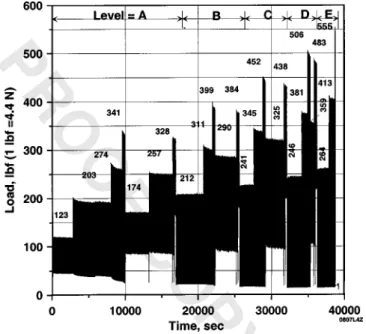
The DSW2 system sustained a pressure of 5 kPa ~105 psf! and failed at 5.7 kPa ~120 psf!. As shown in Fig. 12, the system passed all the applied gusts from Level A to D, and the maximum measured fastener force at Level D was 2,226 N ~506 lbf!. At Level E, the system failed during sequence number 4. Thus, using a 551 Mpa ~80 ksi! deck increased the system rating by 0.7 kPa ~15psf! by strengthening the engagement between the deck and fasteners.
Data from the DSW2 system can also be used to validate the reproducibility of the DSW1 test. The measured fastener forces and membrane deflections are compared between DSW1 and DSW2 at various pressure levels, in Fig. 13. The mean difference
calculated using Eq. ~4! is 5% for the fastener force and 1% for the membrane deflection. A comparison of this nature clearly re-veals that the predicted system responses are similar among the DSW1 and DSW2 systems.
To evaluate the full potential of the DSW system, mock-ups with asymmetrical membrane layouts were constructed for ex-tended investigations. A typical situation is shown in Fig. 14. Low slope roofs are, conventionally, divided into zones of corner, edge/perimeter, and field. This is a design procedure followed for wind load calculation to differentiate the high-suction corner
Fig. 13. Reproducibility test response of DSW system
Fig. 14. Layout of DSW system for simulating asymmetrical loading
PROOF COPY [AE/2002/021983] 007204QAE
zones from the moderate field zones. So in construction, narrow membrane sheets are used at the high-wind-suction zones. Typi-cally, full-width sheets are used at the field zones and narrow sheets are used for the perimeter zones. When wind gusts over the roof different billowing shapes can occur due to variation in the membrane width, as shown in Fig. 14. This can induce asym-metrical forces at the fastener attachment locations. In the OSW system, these asymmetrical forces are in addition to that due to seaming, and it can demand high resistance among the various component links.
To quantify how much the DSW can minimize the discussed asymmetrical forces, additional experiments were carried out on OSW and DSW systems with the layout shown in Fig. 14. All other parameters were kept the same as before. Table 3 summa-rizes the system response from all the tests. For the OSW system the 60/75 in the pressure column means the system sustained a pressure of 2.9 kPa ~60 psf! and failed at 3.6 kPa ~75 psf!. Note that DSW system did not fail at 5.7 kPa ~120 psf!. The test was terminated because 5.7 kPa ~120 psf! is the maximum attainable pressure at Level E when 2.9 kPa ~60 psf! is applied at Level A. The symmetrical DSW system failed at 5.7 kPa ~120 psf! ap-parently because it had fewer fastener seams in the test mock-up—4 seams with 28 fasteners, compared with 5 seams and 35 fasteners of the asymmetrical system. Increase in attachment lo-cation is also true in the case of the OSW systems. However, a higher number of fasteners did not help the OSW system as the
failure mode of the OSW systems was membrane tear and in-crease in the number of fastener attachments cannot elevate this weakest link. Data presented in the Table 3 further encourages the application of the DSW seam technology.
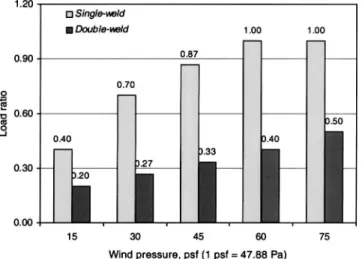
During the wind uplift testing, induced fastener forces were measured using a force balance specially developed at the NRC. The force balance has the capacity to measure simultaneously both vertical and horizontal forces. As discussed, one should ex-pect reduction in the horizontal force for systems with DSW seams. This theoretical concept has also been verified by the present study. For the horizontal component, comparisons be-tween the OSW and DSW systems are shown in Fig. 15. They are presented as ratios at different pressures. These ratios are obtained by dividing measured force at each loading sequence with the maximum measured force from the OSW system. The data indi-cate that the horizontal forces were reduced by about 50% be-cause of the double-side welding technology. This is due to the force transfer mechanism of the batten strips in the DSW systems, as explained below. The stress distribution along the mechanically fastened seams is different between the two systems when wind suctions are applied. In the DSW systems, the batten strips can spread the wind uplift along the length of the seam rather than localizing it at the fasteners or in the membrane around the vicin-ity of the fastener plates. On the other hand, in an OSW system the stress localization causes either an early fastener pullout if the membrane is strong enough, or membrane tearing around the plates.
Conclusions
Based on the presented results and discussions, the following con-clusions can be drawn:
• Double-side weld systems performed better than the systems with one-side weld. An improvement of about 50% was mea-sured in the wind uplift rating. This is found true for all the response comparisons between one-side weld systems with double-side weld systems.
• Use of double-side weld minimized stress concentration at the fastener attachment locations of mechanically attached TPO roofing systems. During the failure mode investigation, neither the seam delamination nor the membrane tear was observed in the double-side weld systems. Use of high-tensile-steel deck increased the wind uplift rating.
• Data from reproducibility tests also validated the above obser-vations.
Fig. 15. Comparisons of fastener force at X direction between OSW
and DSW system
Table 3. Comparison of System Performance of OSW with DSW Systems
Type System
Pressurea Fastener Forcea
Membrane Deflectiona
Failure Mode
psf Pa lbf N in. mm
Symmetrical Membrane
OSW 60/75 2900/3600 278/255 1223/1122 7.7/8.4 195/213 delamination and tear at B4 DSW 105/120 5000/5700 506/555 2226/2442 9.2/9.4 233/238 Fastener pullout
Asymmetrical Membrane
OSW 60/75 2900/3600 273/213 1201/937 6.9/7.4 175/188 delamination and tear at B4
DSW 120/X 5700/X 500/X 2200/X 9.7/X 246/X Passed 120 psf
PROOF COPY [AE/2002/021983] 007204QAE
• One of the most common layouts from field application was constructed and tested in the lab mock-up. Therefore, theabove double-side weld concept may also be valid for other roof assemblies with thermoplastic membrane, such as the PVC.
• The SIGDERS test protocol used in this study is able to repro-duce known failure modes and has potential to replace current certification tests. However, to have a fully quantitative accep-tance of the SIGDERS test protocol, it is necessary to bench-mark the test data with those obtained from full-scale data ~for example, duplicate a failure observed during a real windstorm where the speed is known!. Being involved in a wind investi-gation program ~Baskaran et al. 1997!, the writer would appre-ciate receiving such data from the readers.
Acknowledgment
The writer acknowledges GenFlex Roofing Systems for their sup-port. The writer also appreciates David Scott, of GenFlex Roofing Systems, and William Lei, of NRC, for the system installation. Analyses of the experimental data were, partially, carried out by Gordon Xu, an Industrial Research Fellow at NRC.
References
ASCE. ~1997!. ‘‘Minimum design loads for buildings and other struc-tures.’’ ASCE Standard 7-95, American Society of Civil Engineers, Reston, Va., P. 13.
ASTM A 653. ‘‘Standard specification for steel sheet, zinc coated ~galva-nized! or zinc-iron-alloy-coated ~galva~galva-nized! by the hot dip process.’’ ASTM, West Conshohocken, Pa.
Baskaran, A., and Xu, G. ~2001!. ‘‘Wind uplift rating of TPO systems: New data confirm the theory of double-side weld technology.’’ Jour-nal of Roof Consultants Institute-Interface1, 10–13.
Baskaran, A., Lei, W., and Richardson, C. ~1999!. ‘‘Dynamic evaluation of thermoplastic roofing system for wind performance.’’ J. Archit. Eng.5~1!, 16 –24.
Baskaran, A., and Chen, Y. ~1998!. ‘‘Wind load cycle development for evaluating mechanically attached single ply roofs.’’ J. Wind. Eng. Ind. Aerodyn.77–78, 83–96.
Baskaran, A., Desjariais, A., Roodvoets, D., and Wood-Shields, P. ~1997!. ‘‘Strategic plan for the wind event investigation program.’’ 8th U.S. Wind Engineering Conference1–5.
Baskaran, A., and Lei, W. ~1997!. ‘‘A new facility for dynamic wind performance evaluation of roofing systems.’’ Proc., 4th International Symposium on Roofing Technology, NRCA/NIST, Washington, D.C., 168 –179.
Beer, H. R. ~1997!. ‘‘Longevity and ecology of polyolefin roof mem-branes.’’ Proc., 4th International Symposium on Roofing Technology, NRCA/NIST, Washington, D.C., 14 –21.
Cook, N. J. ~1992!. ‘‘Dynamic response of single-ply membrane roofing systems.’’ J. Wind. Eng. Ind. Aerodyn. 41– 44, 1525–1536.
~1990!. ‘‘Approval standard: Class I roof covers ~4470!.’’ Factory Mutual Research, Norwood, Norwood, Mass.
Gerhardt, H. J. ~1989!. ‘‘Roofing membrane—observed damage, failure modes, failure hypotheses and laboratory testing.’’ Proc., Roofing Wind Uplift Testing Workshop, 19–34.
Gerhardt, H. J., and Kramer, C. ~1988!. ‘‘Wind loading and fatigue be-havior of fixings and bonding of roof coverings.’’ J. Wind. Eng. Ind. Aerodyn.23, 237–247.
Kramer, C. ~1994!. ‘‘Damage and damage analysis of roofing system for large industrial flat roof building.’’ Proc., International Conference on Building Envelope Systems and Technology, Nanyang Technological University, Singapore, 573–578.
Kramer, C. ~1995!. ‘‘Typical failure modes of building envelopes.’’ Proc., 9th International Conference on Wind Engineering,1231–1242. NBCC. ~1995!. ‘‘National building code of Canada.’’ National Research
Council of Canada, Ottawa, Canada, 145.
Russo, M. ~1998!. ‘‘Make room for the wide weld.’’ Roofing Sliding Insulation75~8!, 17-1.
Standard for uplift pressure of roof assemblies (UL 580). ~1991! 3rd Ed., Underwriters Laboratories, Inc.