Publisher’s version / Version de l'éditeur:
Journal of Polymer Science Part B: Polymer Physics, 32, 15, pp. 2549-2553,
1994-11-30
READ THESE TERMS AND CONDITIONS CAREFULLY BEFORE USING THIS WEBSITE. https://nrc-publications.canada.ca/eng/copyright
Vous avez des questions? Nous pouvons vous aider. Pour communiquer directement avec un auteur, consultez la première page de la revue dans laquelle son article a été publié afin de trouver ses coordonnées. Si vous n’arrivez pas à les repérer, communiquez avec nous à [email protected].
Questions? Contact the NRC Publications Archive team at
[email protected]. If you wish to email the authors directly, please see the first page of the publication for their contact information.
NRC Publications Archive
Archives des publications du CNRC
This publication could be one of several versions: author’s original, accepted manuscript or the publisher’s version. / La version de cette publication peut être l’une des suivantes : la version prépublication de l’auteur, la version acceptée du manuscrit ou la version de l’éditeur.
For the publisher’s version, please access the DOI link below./ Pour consulter la version de l’éditeur, utilisez le lien DOI ci-dessous.
https://doi.org/10.1002/polb.1994.090321512
Access and use of this website and the material on it are subject to the Terms and Conditions set forth at
On the plasticization of poly(2,6-dimethyl phenylene oxide) by CO
₂
Handa, Y. Paul; Lampron, Steeve; O'Neill, Mark L.
https://publications-cnrc.canada.ca/fra/droits
L’accès à ce site Web et l’utilisation de son contenu sont assujettis aux conditions présentées dans le site LISEZ CES CONDITIONS ATTENTIVEMENT AVANT D’UTILISER CE SITE WEB.
NRC Publications Record / Notice d'Archives des publications de CNRC:
https://nrc-publications.canada.ca/eng/view/object/?id=92b743c0-a659-420d-885b-3170a18121d1 https://publications-cnrc.canada.ca/fra/voir/objet/?id=92b743c0-a659-420d-885b-3170a18121d1O n the Plasticization of Poly
(
zyxwvutsrqponmlkjihgfedcbaZYXWVUTSRQPONMLKJIHGFEDCBA
2,6=dimethyl phenylene
oxide)+
by
CO,
Y. PAUL H A N D A , " STEEVE LAMPRON, and M A R K 1. O'NEILL
Institute for Environmental Research and Technology, National Research Council of Canada, Ottawa, Ontario, Canada K1 A OR6
SYNOPSIS
zyxwvutsrqponmlkjihgfedcbaZYXWVUTSRQPONMLKJIHGFEDCBA
Change in the glass transition temperature,
zyxwvutsrqponmlkjihgfedcbaZYXWVUTSRQPONMLKJIHGFEDCBA
T g , of poly( 2,6-dimethyl phenylene oxide),PPO, due to the dissolved
zyxwvutsrqponmlkjihgfedcbaZYXWVUTSRQPONMLKJIHGFEDCBA
COP has been measured as a function of the gas pressure, p ,using a high-pressure DSC cell. At
zyxwvutsrqponmlkjihgfedcbaZYXWVUTSRQPONMLKJIHGFEDCBA
61.2 atm, the highest pressure studied, Tg is depressed by 31.6"C. The depression in Tg is found to be linear with pressure, with d T g / d p of -0.5"Catm-'. The experimental results are in fair agreement with those calculated from a quasi- lattice solid-solution model for polymer-diluent systems. The present results, however, differ markedly from a recent investigation on PPO-COP system which reported a depression
in Tg of 226°C a t 60 atm and a d T g / d p of -3.8"C atm-'.
zyxwvutsrqponmlkjihgfedcbaZYXWVUTSRQPONMLKJIHGFEDCBA
0 1994 John Wiley & Sons, Inc.Keywords: plasticization poly (2,6-dimethyl phenylene oxide) PPO-CO, glass transition
INTRODUCTION
The plasticization of polymers by compressed gases has been the subject of a number of recent investi- gations.'-' There are a number of applications in which we encounter polymer-gas systems. These in- clude formation of microcellular plastics
''
and foams, l1 extraction" from and impregnation l3 intopolymers of additives using supercritical fluids, and gas separation membranes.14 In all these applica- tions, it is important to know the temperature, T, and pressure, p , conditions under which the polymer gets plasticized. In the case of gas separation mem- branes, the plasticization renders the membrane useless as it loses most of its perm~electivity.'~~'~ Consequently, a knowledge of the change in the glass
transition temperature,
zyxwvutsrqponmlkjihgfedcbaZYXWVUTSRQPONMLKJIHGFEDCBA
Tg,
of the polymer as a function of the gas pressure helps define the T - pwindow within which the membrane will give an op- timum performance.
Compressed gases like C 0 2 , N20, and C2H4 can dissolve to appreciable levels in polymers causing depression in Tg by tens of Recently Hachisuka et al.4 reported a remarkable plasticiza-
'
Issued as NRCC No. 37569.* To whom all correspondence should be addressed.
Journal of Polymer Science: P a r t B: Polymer Physics, Vol. 32,2549-2553 (1994)
zyxwvutsrqponmlkjihgfedcbaZYXWVUTSRQPONMLKJIHGFEDCBA
0 1994 John Wiley &
zyxwvutsrqponmlkjihgfedcbaZYXWVUTSRQPONMLKJIHGFEDCBA
Sons, Inc. CCC 0887-6266/94/152549-05tion effect of C 0 2 on poly ( 2,6-dimethyl phenylene oxide), PPO, where
Tg
is depressed by 226°C at a gas pressure of 60 atm. In gas separation membranes, plasticization effects are usually observed as anom- alous sorption and permeation during measurements at elevated pressure^.^^,^^ Sorption and permeation of several gases, including C o n , through PPO mem- branes has been investigated at 35°C and pressures to 26 atm.'8-20 No plasticization effects have been observed in these studies; in fact, PPO performs quite well for separating C02-CHI mixtures at pressures to 26 atm. In the light of the C02-induced plasticization effect reported by Hachisuka et al., PPO would not be expected to function as an effi- cient separation-membrane a t higher pressures where membranes actually are used in practice. This, combined with the rather very strong plasticization effect reported by Hachisuka et al., has led us to reinvestigate the effect of compressed C 0 2 onTg
of PPO.
A variety of techniques have been used to deter- mine compressed-gas-induced plasticization effects. Some techniques like NMR, 21 dielectric relaxa-
tion, 22,23 and gas sorption, and permeation l6 provide
mostly an indirect evidence of plasticization in the sense that either the thermodynamic state of the system or the glass
+
rubber transition point is not well defined. Quantitative information on the change2550
zyxwvutsrqponmlkjihgfedcbaZYXWVUTSRQPONMLKJIHGFEDCBA
HANDA, LAMPRON, AND O'NEILLin
zyxwvutsrqponmlkjihgfedcbaZYXWVUTSRQPONMLKJIHGFEDCBA
T, of a polymer when contacted with a high pres-sure gas was obtained by Chiou et a1.' by equili- brating the polymer with the gas and then scanning the polymer-gas solid-solution in a DSC under am- bient pressure, assuming that the solubility of the gas in the polymer did not change much during Sam- ple handling and during the scan. Hachisuka et al.4
also used differential scanning calorimetry
zyxwvutsrqponmlkjihgfedcbaZYXWVUTSRQPONMLKJIHGFEDCBA
( DSC ) with high pressure pans containing PPO-CO, mix-ture under pressure. High-pressure static creep compliance measurements were used by a few
investigators 1,624
zyxwvutsrqponmlkjihgfedcbaZYXWVUTSRQPONMLKJIHGFEDCBA
to establish the T,-p profiles. Re-cently, Handa et al.' and O'Neill and Handa17 used a high-pressure heat-flow calorimeter to make in situ measurements of the change in T, as a function of
the gas pressure. The results were found to agree with those obtained by ambient pressure DSC' and high-pressure creep compliance measurements.',6 In this work, we used a high-pressure DSC cell for es- tablishing the T,-p profile in PPO-CO, system. This technique was chosen over our high-pressure heat- flow calorimeter because only a limited quantity of P P O was available to us and also because the tem-
perature range of our calorimeter is 190°C whereas
zyxwvutsrqponmlkjihgfedcbaZYXWVUTSRQPONMLKJIHGFEDCBA
Tg of P P O is over 210°C. However, the methodology
used was the same as that developed for our high
pressure calorimeter.
zyxwvutsrqponmlkjihgfedcbaZYXWVUTSRQPONMLKJIHGFEDCBA
EXPERIMENTAL
P P O (General Electric) was in the form of a fine powder. It was used as such for some measurements and pressed as a pellet for other measurements. The sample size was about 8 mg when used as powder and about 16 mg when used as pellet. Bone dry CO, of minimum purity 99.8% was obtained from Matheson.
A 2910 DSC coupled to a 2100 Operating System ( T A Instruments) was used. The glass transition temperature of PPO, Tgo, was obtained by heating the powder sample in a regular DSC cell to 240"C, quenching it to room temperature using ice-cold wa- ter, and then scanning it at 10°C min-' under a dry nitrogen flow of 50 ml min-l. The DSC was then equipped with a high-pressure cellz5 from T A In-
struments, PDSC, for making
zyxwvutsrqponmlkjihgfedcbaZYXWVUTSRQPONMLKJIHGFEDCBA
Tg
measurements on the PPO-CO, system. The PDSC is simply the reg-ular DSC cell enclosed in a pressure vessel. Mea- surements a t elevated pressures are made by filling the pressure vessel with the compressed gas. In these measurements, not only the sample but the entire cell is subjected to the gas pressure. The PDSC is
rated for use at pressures to about 70 atm. However, with low-pressure COz, it was found that the baseline was a bit noisy and had a slight curvature to it. These baseline characteristics became worse with pressure and at ca. 55 atm, the baseline had extensive noise and the curvature also became quite amplified. For- tunately, these characteristics were dominant only at temperatures to ca. 150°C beyond which, the temperature range of interest for the present appli- cation, the cell performed reasonably well. Baseline calibrations at temperatures to 250°C were first performed at CO, pressures of 13.6, 27.2, 40.8, and 54.4 atm, using two empty hermetically sealed pans with holes punched in the center of the lids. After baseline calibrations, the sample-side pan was re- placed with one containing a P P O pellet and a hole punched in the center of the lid. The sample was heated to a temperature about 10°C above Tgo, the cell pressurized with CO, to 13.6 atm, kept at this temperature for 10 min, and then cooled to room temperature by placing ice packs on and around the cell. The sample was then scanned at 10 or 20°C min-' to a temperature about 10°C above the new
T,. The COP pressure was then increased to 27.2
atm and the new Tg determined as before. This pro-
cedure was repeated at 40.8 and 54.4 atm. The pres- sure was then decreased in steps of 13.6 atm and T,
measurements made again a t 40.8, 27.2, and 13.6
atm. The two sets of measurements gave Tg)s, at the
corresponding pressures, to within +0.4"C. It should be noted that before starting a scan at each pressure, the DSC was programmed with the baseline Cali- bration parameters pertaining to that pressure.
A few measurements were also made at 34.0,54.4, and 61.2 atm. For these, P P O was used in the powder form, a fresh sample was used at each pressure, and the baseline calibration parameters were obtained by interpolating or extrapolating the calibration pa- rameters determined above. Also, for these mea- surements, the cell was first pressurized, then heated to about 10°C above the estimated T,, and the poly- mer-gas system allowed to equilibrate for 10 min. The cell was then cooled back to room temperature and then scanned at 10°C min-', and the
T,
deter- mined from the second scan.It should be noted that in all the measurements, care was taken to avoid cooling the cell to a tem- perature below the condensation temperature of the gas. Also, the pressure in the cell increased during the scan. For this reason, the pressure was always adjusted a t ca. 10°C above
T,
so that during the scan the pressure in the system, at the transition event, was almost the same as the nominal pressure.PLASTICIZATION OF P P O BY C 0 2
zyxwvutsrqponmlkjihgfedcbaZYXWVUTSRQPONMLKJIHGFEDCBA
2551zyxwvutsrqponmlkjihgfedcbaZYXWVUTSRQPONMLKJIHGFEDCBA
RESULTS AND DISCUSSION
Some representative DSC outputs at various pres- sures are shown in Figure 1. The output signals are normalized to unit mass of PPO; however, they have been shifted vertically for the sake of clarity. Despite the rather higher noise level than usually observed in normal DSC scans, the glass transition step is
well resolved.
zyxwvutsrqponmlkjihgfedcbaZYXWVUTSRQPONMLKJIHGFEDCBA
Tg was taken as the temperature a tthe midpoint of the step. The results on the change
in
Tg
zyxwvutsrqponmlkjihgfedcbaZYXWVUTSRQPONMLKJIHGFEDCBA
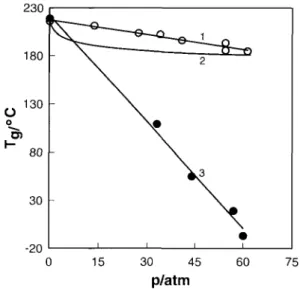
of PPO as a function of COz pressure are givenin Table I and shown in Figure 2. The results from the present work are shown by the hollow symbols; a line is drawn through the points to aid the eye. There is good agreement between the measurements made on the pellet and the powder samples.
The results of Hachisuka et al.4 are shown in Fig- ure 2 by the filled circles, and again a line is drawn through the points to aid the eye. There is a large disparity between the two sets of results. The present results show that there is only a slight decrease in
Tg of PPO a t pressures to 60 atm whereas the lit- erature values show a very strong plasticization ef-
fect. Our results give a value of -0.5"C atm-' for
zyxwvutsrqponmlkjihgfedcbaZYXWVUTSRQPONMLKJIHGFEDCBA
d T g / d p and those of Hachisuka et al. a value of
-3.8"C atm-'. For comparison, values of -0.2"C atm-' for polystyrene-CH4 and -0.9"C atm-' for polystyrene-COZ and polystyrene-ethylene systems have been reported p r e v i ~ u s l y . ' , ~ ~ ' ~ At higher gas pressures, an effect opposite to plasticization comes into play due to the hydrostatic pressure exerted by the gas. Thus, a t higher COz pressures, Tg of PPO is not expected to drop any more than what is al-
Oatm 1 3 . 6 a l m
zyxwvutsrqponmlkjihgfedcbaZYXWVUTSRQPONMLKJIHGFEDCBA
\
40.8 alm 61.2 alm 140 160 180 200 220 240 TernperatureP CzyxwvutsrqponmlkjihgfedcbaZYXWVUTSRQPONMLKJIHGFEDCBA
Figure 1. pressures.PDSC scans for PPO-C02 a t various gas-
Table I.
Various Gas-Pressures
Tg Values for the PPO-C02 System a t 0.0 13.6 27.2 34.0" 40.8 54.4 54.4" 61.2" 216.0 211.4 203.6 202.1 195.8 185.2 193.0 184.4
a Sample used in powder form; used as a pellet for the other
measurements.
ready shown by our results in Figure 1 because any further decrease in Tg due to the elevated pressure
would be offset by an increase in Tg due to the hy-
drostatic effect. This cancellation of the plastici- zation effect by the hydrostatic effect has been ob- served previ~usly.'~'~ Thus, we do not anticipate to see a strong plasticization effect as reported by Hachisuka et al.
There is a significant difference in the way PPO
was conditioned in the two experimental studies. Our approach has been to maintain the polymer- gas equilibrium over the temperature range of the scan, taking care to avoid any condensed phase of the The approach used by Hachisuka et al. was to seal PPO and an appropriate amount of dry
230 180 130
zyxwvutsrqponmlkjihgfedcbaZYXWVUTSRQPONMLKJIHGFEDCBA
0 . m I- 80 30 -20 0 0 15 30 45 60 75 p/a t mFigure 2. Change in Tg of P P O as a function of the gas pressure. 0-this work; 0-Hachisuka e t al.4 Curves 1
and 3 are drawn through the data points to aid the eye; curve 2 is calculated from eqs. ( 1 ) - ( 3 )
.
2552 HANDA, LAMPRON, AND O'NEILL
ice in a DSC pan, equilibrate the system at 25"C, quench it to -6OoC, and then scan it from -50°C. The pressure generated by COP was calculated from an equation of state. However, a t -5O"C, the satu- ration vapor pressure of C 0 2 isz6 6.8 atm and, there- fore, all their scans started with PPO in contact with liquid COP. The presence of a condensed phase com- plicates DSC measurements in that the DSC output becomes quite erratic. In Hachisuka et al.'s work, the DSC output showed a number of steps indicating that a true PPO-COp equilibrium among various phases of CO, and between PPO and COP was not established. For such outputs, the choice of a step as glass transition becomes somewhat subjective.
Furthermore, the authors reported
zyxwvutsrqponmlkjihgfedcbaZYXWVUTSRQPONMLKJIHGFEDCBA
T,s of 19 and -7°C a t 57 and 60 atm, respectively, conditions un-der which C 0 2 exists as a liquid.26 Thus, it appears that the state of the system was not well defined in their study. From the information available in Hachisuka et al., it cannot be ascertained whether the transitions reported by them refer to PPO with much higher loadings of C02 than possible with C 0 2 in the supercritical state.
proposed a relationship to account for the change in T, of polymers due to sorbed vapors or liquids. Later on, this relationship was shown by Chiou et a1.2 to apply equally well to polymer-gas systems. Recently, a number of models7" have been proposed to explain the plasticization effects of compressed gases and the rather complex phase be- havior observed when Tg of the polymer is depressed to the critical temperature, T,, of the compressed
fluid. However, if (Tg0 -
zyxwvutsrqponmlkjihgfedcbaZYXWVUTSRQPONMLKJIHGFEDCBA
T,) is large then Chow'ssimple model works as well as the more sophisticated recent In the light of the large disparity between the two sets of measurements in Figure 2, our intent here is to show what the T,-p profile for PPO-C02 would be and not to go into a detailed analysis of the results. For this purpose, we can use the simple model proposed by Chow. According to this model,
1n(T,/Tgo) = p [ e l n e + ( l - B ) l n ( l - 8 ) ] (1)
( 3 ) where Mp and Md are the molar masses of the poly- mer repeat unit and the gas, respectively, R is the
gas constant, AC, is the heat capacity change as-
sociated with the glass transition of the pure poly-
mer,
zyxwvutsrqponmlkjihgfedcbaZYXWVUTSRQPONMLKJIHGFEDCBA
w is the gas solubility in the polymer, and z is the lattice coordination number that depends on thesizes of the gas molecule and the polymer repeat
unit. The calculated Tgs using AC, =
zyxwvutsrqponmlkjihgfedcbaZYXWVUTSRQPONMLKJIHGFEDCBA
0.265 J K-' g-' reported by Karasz et al.29 and the gas solubilitiesby Chern et al." are shown by curve 2 in Figure 2. Chiou et a1.2 found that for polymers with small re- peat units, such as polystyrene and poly(methy1 methacrylate), a good fit of experimental results was obtained using z = 1 whereas for polymers with larger repeat units, such as polycarbonate, z = 2 gave a good fit. For PPO, we used z = 1. The effect of using z = 2 is to shift downward the curve 2 in Figure 2 by about 10°C; the shape of the T, - p profile remains the same. It should be noted that the cal- culated values refer to the gas solubilities a t 35°C whereas in the DSC experiments the gas content of the polymer decreases slightly during the scan. Ac- cordingly, the agreement between experimental and calculated values improves as T, decreases. Nev- ertheless, the calculated T, - p profile is similar to the one measured by us. We, therefore, conclude that
CO, induces only a weak plasticization effect in PPO, in agreement with the theoretical predictions for high Tg polymers-CO2 system^.^^^
The authors thank Dr. J. Roovers for providing us with a sample of PPO, Dr. D. E. J. Jones for the loan of the PDSC cell, and Mr. R. Augsten for technical assistance.
REFERENCES A N D NOTES
1. W.-C. V. Wang, E. J. Kramer, and W. H. Sachse, J.
2. J. S. Chiou, J. W. Barlow, and D. R. Paul,
zyxwvutsrqponmlkjihgfedcbaZYXWVUTSRQPONMLKJIHGFEDCBA
J. Appl.3. E. S. Sanders, J. Memb. Sci., 37, 63 (1988).
zyxwvutsrqponmlkjihgfedcbaZYXWVUTSRQPONMLKJIHGFEDCBA
4. H. Hachisuka, T. Sato, T. Imai, Y. Tsujita, A. Taki- zawa, and T. Kinoshita, Polymer J., 22, 77 ( 1990). 5. J. D. Schultze, I. A. D. Engelman, M. Boehning, and
J. Springer, Polym. Adu. Technol., 2, 123 (1991).
6. R. G. Wissinger and M. E. Paulaitis,
zyxwvutsrqponmlkjihgfedcbaZYXWVUTSRQPONMLKJIHGFEDCBA
J. Polym. Sci.Polym. Phys., 2 9 , 6 3 1 (1991).
7. P. D. Condo, I. C. Sanchez, C. G. Panayiotou, and K. P. Johnston, Macromolecules, 25, 6119 (1992). 8. N. S. Kalospiros and M. E. Paulaitis, Chem. Eng. Sci.,
49, 659 (1994).
9. Y. P. Handa, S. Capowski, and M. O'Neill, T h r m o - chim. Actu, 226, 177 (1993).
10. G. Srinivasan and J. R. Elliott, Ind. Eng. Chem. Res.,
3 1 , 1 4 1 4 (1992).
11. B. J. Spalding, Chem. Week, 3 0 , 3 4 (1988).
12. A. N. Burgess and K. Jackson, J . Appl. Polym. Sci., Polym. Sci. Polym. Phys., 20, 1371 (1982).
Polym. Sci., 30, 2633 (1985).
PLASTICIZATION
zyxwvutsrqponmlkjihgfedcbaZYXWVUTSRQPONMLKJIHGFEDCBA
OF PPO BYzyxwvutsrqponmlkjihgfedcbaZYXWVUTSRQPONMLKJIHGFEDCBA
COZ 2553 13. A. R. Berens, G. S. Huvard, R. W. Korsmeyer, and F.Kunig,
zyxwvutsrqponmlkjihgfedcbaZYXWVUTSRQPONMLKJIHGFEDCBA
J . Appl. Polym. Sci., 46, 231 (1992).14. W. J. Koros, M. R. Coleman, and D. R. B. Walker,
Ann. Rev. Muter. Sci., 2 2 , 47 (1992).
15. W. J. Koros and M. W. Hellums, Fluid Phase Equil.,
5 3 , 339 (1989).
16. M. Wessling, S. Schoeman, Th. van der Boomgaard,
and C. A. Smolders,
zyxwvutsrqponmlkjihgfedcbaZYXWVUTSRQPONMLKJIHGFEDCBA
Gas Sep. Purif., 5, 222 (1991).17. M. L. O’Neill and Y. P. Handa, Assignment
zyxwvutsrqponmlkjihgfedcbaZYXWVUTSRQPONMLKJIHGFEDCBA
of theGlass Transition, A S T M STP 1249, R. J. Seyler, ed., American Society for Testing and Materials, Phila- delphia, 1994.
18. R. T. Chern, F. R. Sheu, L. Jia, V. T. Stannett, and H. B. Hopfenberg, J . Memb. Sci., 3 5 , 1 0 3 ( 1 9 8 7 ) .
19. R. T. Chern, L. Jia, S. Shimoda, and H. B. Hopfenberg,
J . Memb. Sci., 4 8 , 333 (1990).
20. K. Ghosal and R. T. Chern, J . Memb. Sci., 72, 91 ( 1 9 9 2 ) .
21. R. A. Assink, J . Polym. Sci., 12, 2281 (1974).
22. Y. Kamiya, K. Mizoguchi, and Y. Naito, J . Polym.
Sci. Polym. Phys., 2 8 , 1 9 5 5 (
zyxwvutsrqponmlkjihgfedcbaZYXWVUTSRQPONMLKJIHGFEDCBA
1990).23. S. K. Goel and E. J. Beckman, Polymer, 34, 1410
(1993).
24. P. D. Condo and K. P. Johnston, J. Polym. Sci. Polym. Phys., 3 2 , 5 2 3 (1994).
25. P. F. Levy, G. Nieuweboer, and L. C. Semanski, Ther- mochim. Acta, 1, 429 (1970).
26. Znt. Thermodyn. Tables of the Fluid State, Carbon Dioxide, Vol. 3, S . Angus, B. Armstrong, and K. M.
de Reuck, eds., Pergamon Press, New York, 1976. 27. T. S. Chow, Macromolecules, 1 3 , 3 6 2 ( 1 9 8 0 ) .
28. P. D. Condo, D. R. Paul, and K. P. Johnston, Mac-
29. F. E. Karasz, H. E. Bair, and J. M. O’Reilly, J . Polym. romolecules, 27, 365 ( 1994).
Sci. Part A-2, 6 , 1 1 4 1 (1968).
Received March 22, 1994 Revised J u n e 13, 1994 Accepted J u n e 17, 1994