Publisher’s version / Version de l'éditeur:
Vous avez des questions? Nous pouvons vous aider. Pour communiquer directement avec un auteur, consultez la Questions? Contact the NRC Publications Archive team at
PublicationsArchive-ArchivesPublications@nrc-cnrc.gc.ca. If you wish to email the authors directly, please see the first page of the publication for their contact information.
https://publications-cnrc.canada.ca/fra/droits
L’accès à ce site Web et l’utilisation de son contenu sont assujettis aux conditions présentées dans le site LISEZ CES CONDITIONS ATTENTIVEMENT AVANT D’UTILISER CE SITE WEB.
Student Report (National Research Council of Canada. Institute for Ocean Technology); no. SR-2005-10, 2005
READ THESE TERMS AND CONDITIONS CAREFULLY BEFORE USING THIS WEBSITE.
https://nrc-publications.canada.ca/eng/copyright
NRC Publications Archive Record / Notice des Archives des publications du CNRC :
https://nrc-publications.canada.ca/eng/view/object/?id=56109f50-8b6a-4805-aa11-9dadf0944955 https://publications-cnrc.canada.ca/fra/voir/objet/?id=56109f50-8b6a-4805-aa11-9dadf0944955
Archives des publications du CNRC
For the publisher’s version, please access the DOI link below./ Pour consulter la version de l’éditeur, utilisez le lien DOI ci-dessous.
https://doi.org/10.4224/8895624
Access and use of this website and the material on it are subject to the Terms and Conditions set forth at Model testing of Totally Enclosed Motor Propelled Survival Craft (TEMPSC): lifeboat performance in ice
Ocean Technology technologies oc ´eaniques
SR-2008-10
Student Report
ANTI-ROLL TANK MODEL PERIOD VARIATION
Richard Keough
August 2008
REPORT NUMBER
SR-2008-10
NRC REPORT NUMBER DATE
August 2008
REPORT SECURITY CLASSIFICATION
Unclassified
DISTRIBUTION
Unlimited
TITLE
ANTI-ROLL TANK MODEL PERIOD VARIATION AUTHOR(S)
Richard Keough
CORPORATE AUTHOR(S)/PERFORMING AGENCY(S)
Institute for Ocean Technology, National Research Council
PUBLICATION
N/A
SPONSORING AGENCY(S)
Institute for Ocean Technology, National Research Council
IOT PROJECT NUMBER NRC FILE NUMBER
KEY WORDS Anti-roll tank PAGES 18 FIGS. 4 APPs.: 3 SUMMARY
This report describes experiments carried out on the Robert Sisters II anti-roll tank scale model during the summer of 2008. The objective was to obtain and verify the tank conditions that would produce a target water period for a specified mass of water. This document describes the instrumentation used to obtain the results, the required facilities, a detailed summary of the experiment, and a discussion of the results.
ADDRESS National Research Council
Institute for Ocean Technology Arctic Avenue, P. O. Box 12093 St. John's, NL A1B 3T5
National Research Council Conseil national de recherches Canada Canada
Institute for Ocean Institut des technologies Technology océaniques
ANTI-ROLL TANK MODEL PERIOD VARIATION
SR-2008-10
Richard Keough
TABLE OF CONTENTS List of Figures………iii 1.0 INTRODUCTION………...1 2.0 PROJECT DESCRIPTION………..1 3.0 EXPERIMENT OBJECTIVE………..1 4.0 EXPERIMENTAL FACILITY………2 5.0 PROCEDURE………..3 6.0 RESULTS………6 7.0 DISCUSSION………..9 8.0 CONCLUSIONS………...10 9.0 FIGURES………...11
APPENDIX A: SECTION A RESULTS (100% Baffles) APPENDIX B: SECTION B RESULTS (80%,100%, 120% with and without baffles) APPENDIX C: SECTION C RESULTS (110% with and without baffles) LIST OF FIGURES FIGURE Experimental Setup………..1 Tank drawing………...2 First Peak……….3 Second Peak……….4
ANTI-ROLL TANK MODEL PERIOD VARIATION AUGUST 2008
INTRODUCTION
This report describes experiments carried out on the Robert Sisters II anti-roll tank scale model during the summer of 2008. The objective was to obtain and verify the tank conditions that would produce a target water period for a specified mass of water.
This document describes the instrumentation used to obtain the results, the required facilities, a detailed summary of the experiment, and a discussion of the results
PROJECT DESCRIPTION
The testing of an anti roll tank model was required for this project. The project manager for this project is David Cumming. The project involved observing the period of the water in the tank (scaled 1:10.66) for several configurations. The mass of water ranged from 2.30 kg to 3.46 kg. After the mass of water was excited, the period was observed and recorded on a high-speed camera for future analysis. The period was observed for 5 different masses of water as well as chokes of 80%, 100%, 110% and 120%, with or without baffles.
EXPERIMENT OBJECTIVE
The Roberts Sisters II vessel can be equipped with an anti-roll tank located on the deck. During fishing conditions the roll period of the vessel was observed to be 6.3366 s. The full-scale tank was designed for 3.5 tons of water which scales down to 2.8839 kg
The anti-roll tank model is scaled by 1:10.66, which yields an ideal model period of 1.94 s.
The tank model was designed such that the chokes and baffles could be easily removed and therefore varied. The variation of chokes and baffles, as well as the mass of water added to the tank, are to give a wide range of periods, ideally some reaching near the requirement of 1.94 s.
The first experiment was designed to find out under what conditions this ideal period of 1.94 s would occur.
Secondly, the data is to be analyzed and an ideal mass of water of 2.8839 kg along with the period of 1.94 s is to be pursued by varying again by varying the baffles or no baffles situations and by modifying the existing chokes.
All excitations of the take were done so to the same height and were dropped evenly as to avoid inducing undesirable periods within the tank.
EXPERIMENTAL FACILITY
In order to conduct the necessary experiment the tank needed to experience the
equivalent of a roll motion with as little pitch motion as possible. To accomplish this the tank was placed on a level surface and all excitations were done equally along the long axis of the tank.
The setup required space enough for a computer as well as a level platform that the tank could rest on. Also, the testing space required room for the camera and two large light setups as an abundant amount of light is required for high-speed photography.
The computer required for the testing had to be easily accessible after excitation in order to trigger the camera for recording.
The tank was placed on a piece of plywood, which was leveled and clamped to the edge of a large water tank in the machine shop. The setup was close to the tank as to avoid as much as possible the thoroughfare.
A picture of the setup can be seen in Figure 1.
A drawing of the tank design with specifications can be seen in Figure 2.
PROCEDURE
The experimental facility components were located (c-clamps, distilled water, plywood, washers, level, ruler, beakers, scales, hex wrench, lights, camera) or fabricated (anti-roll tank, baffles, chokes).
Using distilled water gave the advantage of a simple mass to volume calculation, as the density is 1 g/mL.
The mass of water was measured by weighing by difference in which a beaker of a known mass was filled until the desired mass of water had been acquired. The masses that were measured were based on the mean desired value of 2.8839 kg ± 10% and ± 20%
of that mass. This was to achieve a trend of five different periods for the present masses. For simplicity and experimental ease, the starting mass for the experiments was 2.3073 kg which increased by 0.2884 kg five times until the mass of 3.4613 kg was achieved. The experimental facility was setup as was previously described. The mass of water was measured and added to the tank originally for the 100% case only as this was the desired design.
The experiment can be broken up into three sections. Section A consisted of testing of the 100% with baffles case only. Section B consisted of testing the 80% and 120% cases with and without baffles as well as the 100% case without baffles. Section C consisted of testing the 110% with and without baffles cases.
Section A
The Choke of 100% and the baffles were secured in the tank. The water was weighed to be 2.3075 kg and added to the tank before securing it tightly. A ruler was placed under one side of the tank and raised to a constant height then dropped evenly. The induced wave was observed and the camera was triggered for recording. The camera was triggered as the peak of the wave was approaching the side of the tank that the camera was recording such that for the recording time of 3.272 s would capture at least two peaks. Once the recording was completed and satisfactory, the test was repeated twice more for reassurance.
The lid of the tank was removed and a mass of water of 0.2020 kg was added and the test outlined above was repeated. Subsequently masses of 0.3673 kg, 0.2887 kg, and 0.2917 kg were added respectively until a total water mass of 3.4572 kg was present and the aforementioned test repeated.
Section B
The choke of 100% was secured in the tank. The water was weighed to be 2.3073 kg and added to the tank before securing it tightly. The same procedure as section A was
employed except due to conflicting facility usage the test could only be conducted one time as opposed repeating it two times.
To maintain the same water mass for all scenarios, the mass of water was only changed when tests for the 80% and 120% cases were conducted.
The lid was removed and the 100% choke was replaced by 80% choke. The test was conducted and then again the lid removed to insert the baffles. The test was conducted again for this scenario.
This same procedure was repeated for the 120% case. Water masses of 0.2892 kg, 0.2878 kg, 0.2884 kg, and 0.2886 kg were added respectively after the entire test had been completed with a total water mass of 3.4613 kg was in the tank.
Section C
The 100% choke was milled down and modified to accomidate the 110% case. The 110% choke was secured in the tank and a water mass of 2.3033 kg was added before securing the lid tightly. The same test as previously described was conducted and repeated two times for reassurance. The lid was then removed and the baffles secured before securing the lid tightly. The test was then done for the baffles case and again repeated two times. The tests outlined for section C were repeated after adding water masses of 0.2923 kg, 0.2886 kg, 0.2897 kg, and 0.2883 kg respectively until a total water mass of 3.4622 kg was in the tank.
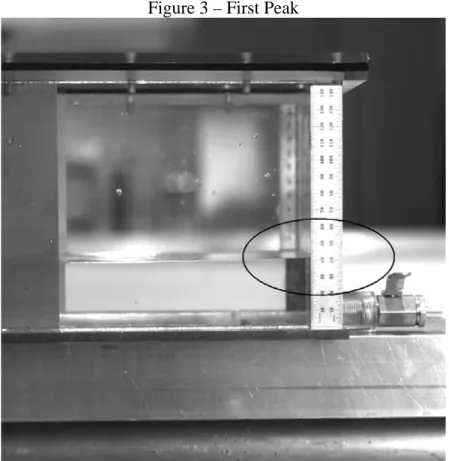
After the data for all of the tests had been recorded by the camera it was analyzed using the program Photron. By viewing the individual images that the high speed camera recorded, the first peak was observed and the elapsed time recorded. The second peak was then observed and the elapsed time recorded. Subtracting the second peak time from the first peak time the period for a certain case was recorded.
Graphs of the period vs. water mass were created for all of the cases and then the results were analyzed.
Pictures of the first and second peak of one of the runs can be seen in Figures 3 and 4.
RESULTS
Data taken from section A is found on sheet “Section A” and is located in APPENDIX A Data taken from section B is found on sheet “Section B” and is located in APPENDIX B
Data taken from section C is found on sheet “Section C” and is located in APPENDIX C From the data contained in APPENDIX A, chart 1 was generated.
Chart 1
Period vs. Water Volum e
1.9 2 2.1 2.2 2.3 2.4 2.5 2.6 2 2.5 3 3.5 4 Water Volum e (L) Period (s) Test 1 Test 2 Test 3 Target
From the data contained in APPENDIX B charts 2, 3, 4 were generated.
Chart 2 100% 1.6 1.7 1.8 1.9 2 2.1 2.2 2.3 2.4 2.5 2.6 2 2.5 3 3.5 4 Water Volum e (L) Period (s) No Baffles Baffles Target
Chart 3 80 % 1.5 1.7 1.9 2.1 2.3 2.5 2.7 2.9 2 2.5 3 3.5 4 Water Volum e (L) Period (s) No Baffles Baffles Target Chart 4 120 % 1.4 1.5 1.6 1.7 1.8 1.9 2 2.1 2 2.5 3 3.5 4 Water Volum e (L) Period (s) No Baffles Baffles Target
Chart 5 110% 1.6 1.65 1.7 1.75 1.8 1.85 1.9 1.95 2 2.05 2.1 2 2.2 2.4 2.6 2.8 3 3.2 3.4 3.6 3.8 4 Water Volume (L) Pe ri od (s ) Baffles No Baffles Target DISCUSSION
The results from section A indicated that this setup, the 100% case with baffles, did not give the desired period. Although the curve does cross the desired period of 1.94 s, the mass of water was too little as we wanted to achieve this period with the optimal water mass of 2.8839 kg.
From section B we can deduce that the baffles certainly have an effect on the period for the different masses of water. However these tests were only conducted once and this leaves a lot of room for error. Again, none of the scenarios reach close enough to the 1.94 s period for the optimal water mass. The 100% case showed we get a period that is too greater than optimal, the same goes for the 80% case. The 120% case gave a period which was less than the target.
After modification of the 80% choke, the target was reached for the desired water mass for the 110% case. This can be seen in the data from section C where the case without baffles and the desired water mass give an average period of 1.941 s.
CONCLUSIONS
By observing the motion of water in the tank, the baffles seemed to create vorticies as the water would flow through them. Depending on the mass of water and the chokes used, this would increase or decrease the period.
The chokes allowed for an increase or decrease in mass flow rate. the largest choke, the 80% (referring to the amount of space for water to flow), allowed for the least mass of water to flow through, which is what caused an increase in period.
By far the biggest factor in period variation was the mass of water used. Similar trends are seen in all of the charts with or without baffles.
FIGURES
Figure 1 – Experimental Setup
Figure 3 – First Peak
Date Run Water Volume first peak time (s) second peak time (s) Period Baffles mwater 17-Jun-08 2.3075 0.796 3.264 2.468 2.3075 17-Jun-08 2.5095 0.696 2.952 2.256 2.5095 17-Jun-08 2.8768 0.896 3.024 2.128 2.8768 17-Jun-08 3.1655 0.76 2.808 2.048 3.1655 17-Jun-08 1 3.4572 0.728 2.696 1.968 yes 3.4572 17-Jun-08 2.3075 0.592 3.056 2.464 2.3075 17-Jun-08 2.5095 0.592 2.864 2.272 2.5095 17-Jun-08 2.8768 0.504 2.672 2.168 2.8768 17-Jun-08 3.1655 0.824 2.872 2.048 3.1655 17-Jun-08 2 3.4572 0.624 2.616 1.992 yes 3.4572 17-Jun-08 2.3075 0.408 2.88 2.472 2.3075 17-Jun-08 2.5095 0.464 2.728 2.264 2.5095 17-Jun-08 2.8768 0.752 2.896 2.144 2.8768 17-Jun-08 3.1655 0.672 2.736 2.064 3.1655 17-Jun-08 3 3.4572 0.528 2.496 1.968 yes 3.4572
Date Choke Run Water Volume first peak time (s) second peak time(s) Period (s) Baffles mwater 18-Jun-08 2.3073 0.392 2.856 2.464 2.3073 18-Jun-08 2.5965 0.384 2.736 2.352 2.5965 18-Jun-08 2.8843 0.288 2.544 2.256 2.8843 18-Jun-08 3.1727 0.4 2.456 2.056 3.1727 18-Jun-08 100% 1 3.4613 0.104 1.808 1.704 no 3.4613 18-Jun-08 2.3073 0.32 3.016 2.696 2.3073 18-Jun-08 2.5965 0.184 2.6 2.416 2.5965 18-Jun-08 2.8843 0.344 2.554 2.21 2.8843 18-Jun-08 3.1727 0.592 2.424 1.832 3.1727 18-Jun-08 80% 1 3.4613 0.684 2.432 1.748 yes 3.4613 18-Jun-08 2.3073 0.048 2.592 2.544 2.3073 18-Jun-08 2.5965 0.248 2.656 2.408 2.5965 18-Jun-08 2.8843 0.36 2.688 2.328 2.8843 18-Jun-08 3.1727 0.104 2.344 2.24 3.1727 18-Jun-08 80% 2 3.4613 0.84 2.44 1.6 no 3.4613 18-Jun-08 2.3073 0.552 2.424 1.872 2.3073 18-Jun-08 2.5965 0.64 2.408 1.768 2.5965 18-Jun-08 2.8843 0.456 2.152 1.696 2.8843 18-Jun-08 3.1727 0.248 1.91 1.662 3.1727 18-Jun-08 120% 1 3.4613 0.184 1.712 1.528 yes 3.4613 18-Jun-08 2.3073 0.28 2.312 2.032 2.3073 18-Jun-08 2.5965 0.36 2.264 1.904 2.5965 18-Jun-08 2.8843 0.176 2.008 1.832 2.8843 18-Jun-08 3.1727 0.016 1.752 1.736 3.1727 18-Jun-08 120% 2 3.4613 0.368 1.784 1.416 no 3.4613
Date Run Water Volume first peak time (s) second peak time (s) Period Baffles mwater 14-Aug-08 2.3033 0.328 2.352 2.024 2.3033 14-Aug-08 2.5956 0.32 2.256 1.936 2.5956 14-Aug-08 2.8842 0.56 2.416 1.856 2.8842 14-Aug-08 3.1739 0.48 2.296 1.816 3.1739 14-Aug-08 1 3.4622 0.92 2.448 1.528 yes 3.4622 14-Aug-08 2.3033 0.48 2.528 2.048 2.3033 14-Aug-08 2.5956 0 1.984 1.984 2.5956 14-Aug-08 2.8842 0.12 1.944 1.824 2.8842 14-Aug-08 3.1739 0.816 2.608 1.792 3.1739 14-Aug-08 2 3.4622 0.304 1.992 1.688 yes 3.4622 14-Aug-08 2.3033 0.152 2.168 2.016 2.3033 14-Aug-08 2.5956 0.328 2.312 1.984 2.5956 14-Aug-08 2.8842 0.592 2.416 1.824 2.8842 14-Aug-08 3.1739 0.72 2.448 1.728 3.1739 14-Aug-08 3 3.4622 0.496 2.208 1.712 yes 3.4622 14-Aug-08 2.3033 0.208 2.2 1.992 2.3033 14-Aug-08 2.5956 0.224 2.208 1.984 2.5956 14-Aug-08 2.8842 0.36 2.296 1.936 2.8842 14-Aug-08 3.1739 0.096 1.848 1.752 3.1739 14-Aug-08 1 3.4622 0.4 2.128 1.728 no 3.4622 14-Aug-08 2.3033 0.792 2.792 2 2.3033 14-Aug-08 2.5956 0.168 2.136 1.968 2.5956 14-Aug-08 2.8842 0.584 2.536 1.952 2.8842 14-Aug-08 3.1739 0.352 2.096 1.744 3.1739 14-Aug-08 2 3.4622 0.128 1.832 1.704 no 3.4622 14-Aug-08 2.3033 0.504 2.496 1.992 2.3033 14-Aug-08 2.5956 0.152 2.136 1.984 2.5956 14-Aug-08 2.8842 0.6 2.536 1.936 2.8842 14-Aug-08 3.1739 0.312 2.048 1.736 3.1739 14-Aug-08 3 3.4622 0.776 2.424 1.648 no 3.4622