Publisher’s version / Version de l'éditeur:
Preservation of Roadway Structures and Pavements, pp. 97-106, 2005
READ THESE TERMS AND CONDITIONS CAREFULLY BEFORE USING THIS WEBSITE.
https://nrc-publications.canada.ca/eng/copyright
Vous avez des questions? Nous pouvons vous aider. Pour communiquer directement avec un auteur, consultez la
première page de la revue dans laquelle son article a été publié afin de trouver ses coordonnées. Si vous n’arrivez pas à les repérer, communiquez avec nous à PublicationsArchive-ArchivesPublications@nrc-cnrc.gc.ca.
Questions? Contact the NRC Publications Archive team at
PublicationsArchive-ArchivesPublications@nrc-cnrc.gc.ca. If you wish to email the authors directly, please see the first page of the publication for their contact information.
Archives des publications du CNRC
This publication could be one of several versions: author’s original, accepted manuscript or the publisher’s version. / La version de cette publication peut être l’une des suivantes : la version prépublication de l’auteur, la version acceptée du manuscrit ou la version de l’éditeur.
For the publisher’s version, please access the DOI link below./ Pour consulter la version de l’éditeur, utilisez le lien DOI ci-dessous.
https://doi.org/10.3141/1933-11
Access and use of this website and the material on it are subject to the Terms and Conditions set forth at
Modification of bending beam rheometer specimen for low-temperature evaluation of bituminous crack sealants
Al-Qadi, Imad L.; Loulizi, Amara; Aref, Susanne; Masson, J.-F.; McGhee, Kevin M.
https://publications-cnrc.canada.ca/fra/droits
L’accès à ce site Web et l’utilisation de son contenu sont assujettis aux conditions présentées dans le site LISEZ CES CONDITIONS ATTENTIVEMENT AVANT D’UTILISER CE SITE WEB.
NRC Publications Record / Notice d'Archives des publications de CNRC: https://nrc-publications.canada.ca/eng/view/object/?id=c84457ea-fce1-46e2-bab8-add6d1ca008c https://publications-cnrc.canada.ca/fra/voir/objet/?id=c84457ea-fce1-46e2-bab8-add6d1ca008c
M odific at ion of be nding be a m rhe om e t e r
spe c im e n for low -t e m pe rat ure eva luat ion
of bit um inous c ra ck se a la nt s
R e p o r t N R C C - 4 7 6 2 8
A l Q a d i , I . L . ; L o u l i z i , A . ; A r e f , S . ; M a s s o n , J
-F . ; M c G h e e , K . M .
A version of this document is published in / Une version de ce document se trouve dans:
Transportation Research Board, 84th Annual Meeting, Jan. 9-13, 2005, Washington, D.C.; pp. 1-26
Paper No. 05-2238
Modification of Bending Beam Rheometer Specimen
for Low-Temperature Evaluation of Bituminous
Crack Sealants
Duplication for publication or sale is strictly prohibited without prior written
permission of the Transportation Research Board
Title:
Modification of Bending Beam Rheometer Specimen for
Low-Temperature Evaluation of Bituminous Crack Sealants
Authors: Imad L. Al-Qadi, Amara Loulizi, Susanne Aref, J-F
Masson, and Kevin. M. MeGhee
Transportation Research Board
84
thAnnual Meeting
January 9-13, 2005
Washington, D.C.
Modification of Bending Beam Rheometer Specimen for
Low-Temperature Evaluation of Bituminous Crack Sealants
Imad L. Al-Qadi*
Founder’s Professor of Civil and Environmental Engineering Advanced Transporation Research and Engineering laboratory, Director
University of Illinois at Urbana-Champaign 205 N Mathews Ave., MC-250, Urbana, IL 61801
Email: alqadi@uiuc.edu
(Corresponding Author)
Amara Loulizi
Virginia Tech Transportation Institute Blacksburg, VA 24061
Email: amlouliz@vt.edu Susanne Aref
Department of Statistics, Virginia Tech Blacksburg, VA 24061
Email: saref@vt.edu J-F. Masson
Institute for Research in Construction
National Research Council of Canada, Ottawa, ON, K1A 0R6, Canada. E-mail: Jean-Francois.Masson@nrc-cnrc.gc.ca
Kevin M. McGhee Senior Research Scientist
Virginia Transportation Research Council, VDOT Charlottesville, VA 22903
Email: Kevin.McGhee@VirginiaDOT.org
Modification of Bending Beam Rheometer Specimen for
Low-Temperature Evaluation of Bituminous Crack Sealants
ABSTRACT
It is difficult to effectively evaluate the low temperature stiffness of bituminous hot-poured crack sealants utilizing existing test methods. The standard bending beam rheometer (BBR) was found to be inappropriate for testing soft bituminous-based hot-poured crack sealant, even at a temperature of -40°C. The measured deflection exceeded the BBR limit after only few seconds of loading. To address this issue, the moment of inertia of the tested beam was increased by doubling its thickness (from 6.35mm to 12.7mm). This allows testing of the softest available material in the market. For the new beam dimensions, it was found that only 4% of the beam center deflection is due to shear, a value deemed acceptable for sealant evaluation and comparison. On this basis, the BBR stiffness of sealants were obtained at several discrete temperatures between –10°C and –40°C to assess the repeatability of the method for the evaluation of the low temperature stiffness of bituminous sealants. Ten different sealants were then tested at 40°C; three out of these ten sealants were further tested at 35°C, 30°C, 28°C, -25°C, and -20°C; and the three “hard” sealants were tested at -10°C. A minimum of three replicates were used. The coefficient of variation on the measured stiffness after 60sec of loading was always lower than 18%, with almost 75% of the measurements having a coefficient of variation less than 10%. A pairwise comparison showed that the modified BBR could be used to classify sealant products according to their measured stiffness. Effect of temperature on stiffness was investigated for three sealants. It was found that the stiffness vary exponentially with temperature in the temperature range of -40°C to -20°C. A statistical analysis of the results indicated that the modified BBR method could be used to classify sealants based on low temperature stiffness.
INTRODUCTION
Crack sealing and filling is a practice used for routine and preventive maintenance, as well as part of a preservation strategy or a whole corrective maintenance program prior to an overlay. The main reason for crack sealing/filling is to prevent water from entering the pavement
structure, which usually weakens the pavement structure and accelerates its deterioration. When crack sealant is applied when needed and properly installed, the pavement life may be extended by several years. Moreover, several studies have shown crack sealants to be cost effective when used to preserve pavements (1-7). For example, the province of Ontario reported that crack sealing added about four years of life to flexible pavements (6).
However, while crack sealing is one of the easiest and most common means of
preventive maintenance, sealant failure is common within the first three years of application. In addition to the pavement condition, several factors affect the field performance of crack sealants, which may be divided into two categories: installation related parameters, such as QC/QA, crack cleaning and preparation, and reservoir configuration; and sealant properties, such as viscosity,
softness, and bond strength. These factors must be addressed properly to achieve a successfully sealing operation and to attain the expected life of the sealing job.
Crack sealant specifications are found in ASTM D6690 and AASHTO M173, yet standard test results correlate poorly with field performance. These tests are empirical and do not measure rheological properties of the sealant materials. Hence, better sealant durability is urgently
needed. The key to improving sealant durability is to develop effective performance guidelines for selection and application of sealants. Making good use of the methods and equipment developed during the five-year Strategic Highway Research Program (SHRP) for asphalt binder testing and the development of the Performance Grade (PG) system for asphalt binders, more than 26 State and Province departments of transportation, manufactures, cities, and research agencies in North America have collaborated to develop performance-based guidelines for the selection of hot-poured crack sealants. However, in order to use the equipment developed by SHRP, some modifications are necessary to allow for testing of hot-poured sealants. This paper presents the modification of the bending beam rehometer (BBR) to test the low-temperature properties of hot-poured bituminous-based crack sealants.
CURRENT LOW-TEMPERATURE TESTS
Several laboratory tests are currently used to examine the low-temperature properties of hot-poured bituminous-based crack sealants. The most commonly used tests include the cone penetration test, the flexibility test, the bond test, and the ductility test.
The Cone Penetration Test provides an indication of the consistency of the material. A 150-gram special cone penetrates into the tested sample for 5sec, and the penetration in dmm is recorded. The test is usually performed at 25°C, though some agencies perform it at other temperatures, such as -18°C. Although this test is beneficial as an indication of the consistency of the material at the testing temperature, it may not provide rheological properties, nor can it be applied for polymer-modified asphalt, which is the case of most hot-poured sealants.
The Flexibility Test gives an indication of the flexibility of the material at low
temperatures. The test consists of bending a beam sample 90° over a steel mandrel at a uniform rate. The material passes the test if it does not crack. Utah uses this test (Utah Cold Bend Test) for its low-temperature specifications of crack sealants (8).
The Bond Test is thought to give an indication of the adhesion characteristics of the sealant material. Sealant is poured between two Portland cement concrete blocks, which are then
extended for a specific distance (the extension can be fixed at 50% to 200%) at a rate of 3.2mm/hr at low temperature. The sealant is subjected to three cyclic extensions at –18°C or – 29°C. The blocks are then allowed to return to their original spacing at ambient temperature. The specimen is then checked for cohesive or adhesive failures, which may be influenced by specimen end effects. The test may be repeated for a specific number of cycles. The test could be modified by using hot-mix asphalt cubes.
The Ductility Test indicates the ability of the tested material to be stretched without
breaking. A standard briquette of crack sealant material is stretched at a rate of 50mm/min. The stretched distance before breaking is recorded. The test is usually performed at 25°C, but testing at 4°C is also common. When testing at 4°C, the pulling rate is reduced to 10mm/min.
Although the aforementioned tests are used by most state highway agencies for the selection of their crack sealing materials, the specification limits differ among state agencies, resulting in confusion regarding sealant selection and recommendations. However, the
difference in specification limits are expected because these tests are empirical and do not well correlate with field performance (9-11). In a research program by Utah DOT, Belangie and Anderson could not find any single test that consistently predicted field performance (6). However, they found that the cold bend test, the ductility test, and the force ductility test were effective for identifying poor cold-weather performance.
During the SHRP H-106 maintenance experiment and the FHWA LTM of Pavement Maintenance Materials projects, several laboratory tests were performed on sealants to find correlations between laboratory results and field performance (12). The correlations between laboratory tests and field performance were found to be either weak or non-existent. However, strong direct and positive relationships were reported as follows: force ductility maximum
elongation at 4°C versus cohesion failure; force ductility load at 150% elongation and 4°C versus cohesion failure; ultimate elongation at 24°C versus cohesion failure; tensile stress at 150% elongation at 24°C versus overall failure; and modified bond #1 (reservoir configuration) at 25°C versus adhesion failure. The study recommended more research to identify reliable
performance-related laboratory tests that would greatly help agencies ensure the proper selection of a material for a given project. It is in this spirit, that the feasibility of BBR is being evaluated for testing hot-poured bituminous crack sealants in this study.
BENDING BEAM RHEOMETER
The bending beam rehometer was developed to measure the low-temperature creep response of asphalt binders (13-15). The equipment applies a constant load, usually 980mN, at the mid-span of a simply supported asphalt cement beam. The deflection at the center of the beam is then measured using a linear variable differential transducer (LVDT). In addition to deflection, the load applied on the beam, the time of loading, and the temperature are also measured and acquired by the equipment’s data acquisition system. To control the testing temperature, a fluid bath reservoir, made of stainless steel and insulated with high-density foam backing, is used. A re-circulating chiller allows the bath temperature to go as low as -40°C, with a stability of +/-0.1°C.
For this study, the beam dimensions were selected to meet the requirements for using elementary bending theory (13). A testing span of 102mm (actual beam length is 127mm), a beam width of 12.7mm, and a beam thickness of 6.35mm were finally chosen for testing binders. The time dependent flexural creep stiffness is calculated using Equation 1:
) ( 4bh L P S(t) 3 3 t = (1)
where S(t) is the stiffness at time t, P is the applied load, L is the span length, b is the beam width, h is the beam thickness, and (t) is the measured deflection at time t.
The BBR test, which has been used to assess the low-temperature property of asphalt paving cements since the 1950s, results in a measure of a rheological property, stiffness (16). Although the strain resulting from the deflection of the tested specimen is low when compared to field behavior, the test is thought to better distinguish between sealant materials at low
PRELIMINARY STUDY
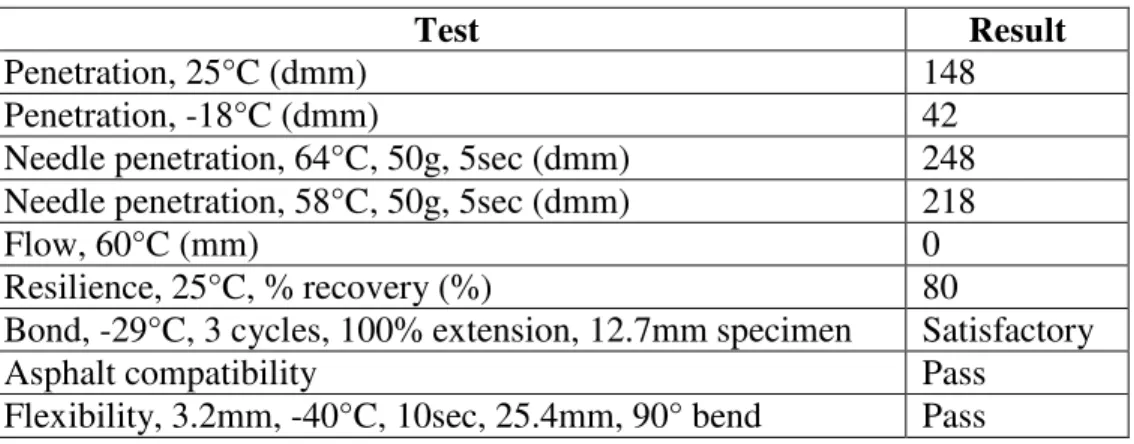
In order to evaluate the feasibility of using the BBR to test bituminous-based hot-poured crack sealant materials, three sealants were tested: the softest and hardest products from one manufacturer and a third product by another manufacturer. The softest product is referred to as Sealant B; the hardest product is referred to as Sealant Q, and the third sealant is referred to as Sealant N. Their respective penetration values at 25°C were 148, 22 and 75. The specifications as reported by the manufacturers of the three products are shown in Table 1. Sealants B and N were purported to meet ASTM D6690, types IV and II, respectively, while sealant Q does not meet any of the D6690 types.
The procedure used for the binder testing (AASHTO TP1-97) was followed, with the exception of changing the Mylar strips, with a mix of glycerin and talc, applied with a brush to all sides of the mold. The Mylar strips were found to stick to the sealant materials.
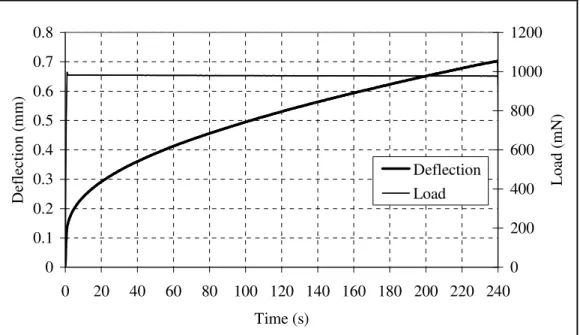
For the feasibility testing, Sealant Q was tested at -10°C. Figure 1a shows the load and deflection versus time for one of the tested specimens. The maximum measured deflection of the beam was 0.7mm after 240sec, which is well below the equipment’s deflection measurement limit (6.3mm). The stiffness versus time for the six tested specimens is shown in Figure 1b. At 60sec, the measured average stiffness was found to be 154MPa, with a coefficient of variation (COV) of 19.8%.
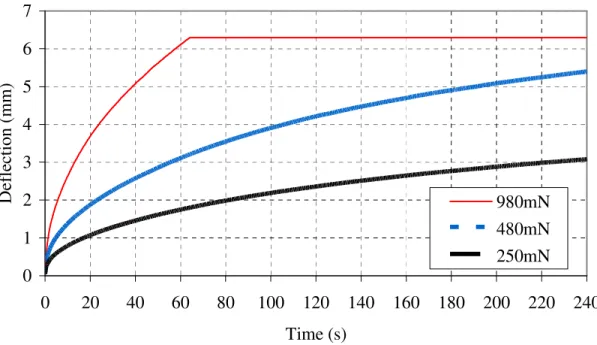
Sealant N was tested at -40°C. The deflection reached the equipment’s 6.3mm limit after only 62sec of loading using the standard load. Reduced loads had to be applied to maintain the deflection within the limits imposed by the equipment. A test using 490mN resulted in
deflection close to the equipment limit after 240sec. For 250mN, a deflection of approximately 3mm was obtained after 240sec. Figure 2 shows the deflection versus time for the three
aforementioned tests. For the 250mN load, the average stiffness after 60sec of loading was found to be 12.7MPa and a COV of 4.6%.
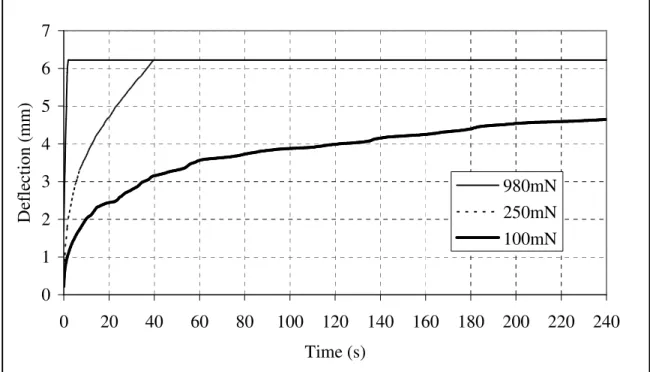
Sealant B was also tested at -40°C. The deflection limit of the equipment was reached after 2sec of loading. The reduced load of 250mN was still excessive; it took approximately 40sec of loading to reach the deflection limit of the equipment. At 100mN, the deflection after 240sec of loading was approximately 4.8mm. The average stiffness after 60sec was 2.2MPa, with a COV of 9.8%. However, the load was unstable and tended to decrease over time. This explains the non-smoothness in the deflection curve, as shown in Figure 3.
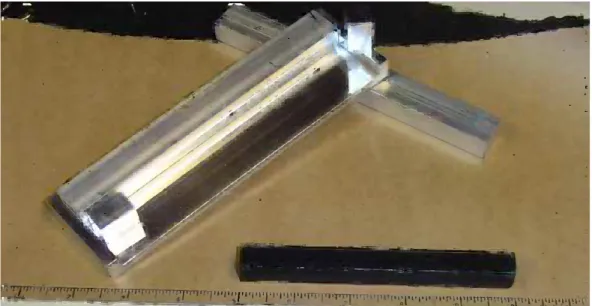
To overcome these problems, the beam thickness was increased to 12.7mm, instead of the standard 6.35mm. Figure 4 shows the new mold and the prepared crack sealant beam. Sealant B was then tested using the new beam dimensions in three replicates. Figure 5a shows the
deflection versus time as well as the load versus time for one of the tested specimens. The load and deflection were stable over time. The maximum measured deflection was approximately 3.2mm and the measured stiffness is 6.1MPa, with a COV of 3.5%, after 60sec of loading (Figure 5b). The stiffness is approximately three-fold that measured for the standard binder beam size at 100mN. This indicates that Sealant B does not exhibit linear viscoelastic behavior.
The above results suggest the feasibility of using a 12.7-mm-thick beam for testing hot-poured bituminous-based crack sealant materials utilizing the existing BBR equipment. However, because of the increase in the beam’s thickness, the deflection due to shear would increase. Hence, an analysis was needed to quantify the percentage in deflection due to shear.
DEFLECTION DUE TO SHEAR
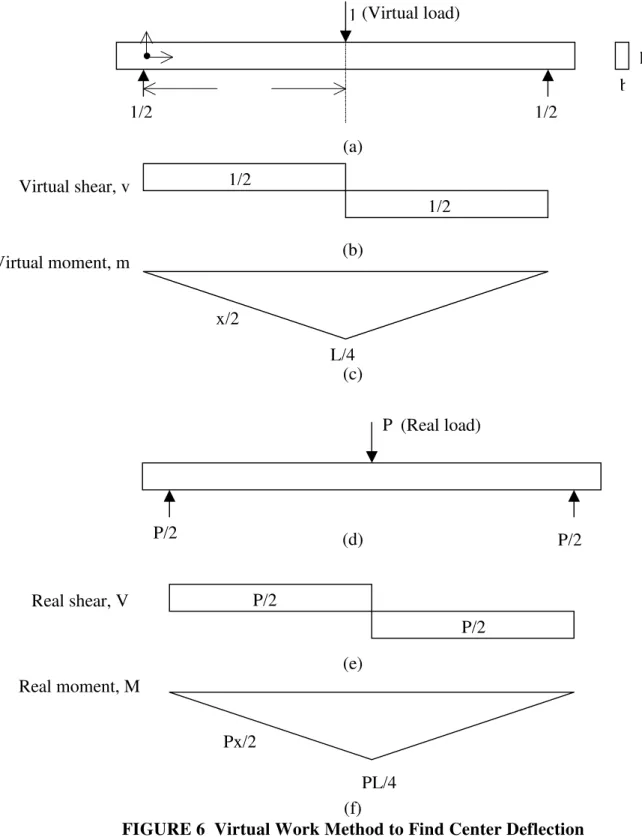
To determine the percentage of the deflection due to shear, the virtual work method was used. To determine center deflection, a unit virtual force is applied at the center of the beam (Figure 6a). The resultant virtual shear, v, and virtual moment, m, are shown in Figures 6b and 6c, respectively. When the real force is applied, Figure 6d, it induces real shear forces, V, and real moments, M, Figures 6e and 6f, respectivelly. If the beam dx units long, dy units wide, and dz units high, the internal work, du1, done by the virtual moments, m, due to the action of the real load is the following:
EI mMdx
du1 = (2)
where E is the elastic modulus and I is the moment of inertia.
The internal work, du2, done by the virtual shear, *, due to the shearing forces ( ) of the real load is as follows:
dxdydz G
du
*
2 = (3)
where G is the shear modulus, which is related to the elastic modulus: ) + = 1 ( 2 E G (4)
where is the Poisson’s ratio.
The external work done by the virtual load due to the application of the actual load is equal to 1 times w0, where w0 is the center deflection. The external work done by the virtual load must equal the internal work done by the virtual moments and virtual shear stresses, which could be written as follows: dxdydz G dx EI mM w x 1 2 / h 2 / h b 0 L 0 * L 0 0 = + (5)
where h is the beam thickness, b is the beam width, and l is the beam length
For a beam, shear stresses are distributed according to a parabola, as presented by Equation 6: ) z ) 2 h )(( 2I V ( 2 2 = (6)
Using the shear diagrams presented in Figures 6b and 6e, the virtual and actual shear stresses are given by Equations 7 and 8, respectively:
) z ) 2 h )(( 4I 1 ( 2 2 = (7) ) z ) 2 h )(( 4I P ( 2 2 = (8)
Noting that the loading is symmetric with respect to the center of the beam and that the shear stress is distributed symmetrically with respect to the top and bottom of the beam, and using Equations 7 and 8, Equation 5 could be written as follows:
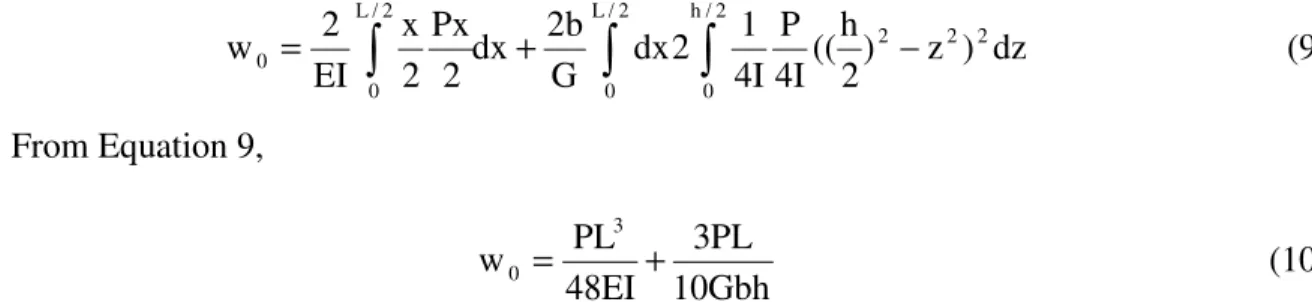
dz ) z ) 2 h (( 4I P 4I 1 2 dx G b 2 dx 2 Px 2 x EI 2 w 2 2 2 2 / L 0 2 / h 0 2 / L 0 0 = + (9) From Equation 9, 10Gbh PL 3 48EI PL w 3 0 = + (10)
The first term in Equation 10 represents the deflection due to bending. The second term in Equation 10 represents the deflection due to shear. Equation 10 could also be written as shown by Equations 11 through 13: 5Ebh 1 ( PL 3 48EI PL w 3 0 ) + + = (11) 20EI 1 ( PLh 48EI PL w 2 3 0 ) + + = (12) ) 5L 1 ( h 12 1 ( 48EI PL w 2 2 3 0 ) + + = (13)
Equation 13 shows that when the length of the beam is much greater than its thickness, the term in the bracket approaches 1, which means that shear effects are very minimum. The beam size used for binder testing is 102mm long and 6.35mm high. Assuming a Poisson’s ratio of 0.15, the term between brackets in Equation 13 would equal 1.01, which means that shear effects contribute only 1% to the center deflection, which is neglected. For the new selected beam, the thickness is 12.7mm, and for a Poisson’s ratio of 0.15, the term between brackets in Equation 13 would be equal to 1.04, which means that the shear effects contribute to only 4% to the center deflection, which is deemed acceptable. Once the beam thickness was found to be adequate, testing with more sealants was needed to evaluate the repeatability of the measurements, to evaluate whether the test shows differences between sealants, and to study the variation of stiffness with temperature on some sealants.
DATA ANALYSIS
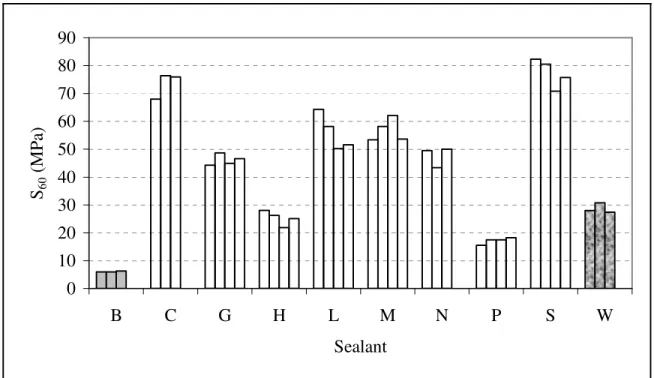
The repeatability of testing using the BBR with the new beam size was studied by testing ten different sealants at -40°C (Sealants B, C, G, H, L, M, N, P, S, and W) and three sealants (Sealants M, N, and P) at -35°C, -30°C, -28°C, -25°C, and -20°C. In addition, three sealants described as hard (Sealants Q, Y, and Z) were tested at -10°C. The sealant labels were assigned alphabetically and randomly. A minimum of three replicates per sealant were tested. Figure 7 shows the measured stiffness after 60sec of loading (S60) for the 10 tested sealants at -40°C. The stiffness of the sealants varied from about 5MPa to 80MPa.
Figure 8 shows the measured S60 for sealants M, N, and P versus temperature, which allowed for an evaluation of the effect of temperature on S60, while Figure 9 shows the measured S60 for the tested three sealants at -10°C. The greatest calculated COV for all tested sealants was found to be 17.1%, while the minimum COV was 1.5%. Figure 10 shows the frequency
distribution and the cumulative frequency distribution for the calculated COV. From this figure, it is noted that the most frequent calculated COV was between 6% and 8% (28.6% of the measurements). All measurement had a COV of less than 19%; almost 11% of the
measurements had a COV of less than 4%, and almost 72% of the measurements had a COV of less than 10%.
To verify the acceptance of the range of the different results, limits as specified per ASTM C670-96 (Standard Practice for Preparing Precision and Bias Statements for Test Methods for Construction Materials) were checked. All calculated ranges were below the ASTM specified criteria of 3.3 standard deviations when testing three replicates and 3.6 standard deviations when testing four replicates.
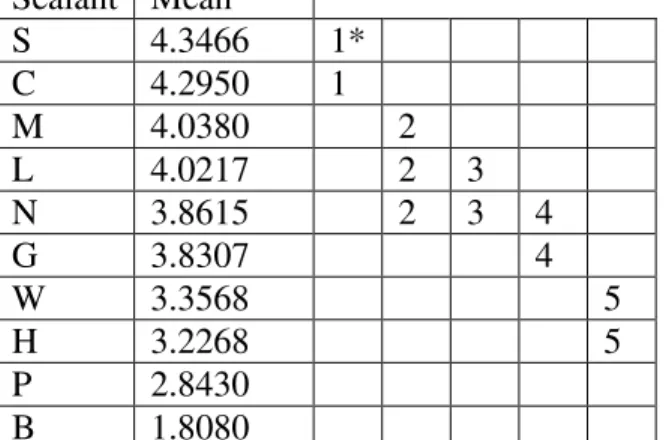
To evaluate whether the testing shows differences between sealants tested at the same temperature, an analysis of variance was performed on the measured S60 for the ten tested sealants at -40°C. Assumptions for performing an analysis of variance are homogeneity of variance and normality of errors. The data did not have homogeneity of variance, as shown in plot of residuals versus the predicted S60, Figure 11a. A trend is noted that as S60 increases, so does the residual. This suggests that a transformation of S60 is needed for an appropriate analysis. A natural logarithm transformation was applied to S60 and was plotted against the residuals, Figure 11b. No trend between the natural logarithm of S60 and the residuals was found. Hence, an analysis of variance with pairwise comparisons using Tukey adjustments could be performed on the transformed data. Table 2 shows the results of the analysis. The numbers indicate the group of products that are statistically similar. Sealants S and C are statistically similar; Sealants M, L, and N are statistically similar; Sealants N and G are statistically similar; Sealants W and H are statistically similar, and Sealants P and B are statistically different from all other sealants.
Sealants M, N, and P were further evaluated to investigate the effect of temperature on their measured S60. As was shown in Figure 8, plotting ln(S60) versus temperature results in a straight line for all three tested sealants. Therefore, S60 varies exponentially with temperature in this temperature range for all three sealants. The statistical package SAS was used to find the regression parameters for the three sealants that fit Equation 14. Table 3 presents the results of this regression analysis.
ln(S60) = a + b * T (14)
where ln(S60) is the natural logarithm of the measured stiffness after 60sec of loading, T is the test temperature in °C, and a and b are the regression parameters. The values in Table 3 indicate that sealant N is softer than the other two sealants at 0°C and that its stiffness is relatively more temperature susceptible.
CONCLUSION
The SHRP-recommended standard bending beam rheometer (BBR) was found to be
inappropriate for testing some hot-poured bituminous-based crack sealants because they exhibit relatively high deflections under load when compared to asphalt binders, even at -40°C. The BBR specimen beam dimensions were modified by doubling its thickness (from 6.35mm to 12.7mm). The effect of shear deflection due to the increase in the beam thickness was quantified at less than 4%. Ten different sealants were then tested at -40°C; three out of the ten were further tested at -35°C, -30°C, -28°C, -25°C, and -20°C; and the three “hardest” sealants were tested at -10°C. A minimum of three replicates were used. The repeatability of the testing was found to be acceptable. The pairwise comparison showed that the BBR could be used to classify
sealant products according to their measured stiffness. Results from the modified BBR will be used to establish a stiffness specification limit that well-correlate with field performance.
ACKNOWLEDGEMENTS
This research is sponsored by the Federal Highway Administration Pool-fund TPF5 (045) and the Canadian Crack Sealant Consortium. The contribution of the participating states, industry, and provinces is greatly appreciated. The help of Billy Hobbs in preparing and testing the BBR specimens is greatly appreciated.
REFERENCES
1. Joseph, P. Field Evaluation of Rout and Seal Crack Treatment in Flexible Pavement, Report PAV-90-03, Ministry of Transportation of Ontario, Downsview, Ontario, 1990. 2. Cuelho, E., D. R. Johnson, and R. B. Freeman. Cost-effectiveness of crack sealing
materials and techniques for asphalt pavements, Report # FHWA/MT-02-002/8127,
Montana Department of Transportation, Helena, Montana, 247p, 2002.
3. Cuelho, E., S. K. Ganeshan, D. R. Johnson, R. B. Freeman, and P. L. Schillings. Relative
Performance of Crack Sealing Materials and Techniques for Asphalt Pavements. Third
International Symposium on Maintenance and Rehabilitation of Pavements and Technological Control, 2003, Guimarães, Portugal, pp. 327-337.
4. Fang, C., K. A. Galal, D. R. Ward, J. E. Haddock, and T. Kuczek. Cost-Effectiveness of Joint and Crack Sealing. Paper Presented at the 82nd Annual Meeting of the Transportation Research Board, Washington, D.C., 2003.
5. Ward, D. R. Evaluation of the Implementation of Hot-Pour Sealants and Equipment for
Crack Sealing in Indiana, Final Report, No. FHWA/IN/JTRP-2000/27, 189p, 2001.
6. Chong, G. J., and W. A. Phang. Improved Preventive Maintenance: Sealing Cracks In Flexible Pavements In Cold Regions, Report PAV-87-01. Ontario Ministry of
Transportation, Downsview, Ontario, 31p, 1987.
7. Chong, G. J. Rout and Seal Cracks in Flexible Pavements-A Cost Effective Preventive Maintenance Procedure. In Transportation Research Record: Journal of the Transportation
Research Board, No. 1268, TRB, Washington, D.C., 1990, pp. 8-16.
8. Belangie, M. C., and D. I. Anderson. Crack Sealing Methods and Materials for Flexible
Pavements, Final Report, No. FHWA-UT-85-1, 74p., Utah Department of Transportation,
Salt Lake City, UT, 1985.
9. Masson, J. F., and M. A.Lacasse. Considerations for a Performance-Based Specification for Bituminous Crack Sealants. ASTM Special Technical Publication, No. STP 1348, 1999, pp.168-181.
10. Masson, J. F. Bituminous Sealants for Pavement Joints and Cracks: Building the Basis for a Performance-Based Specification. Durability of Building and Construction Sealants. A. Wolf, Ed., RILEM, Paris, pp. 315-328, 2000.
11. Smith, K. L., and A. R. Romine. Innovative Materials Development and Testing, Volume 3:
Treatment of Cracks in Asphalt Concrete-Surfaced Pavements, SHRP-H-354, 1993.
12. Smith, K. L. and A. R. Romine. LTPP Pavement Maintenance Materials: SHRP Crack Treatment Experiment, Report No. FHWA-RD-99-143, final report, 1999.
13. Bahia, H. U., D. A. Anderson, and D. W. Christensen. “The Bending Beam Rheometer; A Simple Device for Measuring Low-Temperature Rheology of Asphalt Binders,”
Proceedings of the Journal of the Association of Asphalt Paving Technologists, Vol. 61, pp. 117-153, Charleston, S.C., 1992.
14. Anderson, D. A., D. W. Christensen, H. U. Bahia, R. Dongre, M. G. Sharma, C. E. Antle, , and J. Button. Binder Characterization and Evaluation. Volume 3: Physical
Characterization, SHRP-A-369, 1994.
15. Bahia, H. U. and D. A. Anderson. The Development of The Bending Beam Rheometer; Basics and Critical Evaluation of The Rheometer. ASTM Special Publication, STP 1241, pp. 28-50, 1995.
16. Khandhal, P. S., J. W. Button, R. L. Davis, E. K. Ensley, N. P. Khosla, and V. P. Puzinauskas. Low-Temperature Properties of Paving Asphalt Cements, State of the Art Report 7, Transportation Research Board, Washington, D.C., 1988.
LIST OF TABLES AND FIGURES
TABLE 1 Sealant specifications as reported by the manufacturers
TABLE 2 Results of the Pairwise Comparison with Tukey Adjustments on ln(S60) TABLE 3 Regression Parameters and S60 at 0°C and –10°C for sealants M, N, and P FIGURE 1a Load and Deformation versus Time for Sealant Q Using the Standard Binder
Beam Dimensions at -10°C
FIGURE 1b Stiffness versus Time for Sealant Q Using the Standard Binder Beam Dimensions at -10°C
FIGURE 2 Deflection versus Time for Sealant N for Three loading Magnitudes Using the Standard Binder Beam Dimensions at -40°C
FIGURE 3 Deflection versus Time for Sealant B for Three Loading Magnitudes Using the Standard Binder Beam Dimensions at -40°C
FIGURE 4 Designed New BBR Mold and Crack Sealant Beam
FIGURE 5a Deflection versus Time and Load versus Time for Sealant B Using the New 12.7mm Beam Thickness at -40°C
FIGURE 5b Stiffness versus Time for Sealant B Using the New 12.7mm Beam Thickness at -40°C
FIGURE 6 Virtual Work Method to Find Center Deflection FIGURE 7 Measured S60 for Ten Sealants at -40°C
FIGURE 8 S60 versus Temperature for Sealants M, N, and P FIGURE 9 Measured S60 for three Sealants at -10°C
FIGURE 10 Frequency Distribution of the COV
TABLE 1 Sealant specifications as reported by the manufacturers
a) Sealant B
Test Result
Penetration, 25°C (dmm) 148
Penetration, -18°C (dmm) 42
Needle penetration, 64°C, 50g, 5sec (dmm) 248 Needle penetration, 58°C, 50g, 5sec (dmm) 218
Flow, 60°C (mm) 0
Resilience, 25°C, % recovery (%) 80
Bond, -29°C, 3 cycles, 100% extension, 12.7mm specimen Satisfactory
Asphalt compatibility Pass
Flexibility, 3.2mm, -40°C, 10sec, 25.4mm, 90° bend Pass
b) Sealant Q Test Result Penetration, 25°C (dmm) 22 Resilience, 25°C, % recovery (%) 36 Softening point (°C) 104 Ductility, 25°C, 50mm/minute (cm) 45
Flexibility, 25mm, -1°C, 90° bend, 10sec Pass
Asphalt compatibility Pass
Bitumen content 61 Tensile adhesion (%) 700 Flow, 60°C (mm) 0 Brookfiled viscosity, #5 at 20rpm, 204°C (cP) 6800 c) sealant N Test Result Penetration, 25°C (dmm) 75 Flow, 60°C (mm) 0
Cold bond, -29°C, 3 cycles, 50% extension, 12.7mm specimen Pass Cold bond, -29°C, 3 cycles, 100% extension, 12.7mm specimen Pass
Resilience, 25°C (%) 70
Asphalt compatibility Pass
TABLE 2 Results of the Pairwise Comparison with Tukey Adjustments on ln(S60) Sealant Mean S 4.3466 1* C 4.2950 1 M 4.0380 2 L 4.0217 2 3 N 3.8615 2 3 4 G 3.8307 4 W 3.3568 5 H 3.2268 5 P 2.8430 B 1.8080
TABLE 3 Regression Parameters and S60 at 0°C and –10°C for Sealants M, N, and P*
Sealant a (ln S60) b (slope) S60 (@0°C), MPa S60 (@–10°C), MPa M -1.83 (0.20) -0.15 (0.00) 0.160 0.719
N -5.26 (0.49) -0.23 (0.01) 0.005 0.052 P -1.97 (0.50) -0.12 (0.01) 0.139 0.463 * The standard error of deviation is shown in parenthesis
0 0.1 0.2 0.3 0.4 0.5 0.6 0.7 0.8 0 20 40 60 80 100 120 140 160 180 200 220 240 Time (s) D ef le ct io n ( m m ) 0 200 400 600 800 1000 1200 L o ad ( m N ) Deflection Load
FIGURE 1a Load and Deformation versus Time for Sealant Q Using the Standard Binder Beam Dimensions at -10°C 1 10 100 1000 1 10 100 1000 Time (s) S ti ff n es s ( M P a)
FIGURE 1b Stiffness versus Time for Sealant Q Using the Standard Binder Beam Dimensions at -10°C
0 1 2 3 4 5 6 7 0 20 40 60 80 100 120 140 160 180 200 220 240 Time (s) D ef le ct io n ( m m ) 980mN 480mN 250mN
FIGURE 2 Deflection versus Time for Sealant N for Three Loading Magnitudes Using the Standard Binder Beam Dimensions at -40°C
0 1 2 3 4 5 6 7 0 20 40 60 80 100 120 140 160 180 200 220 240 Time (s) D ef le ct io n ( m m ) 980mN 250mN 100mN
FIGURE 3 Deflection versus Time for Sealant B for Three Loading Magnitudes Using the Standard Binder Beam Dimensions at -40°C
0 0.5 1 1.5 2 2.5 3 3.5 0 20 40 60 80 100 120 140 160 180 200 220 240 Time (s) D e fl ec ti o n ( m m ) 0 200 400 600 800 1000 1200 L o ad ( m N ) Deflection Load
FIGURE 5a Deflection versus Time and Load versus Time for Sealant B Using the New 12.7mm Beam Thickness at -40°C 1 10 100 1 10 Time (s) 100 1000 S ti ff n es s ( M P a)
FIGURE 5b Stiffness versus Time for Sealant B Using the New 12.7mm Beam Thickness at -40°C
(a) (b) (c) (d) (e) (f)
FIGURE 6 Virtual Work Method to Find Center Deflection
1 (Virtual load) 1/2 1/2 b h 1/2 1/2 x/2 Virtual shear, v Virtual moment, m L/4 P P/2 P/2 P/2 P/2 (Real load) Real shear, V Real moment, M Px/2 PL/4
0 10 20 30 40 50 60 70 80 90 B C G H L M N P S W Sealant S6 0 ( M P a)
1 10 100 -45 -40 -35 -30 -25 -20 -15 Temperature (°C) S6 0 ( M P a)
Sealant M Sealant N Sealant P
0 10 20 30 40 50 60 70 80 90 100 Q Y Z Sealant S6 0 ( M P a)
0 5 10 15 20 25 30 <4 4-6 6-8 8-10 10-12 12-14 14-16 16-18 Coefficient of Variation (%) F re q u en cy ( % ) 0 10 20 30 40 50 60 70 80 90 100 C u m u la ti v e F re q u en cy ( % ) Frequency Cumulative
-20 -15 -10 -5 0 5 10 15 20 0 20 40 60 80 100 Predicted S60 R es id u al (a) -0.25 -0.2 -0.15 -0.1 -0.05 0 0.05 0.1 0.15 0.2 0.25 0 1 2 3 4 5 Predicted ln(S60) R es id u al (b)