Publisher’s version / Version de l'éditeur:
Vous avez des questions? Nous pouvons vous aider. Pour communiquer directement avec un auteur, consultez la première page de la revue dans laquelle son article a été publié afin de trouver ses coordonnées. Si vous n’arrivez pas à les repérer, communiquez avec nous à [email protected].
Questions? Contact the NRC Publications Archive team at
[email protected]. If you wish to email the authors directly, please see the first page of the publication for their contact information.
https://publications-cnrc.canada.ca/fra/droits
L’accès à ce site Web et l’utilisation de son contenu sont assujettis aux conditions présentées dans le site LISEZ CES CONDITIONS ATTENTIVEMENT AVANT D’UTILISER CE SITE WEB.
Computer-Aided Design of User Interfaces IV (CADUI 2004) [Proceedings], 2004
READ THESE TERMS AND CONDITIONS CAREFULLY BEFORE USING THIS WEBSITE. https://nrc-publications.canada.ca/eng/copyright
NRC Publications Archive Record / Notice des Archives des publications du CNRC :
https://nrc-publications.canada.ca/eng/view/object/?id=1429f84b-bae4-46e4-9ffd-56f36b425f6d https://publications-cnrc.canada.ca/fra/voir/objet/?id=1429f84b-bae4-46e4-9ffd-56f36b425f6d
NRC Publications Archive
Archives des publications du CNRC
This publication could be one of several versions: author’s original, accepted manuscript or the publisher’s version. / La version de cette publication peut être l’une des suivantes : la version prépublication de l’auteur, la version acceptée du manuscrit ou la version de l’éditeur.
Access and use of this website and the material on it are subject to the Terms and Conditions set forth at
A Distributed Usage Monitoring System
Institute for
Information Technology
Institut de technologie de l'information
A Distributed Usage Monitoring System *
Gray, P., McLeod, I., Draper, S., Crease, M., and Thomas, R.
January 2004
* published in Computer-Aided Design of User Interfaces IV (CADUI 2004). Madeira, Portugal. pp. 121-132. January 2004. NRC 47450.
Copyright 2004 by
National Research Council of Canada
Permission is granted to quote short excerpts and to reproduce figures and tables from this report, provided that the source of such material is fully acknowledged.
Chapter #
A DISTRIBUTED USAGE MONITORING
SYSTEM
Philip Gray1, Iain McLeod1, Steve Draper2, Murray Crease3, Richard Thomas4
1Computing Science Department, University of Glasgow 2Psychology Department, University of Glasgow 3National Research Council Canada
4Computer Science & Software Engineering, The University of Western Australia
Abstract: We are developing a distributed computer system that supports usability and interaction studies, by handling the collection, storage and analysis of usage data, such as that generated by user-computer interaction and associated sensing devices (e.g., cameras). Data sources may be distributed as may be the data repositories and data consumers (other computer processes and human investigators). The system supports dynamic configuration of the entire process, including changes in the goals of the investigation itself. In this paper we describe the system’s key features, including a generic and evolvable data transport and processing network, a set of tools for capturing and cleaning usage data, a tool for instrumenting software for data capture, and a system for managing the entire process. We also report on several trials of the system, identifying successes, failures, lessons learned and areas for future development.
Key words: usage monitoring, usability testing tools
1.
INTRODUCTION
Usage data is central to investigative activities in a number of domains, including usability testing and educational research. In these studies data is taken primarily from events generated by user manipulation of keyboards, mice and other computer input devices, along with other observational data,
such as screen dumps and images or video streams from cameras. Although there are a number of software tools that support the capture, storage and analysis of such data, it remains difficult to manage such usage data, especially when the data is being collected from a number of machines, perhaps distributed over a large area and the analysis is being carried out by a number of researchers remotely from the data collection.
The Grumps Project at the University of Glasgow has been developing a set of software tools to address the opportunities and challenges of distributed usage monitoring, especially in the case of exploratory studies that do not have clearly defined and unchanging initial hypotheses and assumptions. We call studies of this type REDDIs: Rapidly Evolving Data
Driven Investigations [8]. Rather than focusing on a static set of fixed data
sources such as logfiles, it focuses on explorations by an investigator where the question evolves as much as the answer, as in data mining. The findings are as likely to be an unanticipated pattern in the data as a specific answer to a defined question. Calling them ‘investigations’ rather than ‘experiments’ highlights the fact that they may or may not have a prior hypothesis, let alone manipulate the circumstances being studied. These investigations depend upon data, and the possibility of collecting it easily (as opposed to using other methods, such as surveying human users); they are as much about what it is possible to learn from these sources as about answering prior questions. To call them "data driven" is to further emphasise their orientation to a particular technical opportunity. On the other hand, and in contrast to their logfile precursors and to data mining, the possibility is now emerging of changing or post-processing the data collected rapidly, in response to new interests, guesses, and hypotheses of the investigator; hence they are potentially "rapidly evolving", and so also not simply passive, post hoc, archaeological analyses of what comes to hand.
This paper describes the Grumps software framework designed to support REDDIs and the current tools that reside in that framework, for software instrumentation, event capture, event transport, processing and storage, and data preparation and analysis. Section 2 describes the key features of our approach to supporting usage monitoring. Section 3 surveys the framework and tools. Section 4 discusses the results of some early evaluations of our prototypes, while Section 5 looks at some related work. The paper concludes with a consideration of future directions for our work.
#. A Distributed Usage Monitoring System 3
2.
THE GRUMPS APPROACH
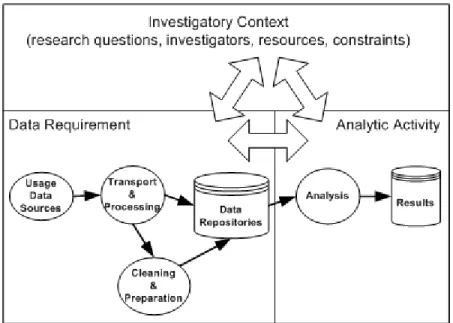
In the Grumps Project we have begun to develop a model of usage-based studies. At a high level of abstraction, such studies can be represented by the diagram in Figure 1.
Figure 1. Key Aspects of Usage-Based Studies The three key constituent aspects of a usage-based study are:
Investigatory context
This includes the investigation goals or research questions, the investigators, the resources (subjects, machines, time, money) and constraints that motivate and drive the rest of the investigation effort.
Data requirement
This describes the sources of raw usage data and other related data, the process of preparing it for study and the mechanisms for communicating it and storing it as necessary.
Analytic activity
The activity that relates data to investigation goals, by finding relevant patterns, correlations, etc.
The relationship of these three aspects – the ways in which they influence or determine aspects of one another – depends on the type of investigation. Thus, in the case of formal, hypothesis-driven experiments, the investigation goals determine a fixed formulation of the analytic activity (the experimental plan) and the data requirement is derived from that. In the case of most data
mining, the analysis and investigatory contexts cause changes in one another, but typically there is no change to the data collection. However, in the case of REDDIs, it is possible to start with any aspect of the investigation and derive the other aspects as needed. Furthermore, in the course of the investigation, the aspects may change; for example, a usage monitoring opportunity may arise that stimulates research questions, leading to analysis that generates new questions which in turn require new data to be gathered, perhaps of a new form.
The Grumps software framework, designed to support both experiments and REDDIs, is a dynamically configurable system that implements the data requirement aspect. The key features of our system are:
Generic
The system is not restricted to any predetermined set of data sources. It can handle any source of usage data, direct (e.g., keystroke logs) and indirect (camera output), even including the results of think-aloud protocol collection, as long as that data can be described in our simple usage data model (see section 3.1.1 below) .
Fundamentally distributed
Subject to security access, the sources of data can located anywhere, and the data processors and consumers can be anywhere (see Section 3.1.2).
Component-based
A Grumps Usage Data System consists of a set of dynamically
deployable components including data sources (event generators), data sinks (file archives or databases), routing components and data
processors (filters, abstractors, aggregators). The components can be modified through run-time change of parameters as well as by dynamic replacement (see Section 3.1.2).
Heterarchic: It is possible to use (some) Grumps tools usefully in a
stand-alone mode, but also integrated piece-wise fashion, starting from any point in the usage data handling process.
#. A Distributed Usage Monitoring System 5
3.
THE GRUMPS SOFTWARE FRAMEWORK
3.1
Support for Data Capture and Transport
3.1.1 Modelling Usage Data
Grumps usage data can be created by a number of different devices or processes. Raw usage data, which is the output from data capture devices, therefore, has a simple and flexible structure, to accommodate the variety of data being collected and the need to modify it easily into other forms. Raw usage data is organized into distinct sequences of usage events, called sessions. A session is a collection of usage events organized around an application-significant grouping of usage events. For example, it might be all the events collected from a user-computer interaction from login to logout of a single user.
A session is currently defined as follows:
Raw usage session = <session_id, start_time, end_time, user_id, machine_id, exit_reason>
Events belonging to a usage session are currently defined as follows:
Usage action event = <action_id, session_id, timestamp, type, body>
Session and action ids are unique identifiers for the data items. Timestamps provide a way of ordering the events. The body holds variant fields determined by the nature of the collection device and its configuration. These current definitions and indeed our modeling of usage data in general is still the subject of ongoing work (see sections 4 and 6).
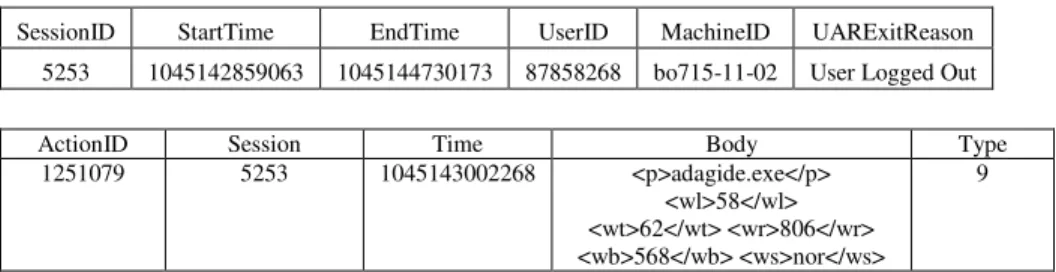
Examples of a typical instance of a session and a usage action event within that session are given in Table 1. This data comes from a relational database storing the results of one of our ongoing field trials. This study is further discussed in section 4.1.
SessionID StartTime EndTime UserID MachineID UARExitReason
5253 1045142859063 1045144730173 87858268 bo715-11-02 User Logged Out
ActionID Session Time Body Type
1251079 5253 1045143002268 <p>adagide.exe</p>
<wl>58</wl> <wt>62</wt> <wr>806</wr> <wb>568</wb> <ws>nor</ws>
9
Note that the event record stores an XML representation of keystroke data generated by an operating system monitor process.
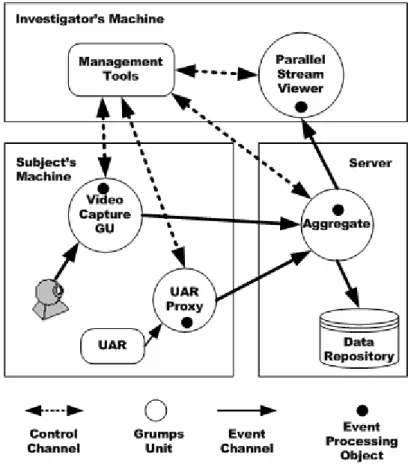
Figure 2. An example GrumpsNet
Event type is sometimes inferrable from the body, but not in the general case (e.g., the body might be a pixmap generated by a camera). In addition, explicitly including the event type helps tools that behave differently based on the event type.
3.1.2 Data Transport and Processing
Usage data is handled by a network of data processing components. See Figure 2. These components are known as GRUMPS Units (or GUs) and connected in a graph, called a GRUMPSNet [9]. Each GU receives data in the form of events, optionally transforms these events (for example compresses them or combines events from multiple sources), and passes them to other GUs in the network. This decouples each step in the data
#. A Distributed Usage Monitoring System 7 pipeline, facilitating dynamic reconfiguration of the GrumpsNet in response to changes in investigatory context, data requirements or analytic activity.
Figure 2 illustrates a hypothetical GrumpsNet that can be used to support many usability studies combining data captured about user activity (via the UAR component, see section 3.1.2) and images of the user captured via a webcam. The data from these two sources is then combined by connecting them to the aggregator GU. The aggregator generates “super sessions” that associates sessions from the two separate streams of captured data, thus creating an association between the streams. The aggregator’s output is sent to a parallel stream viewer GU that displays the output to an investigator in realtime. Note that the output of the aggregator is also sent to one or more data repositories. For clarity, this is not shown, but it could be done through an XML-to-SQL transformation GU.
Dynamic configuration and reconfiguration of a GRUMPSNet is done through Control Events. A Control Event contains code which can be sent to a GU and executed remotely. Values can also be returned via reply events. In this way, components of the network can be connected to or disconnected from each other, or even replaced altogether by components with different functionality. A GU can also be interrogated via standard control events to bind, unbind, edit and discover properties at runtime. These properties contain information about the current state of the GU – by registering remote listeners on the properties, other parts of the network can keep track of the state of a GU and even veto changes. For example, our data collection network in Figure 2 could be reconfigured to add a GU between the two sources and the aggregator that controls the sources, switching off video collection during a period with no user activity.
3.1.3 Data Production
We have produced several different data capture devices that can be connected to a GrumpsNet. These include
User Action Recorder
This is a tool, written in C++, that registers with operating system hooks in Microsoft Windows and captures keystrokes, window focus and mouse events. To provide user privacy, it can be configured to provide various levels of obfuscation of user data (e.g., replacing specific characters by a single generic alphanumeric character).
Specially instrumented Java applications
We have developed a system, iGuess [7], that allows the customizable instrumentation of an executable Java application (no source code is needed), inserting a Grumps Unit into the instrumented application.
Independent applications
We have constructed a Grumps Unit tailored for the capture of images from a webcam.
In general data sources constructed via any of these three methods can provide three levels of increasing power, depending on their conformance with the Grumps data and control models. At the lowest level, any component that can produce data (e.g., write data to a file) is a potential Grumps data source. Clearly, in this case the data format may limit the utility of the usage data, since it does not conform to the Grumps schema and thus may be inappropriate for some uses. Sources that produce data conforming to the Grumps schema, on the other hand, can be processed using our set of data cleaning, preparation and analysis tools (see section 3.2). Finally, data sources that offer a control interface can be dynamically configured at run-time as well, providing the maximum level of Grumps functionality.
3.2
Support for Data Preparation and Analysis
Once collected data must be cleaned, transformed to make it amenable for analysis and subjected to additional processing to extract information (e.g., statistical analysis).
In the Grumps framework these operations can be performed:
By Grumps components in the network, e.g., prior to storage in a
repository, filtering, abstraction, aggregation, etc.
As relational operations on database tables
Via processing using other general and special purpose utilities.
As part of field trials (see section 4.1) we have constructed a number of useful general purpose data preparation routines, packaged as T-SQL stored procedures. We have also built a viewer for parallel data streams, useful for visualising heterogeneous sequential data.
4.
EARLY USES OF THE FRAMEWORK
4.1
Evaluation and Field Trials
We have tested components of the Grumps framework in several settings, including
1. two data capture episodes involving a first year undergraduate university
#. A Distributed Usage Monitoring System 9 2. a study of the effects of interruption on user behaviour;
3. a study of the "Think Aloud Screen" at Simula Labs in Norway [5].
These studies have been quite different, enabling us to examine issues arising from the range of usage-based studies, including:
– Data capture constraints
The programming study had strong security and engineering constraints. The data had to be anonymised at source and had to run with minimal disruption to network and users .
– Scale
The two programming lab studies were carried out over several months, the second collecting over four million actions from 141 students. The study at Simula involved about 50 users over several sessions. The interruption study, on the other hand, is collecting data in 1 week sets from a total of four users.
– Collaboration
The programming lab study involved several concurrent investigations involving different researchers located in the UK and Australia. The Norwegian study and the Interruption study have single investigations.
– Investigation Type
The studies have ranged from highly exploratory studies to well-defined experiments. Thomas et al [8] presents a brief account of the use of the Grumps system in of the programming laboratory studies, identifying issues of data capture, transport, cleaning, preparation and analysis.
4.2
Lessons learned
While we anticipated that the support of REDDIs would demand a high degree of flexibility across every aspect of data collection, storage and processing, we have found flexibility to be important for other reasons, too.
GrumpsNet, due to its component based nature, affords many different connection methods. For example, “GrumpsNet Lite”, a version of GrumpsNet uses local caching of events in files in transport rather than direct streaming of events across the network. This proved to be useful in the programming lab studies, reducing network traffic during peak times. Its simplicity also appealed to the network administrative staff who were understandably concerned to run a system with a high degree of robustness and reliability and a minimum impact on other processes.
In order to support different data sources, low-cost exploration of different questions and the sharing of data between investigations, we have found it important to keep the original raw data in a form that has minimal fixed attributes. XML has proved useful as a representation for the variant
part of the data, since it is easy to transform into other formats via XSL, e.g. SQL for storage, SMIL for visualization, HTML for printing.
We have found that there are important and costly demands and constraints on individual studies that have emphasized the importance of configurability. For example, some studies require heavyweight anonymisation and data access controls that prevent subjects from viewing usage data temporarily stored on their machines. For other investigations, such features are only an impediment to efficient research activity and are not needed. A framework like Grumps should make it possible to customise such facilities with minimum impact on the rest of the usage monitoring system.
Raw usage is fundamentally temporal and thus sequential. This has implications for the way the data is modeled and handled. In many cases it is important to have direct sequence information, independent of timestamp, both for efficiency in performing sequencing operations (e.g., over millions of events) and for checking that no events have been lost (e.g., dropped video frames due to an unreliable network connection). Synchronisation of events from independent data sources remains an area for further work.
Complicated investigations can involve a large number of concurrent data sources, a complicated transport network, considerable data cleaning and data preparation for analysis. This results in many intermediate files and database tables, not to mention a range of subsequent complex analyses, again requiring intermediate results to be stored. All of this complexity can place severe management demands on investigators. Particularly in the programming lab studies we have become aware of the importance of higher-level investigation management support and the need for reusable representations and packaged processing routines. Handling intermediate processing has become a key bottleneck in the process and is now a major focus of our attention for future development.
5.
RELATED WORK
There are many existing systems that support usage-based studies, including commercial products and research systems. These range from built-in logging facilities, like those in the BlueJ programming environment [6] through web testing systems such as WebQuilt [4] to full-featured human behaviour experimentation environments like those from Noldus1. Such systems, where loggable events are determined by what is exposed by the system or related medium (e.g., http requests), can be efficient, but its value 1 www.noldus.com
#. A Distributed Usage Monitoring System 11 depends on the match to monitoring needs. Thus, a system that records interactions only at the command level can miss important information (e.g., whether the command is invoked via menu, accelerator or toolbar), while logging at too low a level of abstraction can generate too much data. The Grumps system makes it possible to tailor the level of abstraction to the requirements of the problem. This was used successfully in our programming lab studies when, for the second study, specialised command logging was added to the programming environment [8].
The KALDI system [1] provides integration of data capture, transport and analysis. However, it has opted to capture usage data via one approach, viz., specializing the Java windowing classes. This restricts the genericity of the system compared to Grumps.
Hilbert and Redmiles’ internet-based usage data capture system [3] provides powerful distributed transport of events and is designed to deal with the problems of scale arising from large-scale usage studies. However, their code instrumentation approach requires modification of source code.
The Grumps data transport system is similar to DataGrid [2] which uses a dataflow graph to represent the processing of data for experimental purposes. In DataGrid, processing is specified in a language that can be used to construct and configure the data processing. We have not yet done this in Grumps, although it should be feasible given the dynamic configurability of the GrumpsNet infrastructure (see section 6 below).
6.
CONCLUSIONS AND FUTURE WORK
The Grumps Usage Monitoring System offers a generic approach to the support of both experiment and exploratory studies of human-computer interaction. It is scalable, dynamically configurable and able to support the evolution of a study as findings generate new research and evaluation questions.
Although we have built and developed a working prototype and learned from its deployment in real trials of different kinds, there remains much to be done to achieve our aims. A key requirement, that we are tackling at the moment, is description languages for all three aspects of an investigation. In particular we need to be able to describe all potential data that can flow through a GrumpsNet plus the capture, transport and processing of the data performed by the network. Specifications in this language can be generated by tools like iGuess and used to create a GrumpsNet and to control its operation at runtime; the specifications can also be used to describe tracked changes in the system. These descriptions might also be reused between studies, forming investigatory patterns.
The current set of Grumps data preparation tools have not been fully integrated into GrumpsNet. In particular, we have not addressed the question of tool support for constructing sequences of these operations using higher level descriptions so that we can replace one implementation (e.g., a database macro) with another (e.g., a special purpose grumps component). This will be a key requirement for the GrumpsNet modeling language. Also, iGuess, our code instrumentation system, is limited to Java at present. However, the same approach is applicable to any bytecode-based language, e.g., C#. We intend to extend iGuess to handle this and possibly other languages, as opportunities allow.
ACKNOWLEDGEMENTS
This work was funded by EPSRC Grant GR/N38114. We wish to thank Malcolm Atkinson, Margaret Brown, Quintin Cutts, Huw Evans, Gregor Kennedy, Rebecca Mancy and Karen Renaud, who have all contributed to the work described in this paper.
REFERENCES
[1] Al-Qaimari, G. and McRostie D., KALDI: A computer-aided usability engineering tool for supporting testing and analysis of user performance, in Proceedings of the 15th Annual Conference of the British HCI Group, IHM-HCI'2001, Lille, France, 2001, pp. 153-169. [2] Foster, I., Vöckler, J., Wilde, M., Zhao, Y., The Virtual Data Grid: A New Model and
Architecture for Data-Intensive Collaboration. http://citeseer.nj.nec.com/554758.html [3] Hilbert, D.M. and Redmiles D.F., Extracting Usability Information from User Interface
Events, ACM Computing Surveys, Vol. 32, No. 4, Dec 2000, pp. 384-421.
[4] Hong, J.I., Heer, J., Waterson, S., and Landay, J.A. WebQuilt: A Proxy-based Approach to Remote Web Usability Testing, ACM TOIS, Vol. 19, No. 3, July 2001. http://citeseer.nj.nec.com/454004.html.
[5] Karahasanovic, A., Anda, B., Arisholm, E., Hove, S.E., Jørgensen, M., Sjøberg, D. A Think-Aloud Support Tool for Collecting Feedback in Large-Scale Software Engineering Experiments: Simula Research Laboratory Technical Report 2003-7, 2003.
http://www.simula.no/publication_one.php?publication_id=603
[6] Kölling, M., Quig, B., Patterson, A. and Rosenberg, J. The BlueJ system and its pedagogy. The Journal of Computer Science Education, Special Issue on Learning and Teaching Object Technology, Vol. 13, No 3, Dec 2003.
[7] Mcleod, I.A. IGUESS: Instrumentation of Bytecode in the Production of Grumps Event Sources. BSc project report. University of Glasgow, 2003.
[8] Thomas, R.C., Kennedy, G.E., Mancy, R., Crease, M., Draper, S., Evans, H., Gray, P.D. Generic usage monitoring of programming students, Proc. ASCILITE 2003.
[9] Evans, H., Atkinson, M., Brown, M., Cargill, J., Crease, M., Draper, S., Gray, P.D., Thomas, R.C. The Pervasiveness of Evolution in GRUMPS Software. Software: Practice and Experience, vol. 33, no. 2, February, 2003.