BEHAVIOR OF ALLOY 617 AT
650
0C
IN LOW OXYGEN PRESSURE
ENVIRONMENTS
by
FANNY MAS
Submitted to the Department of Materials Science and Engineering
in Partial Fulfillment of the Requirements for the Degree of
Master of Science in Materials Science and Engineering
at the
Massachusetts Institute of Technology
September 2010
@ 2010 Massachusetts Institute of Technology
All rights reserved
Signature of
Author-F
department
of Materials MASSACHUSETTS INSTITUTE OF TECHN OLOYNOV 19 2010
LIBRARIES
ARCHIVES
Science and Engineering
July 29, 2010
Certified
Professor of Nuclear Engineering and Materials
Ronald G. Ballinger
Science and Engineering
Thesis Supervisor
/
.//Christine Ortiz
Chair, Departmental Committee on Graduate Students
Accepted
BEHAVIOR OF ALLOY 617 AT 6500C IN LOW OXYGEN PRESSURE
ENVIRONMENTS by
FANNY MAS
Submitted to the Department of Materials Science and Engineering On July 29th , 2010 in Partial Fulfillment of the
Requirements for the Degree of Master of Science In Materials Science and Engineering
ABSTRACT
The behavior of alloy 617 at 650'C in low oxygen partial pressure environments has been studied under static loading. Of particular interest was the crack growth rate in these conditions. For that, tests were conducted at a constant stress intensity factor of 49.45 MPa'm (45 ksidinch) using a direct current potential drop measurement system to determine crack length. High purity argon gas allowed establishing an oxygen partial pressure as low as 10-22 atm and premixed oxygen/argon gases were used to vary the oxygen potential. To go dee er into the understanding of the phenomena involved, a creep test (constant load of 1.21x10 N in argon environment) and a corrosion experiment (50 ppm oxygen in argon for 500 hours
without any load) were also added.
The crack growth tests led to a particularly unexpected result: whatever the oxygen potential, the crack growth rate increased with time and the plot for the crack length versus time displayed a recurrent parabolic shape without any change in the environment. No unique
crack growth rate could be defined in a given environment and the influence of the
environment on the crack growth rate was not clearly visible. Multiple features were found to surround the main crack: secondary cracks parallel to the principal one, intergranular cracking ahead of the crack tip, wedge cracks at grain boundaries and aggregates of Cr-rich carbides near the lips of the crack. Moreover no extensive oxide scale was formed on the surface of the sample exposed to the corrosive environment (50 ppm oxygen in argon) for 500 hours. The non-constant crack growth rates, together with the observed cracking features, were attributed to the competition between creep deformation and mechanical fracture, likely environmentally enhanced. An exponential law was found to fit the data for the crack growth rate as a function of time for a K of 49.45 MPalm (45 ksi'inch). The effects of the
environment were overcome by mechanical and thermal processes leading to damage accumulation and so, a reaction of alloy 617 to the external stress and temperature highly dependent on time. This behavior was compared with the one of alloys Haynes 230 and Incoloy 908 in the same conditions.
TABLE OF CONTENTS
ACKN OW LED GEM ENTS ...
9
1. INTRODUCTION ...
10
2. BACKGROUN D ...
15
2.1 High temperature oxidation of Ni-base superalloys... 15
2.1.1 Solid-solution strengthened nickel-chromium base alloys ... 15
2.1.2 Precipitate strengthened nickel-chromium base alloys... 16
2.1.3 Oxidation experiments on Inconel 617... 18
2.1.4 Effects of impurities in helium coolant ... 19
2.2 Crack growth in oxygen-containing environments ... 20
2.2.1 Crack propagation under cyclic loading... 20
2.2.2 Sustained load crack propagation... 23
2.2.3 Potential mechanisms for oxygen enhanced crack growth... 24
2.3 Creep behavior of Inconel 617... 27
2.3.1 Results of creep testing... 28
2.3.2 Microstructure changes during creep ... 30
3. EXPERIM ENTAL PROCEDURES ...
35
3.1 M aterials... 35
3.2 Constant K crack growth tests ... 37
3.2.1 Experimental setup ... 37
3.2.2 Direct current potential drop technique ... 39
3.2.3 Test procedures... 40 3.3 Corrosion experiment ... 41 3.4 Creep testing ... 42 3.5 M icrostructure investigation... 44 3.6 Fracture analysis ... 45 3.7 Compositional analysis... 45
4. RESULTS...
46
4.1 Grain size and microhardness... 46
4.2 Crack growth tests...50
4.2.1 Alloy 617 in pure argon environment (sample 617-CT-36)... ... 51
4.2.2 Influence of the environment (samples 617-CT-22 and 617-CT-35)... 53
4.2.3 Influence of the stress intensity factor level (sample 617-CT-29) ... 56
4.2.4 Comparison with other alloys... 57
4.3 Fractography ... 60
4.3.1 Mode of failure... 60
4.3.2 Crack morphology ... 62
4.3.3 W edge cracks and cavities... 66
4 .3.4 P recipitation ... 67 4.4 Corrosion testing ... 70 4 .4 .1 A lloy 6 17 ... 7 1 4 .4 .2 A lloy 230 ... 75 4 .4 .3 A lloy 90 8 ... 77 4.5 Creep investigation...81 4 .5.1 C reep curve... 8 1 4.5.2 Sample observation ... 83
5.
DISCUSSION ...
85
5.1 Crack growth rates... 85
5.2 Cracking features and potential mechanisms for crack growth ... 94
5.3 Corrosion results and correlation with crack propagation ... 96
6. CON CLU SION AND FUTURE W ORK ...
98
APPENDIX A : TEST PLAN S...
100
APENDIX B: DCPD CRACK GROWTH MEASUREMENTS... 104
APPENDIX C: XRD DATA ...
106
LIST OF FIGURES
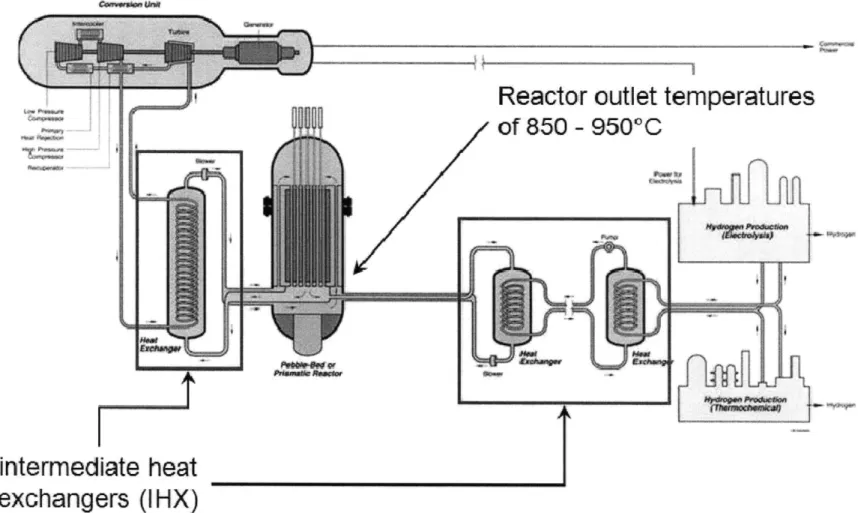
Figure 1. Schematic showing the organization of the VHTR including a power generation unit and a
hydrogen production plant ...----...---... -11
Figure 2. Effect of aluminum content on the air oxidation rate of Ni-20Cr alloys [3]... 16
Figure 3. The oxidation of Ni-Cr-Al alloys after Gigging and Pettit [5]. (a) The three different m echanism s. (b) The oxidation m ap at 1000'C... 17
Figure 4. SEM photo showing the spallation of the outer Cr203 layer at 1100*C after (a) 24h. (b) 200h. ... 1 8 Figure 5. Fatigue life of IN706 as a function of temperature under air and vacuum conditions [15] .. 21
Figure 6. Crack growth rate vs. stress intensity range. (a) data from Benz [21] at R=0.1, from Hsu [22] at R=0.05. (b) data from Benz at R=0.5, from Hsu at R=0.6... 23
Figure 7. Microstructural phenomena susceptible to occur at the crack tip... 25
Figure 8. External oxide and internal voids formed in Ni270 after air exposure at 10000C for 200h [19] ... ... ... 2 6 Figure 9. Creep curves of alloy 617 vs. temperature and applied stress. (a) Applied stress = 0.10YS. (b) Applied stress = 0.25YS. (c) Applied stress = 0.35YS ... 28
Figure 10. TTT diagram for alloy 617 [45] ... 31
Figure 11. HRC plotted as a function of creep duration for different specimens [28]. The values indicated as literature are from the work of Mankins et al. [43]... 32
Figure 12. Redistribution of carbides and formation of voids during a creep test at 1000*C. The array indicates the direction of the applied stress... 33
Figure 13. A schematic representation of microstructure changes observed in solution treated Inconel 617 during creep at 10000C [31]... 34
Figure 14. CT specimen geometry (All the dimensions are in inches) ... 37
Figure 15. Schematic of the experimental setup for constant K crack growth tests ... 38
Figure 16. Schematic illustration of the control of the mechanical testing system... 40
Figure 17. Schematic of the experimental set-up of the corrosion experiment... 42
Figure 18. Experim ental set-up for the creep test. ... 43
Figure 19. Microstructure of 617 in the as-received condition ... ... 46
Figure 20. Microstructure of 617 after 500 hours at 650'C... 47
Figure 21. Microstructure of 230 in the as-received condition ... 47
Figure 22. Microstructure of 908 in the as-received condition ... 48
Figure 23. Screen shot during hardness measurement ... ... 50
Figure 24. Crack length versus time (K=49.5 MPaVm; P(02)= (10 ] A(-22) atm). ... 51
Figure 25. Crack growth rate versus time (K=49.5 MPaVm;P(02)= (10 A(-22) atm) ... 52
Figure 26. Linear regression to obtain the steady state crack growth rate (K=49.5 MPaVm; P(0 2)= 10
)
A(-22) atm )... 53Figure 27. Crack length versus time with a change of environment (sample 617-CT-22)... 53
Figure 28. Crack growth rate versus time with a change of environment after 170 hours (sample 617-C T -2 2 ) ... 5 4 Figure 29. Static crack growth behavior for alloy 617 as a function of oxygen partial pressure at 6500C and K=49.5 M PaVm from Benz [21]. ... 55
Figure 30. Crack length versus time (sample 617-CT-35)... ... ... 56 Figure 31. Plot of the crack length versus time for sample 617-CT-29 (K = 35 ksi inch)... 57 Figure 32. Crack length versus tim e (sam ple 908) ... 58 Figure 33. Crack length versus time for alloy 230. The oxygen partial pressure, the crack growth rate da/dt and the correlation coefficient R2
for the linearization are displayed on the curve for each d o m ain ... 6 0
Figure 34. Scanning electron micrograph of the fractured surface of sample 617-CT-22 which
demonstrates a clear interface between transgranular and intergranular failure... 61 Figure 35. View of the intergranular fracture surface at higher magnification (160x)... 61 Figure 36. Scanning electron micrograph showing the shift from a straight fracture to a winding crack (The sample has been polished before observation with the SEM). ... 62 Figure 37. SEM micrograph showing the extent of the cracking affected zone ahead of the crack tip (sam pl e 617-CT-36) ... 63
Figure 38. SEM micrograph showing secondary cracks aligned with the main crack (sample 617-CT-3 5 )... 6 3
Figure 39. . Crack tip region of specimen 617-CT-36. (a) before polishing. (b) after polishing... 64 Figure 40. Crack tip region of specimen 617-CT-29 showing secondary cracks ahead of the main one
... 6 4
Figure 41. Optical micrograph showing the crack path on sample 908 surface ... 65 Figure 42. Scanning electron micrograph showing the inside of the crack for the 908 sample exposed to 10 vppm oxygen environm ent... 65 Figure 43. Optical micrographs showing the crack formed by linked voids in alloy 617 (a) at a
m agnification of 100x (b) at 200x... 66 Figure 44. Optical micrograph showing the precipitation of particles under the surface in the lips of the crack (sam ple 617-CT-22)... 67 Figure 45. Optical micrograph of the sample's surface on one side of the crack, showing a high concentration of precipitates... 68 Figure 46. Optical micrograph showing the surface of a sample (plane LT-RD) with a gradient of precipitates from the left (fractured surface) to the right (edge of the sample)... 69 Figure 47. EDX mapping showing identification of chromium-rich precipitates ... 70 Figure 48. The three coupons at the end of the high-temperature corrosion experiment (500 h, 650"C, 50 ppm 0 2 in argon). ... 71
Figure 49. SEM micrograph showing a cross-section of alloy 617 after exposure to 650*C and 50 ppm oxygen environm ent for 500h... 71
Figure 50. Compositional mapping images of the cross-section performed in the 617 alloy. ... 72 Figure 51. EDX compositional mapping taken inside the upper layer to magnify the segregation of alu m in u m ... 7 3
Figure 52. XRD spectrum with peak identification for alloy 617... 74 Figure 53. SEM micrograph showing a cross-section of alloy 230 after exposure to 650*C and 50 ppm oxygen environm ent for 500h... 75 Figure 54. EDX compositional mapping (a) entire cross-section (b) zoom around carbide...76 Figure 55. XRD spectrum with peak identification for alloy 230... 78 Figure 56. SEM micrograph showing a cross-section of alloy 908 after exposure to 650"C and 50 ppm oxygen environm ent for 500h ... 79
Figure 58. XRD spectrum with peak identification for alloy 908... ... 80 Figure 59. Plot of the displacement versus time in the creep experiment conducted at 6500C and an applied load of 1.21 104 N ... 82
Figure 60. Deformation features observed after a creep test (a) at the tip of the notch (b) at the ro u n d h o le s... 8 3
Figure 61. Aspect of the notch after creep experiment followed by polishing of the specimen to the 0 .0 5 m g rit ... 8 4
Figure 62. Decrease in applied load during a constant K testing (sample 617-CT-36)...88 Figure 63. Crack growth rate (a) as a function of stress intensity factor K for various loads and
temperatures (b) as a function of the C* integral for various loads at 8500C ... 90 Figure 64. Photograph of the 617-CT-36 specimen after testing showing the sizes of the creep zone and the uncracked ligam ent... 91
Figure 65. Regression for da/dt versus time for sample 617-CT-36 tested in argon environment ... 92 Figure 66. Corrected da/dt versus time to try to suppress the effects of the time dependency (sample 6 17 -C T -2 2 )... 9 3
Figure 67. Scanning electron micrograph showing a) the zone around the crack where microstructural changes occur, the drawing of the limits have been added (b) the departure of cracks from
LIST OF TABLES
Table 1. Values of the creep parameters n and Q obtained with various experimental conditions. .. 29
Table 2. Nominal chemical composition of the alloys (in wt. %) ... ... 36
Table 3. Tensile properties of the alloys at room temperature ... ... 36
Table 4. An example of test plan for specimen 617-CT-35 with an initial ratio a/W = 0.4088 after p re cracking ... 4 1 Table 5. Etching procedure... ... 44
Table 6. Grain size m easurem ents ... 49
Table 7. Hardness m easurem ents ... 50
Table 8. Crack growth rates for alloy 908 in various environments... 59
Table 9. Mechanical properties and crack growth behavior of some Ni base alloys. The results are from a study by Sadananda and Shahinian. Alloys 617 and 908 are added for comparison... 88
ACKNOWLEDGEMENTS
I would like to thank all of those who were supportive and provided encouragement through my time
1. INTRODUCTION
The increase in the world's energy demand requires the development of new energy sources. Nowadays nuclear energy represents 16% of the world's energy supply and this proportion will certainly tend to grow in the future. In the constant battle to increase efficiency, safety margins and lower cost, a new breed of nuclear reactors, Generation IV, is being developed. This ensemble of nuclear reactor technologies that could be built by 2030, have the promise of significant improvements in economics, safety, reliability and sustainability over the currently operating reactor technologies. In 2002, six different concepts were selected by a group of countries who joined together to form the Generation IV International Forum. Among these designs is the Very-High-Temperature Reactor (VHTR), a graphite-moderated, helium-cooled reactor with a once-through uranium fuel cycle. The goal of this gas-cooled reactor is to produce helium at temperatures as high as 950'C and pressures up to 7 MPa for a design life of 60 years. In some configurations approximately 90% of the VHTR heat will be used to generate electricity and 10% to produce hydrogen. Helium circulation allows removing the heat generated in the reactor core to the power conversion unit or the hydrogen-production plant. The Intermediate Heat Exchanger (IHX) is the component in which the heat from the primary circuit helium is transferred to the secondary, thus keeping the secondary circuit free of radioactive contamination. A schematic of the reactor is provided in Figure 1 and enables to localize the IHX.
Reactor outlet temperatures
intermediate heat
exchangers (IHX)
Nickel base superalloys, especially the precipitation hardening superalloys, have been widely used in many high-temperature applications because of high-temperature strength, oxidation resistance, creep resistance, and phase stability. However they are not suitable for the case of VHTR because the operating temperatures are so high that the precipitates responsible for the high strength of the material are no longer stable. On the other hand, the solid solution hardening superalloys that rely on lattice distortion due to alloying elements or
MC type carbide precipitation for their strength can maintain considerable strength at higher
temperature and so are considered as suitable for the VHTR applications. Among these superalloys, Inconel 617 and Haynes 230 are the two main candidates for the JHX. Both have attractive properties for high temperature applications. Alloy 617 is often considered for use in aircraft and land-based gas turbines, chemical manufacturing components, metallurgical processing facilities and power generation structures. Compared with 617, alloy 230 is considered relatively new and serves similar applications as a competitor material of alloy
617. For both of them, the high nickel and chromium contents provide high resistance to a
variety of reducing and oxidizing environments. The aluminum, in conjunction with chromium, offers oxidation resistance at high temperatures. These materials have to exhibit good resistance towards corrosion as it is expected that the VHTR's cooling gas be polluted
by air ingresses during abnormal/accident conditions, internal leakages or the degassing of
adsorbed species out of the large amount of graphite used. Typical impurities are H2, H20,
CH4, CO, N2 and CO2 in the microbar range, which can react with the metallic components.
Depending on their relative concentrations and on the helium temperature, the interaction of these impurities with metallic materials may or may not lead to internal and surface oxidation and may cause alloy carburization or decarburization. However, it should be noted that both alloy 617 and 230 were developed for oxidizing conditions. At very low oxygen partial pressures it may be possible to destabilize the protective oxide film and promote internal oxidation. Under these conditions the environment may significantly affect crack growth. Additionally, under carburizing conditions alloy 230, containing large amounts of carbide forming elements (W for example) may selectively form carbides which may also degrade properties.
For a material to be qualified, a significant amount of data must be acquired; various mechanical behavior models must be developed; strengthening mechanisms must be well understood; metallurgical evolution and stability must be accurately predicted and most importantly, the material must be approved by American Society of Mechanical Engineers
Boiler and Pressure Vessel Code (ASME B&PV Code) for nuclear applications at elevated temperatures. A draft code case for alloy 617 was submitted in the late 1980s, but it was concluded that there was insufficient information on creep-fatigue behavior and high temperature weldment fatigue to allow code qualification. Additionally, since the IHX must operate over a wide temperature range (500-950*C) it is possible that environmental effects may be present at lower temperatures, below the creep range. This present work concentrates on alloy 617 as it appears closest to gaining code approval and alloy 230 will only be used for the needs of comparison. The work focuses on the 650*C temperature range. This temperature is located in the "grey" area for these materials where both creep and time-independent processes can contribute to the overall behavior.
The initial goal of this project was to pursue the work done by Julian Benz for his Master's thesis about the effects of oxygen potential on high temperature crack growth in alloy 617 [21]. His study was essentially concentrated on crack propagation under fatigue conditions at different frequencies, R-ratios and levels of stress intensity factor range AK as a function of oxygen partial pressure. Static loading was also investigated which showed a decrease in the crack growth rate when the oxygen partial pressure was increased (from 2 x
10-7 to 10-3 atm) at an applied K of 49.45 MPa
iT
(45 ksidinch). As neither a definitive conclusion nor a complete understanding of the processes involved could be reached, further experiments were needed to explore this unexpected tendency. Some of the uncertainty in the previous results may have been due to the high value of K employed. In some cases, the previous results may have been influenced by deviations from ASTM requirements regarding plastic zone size. This work aims at further investigating the synergistic effects of sustained load, environment and temperature in the case of alloy 617. The environment of interest is characterized by a low oxygen partial pressure whereas both alloy 617 and 230 were initially designed to operate in a highly oxidizing environment where the formation of protective chromium (or aluminum) oxide based films predominate. At very low potentials, where the protective film may not be stable, these materials are not optimized and may be susceptible to embrittlement by oxygen transport along grain boundaries and/or to the effects of decarburization. For VHTR, the development effort has been largely focused on investigating the behavior of alloy 617 at the maximum expected operating temperature where creep is expected to dominate. However the full operating temperature range covers 450 to 950'C. At the lower end of this range, cracks may initiate and propagate if substantial stresses are maintained at the crack tip. For this study a temperature of 650'C has been chosen as itcorresponds to an intermediate and crucial domain where creep and mechanical (time independent) crack growth may interact and produce unexpected effects.
The objectives of this study are stated as follow:
>
Measure the crack growth rate in alloy 617 at 650'C in low oxygen potentialenvironments under stress intensity factors expected to exist in the NGNP heat exchanger systems (K = 49.45 or 38.5 MPalm). The higher K was chosen to overlap
with previous conditions studied by Benz and the lower K was chosen as a mean of comparison to investigate the effects of the stress intensity factor level.
>
Identify the effects of environment, especially the oxygen partial pressure, on thecrack propagation rate and the crack morphology (crack path, mode of failure, cracking features).
>
Compare the behavior of alloy 617 to the one of alloys 230 and 908 in the sameconditions and identify the processes responsible for the differences. Alloy 908 is known to be highly susceptible to oxygen embrittlement at 650'C and intermediate oxygen partial pressures (>0.1 ppm).
>
Investigate the corrosion behavior of the above alloys at 650'C and relate it to thecrack growth characteristics in the different environments.
>
Determine the mechanisms (environmental influence, creep deformation, brittlefracture) operating in the conditions of interest and responsible for the crack propagation in alloy 617.
2. BACKGROUND
The following literature review is focused on various aspects of nickel-base superalloys' behavior relevant for high temperature applications. Oxidation, crack growth and creep transformations will be investigated in order to help understand the mechanisms potentially involved in alloy 617 under static loading at 650'C and low oxygen partial pressures. As the effects of many different factors are entangled in the final observed behavior, it is important to study them first separately to underline the role played by each of them.
2.1 High temperature oxidation of Ni-base superalloys
This first part will be dedicated to the oxidation behavior of Ni-base superalloys, especially 617 and 230 in the absence of any load, the main parameters being the oxygen partial pressure and the temperature.
2.1.1
Solid-solution strengthened nickel-chromium base alloys
Most nickel superalloys are based upon the nickel-chromium system with the chromium content being the major factor governing oxide formation and oxidation rate. A detailed investigation of the oxidation behavior of simple Ni-Cr alloys has been performed by Giggins and Pettit [1] and the chromium content necessary to grow a sufficiently protective Cr2O3
scale on nickel-base superalloys lies between 20 and 30%. However it is usually chosen around 20% in order to prevent the formation of topologically close-packed (TPC) phases that occur at high chromium levels and cause brittleness and reduction in strength and ductility. The advantages of Cr203 as a protective oxide layer are the rapid initial growth, the ability to
develop a tight protective oxide layer, the spallation resistance in cyclic oxidation and the capability of regrowth of the protective oxide in the event of scale rupture [2]. However at temperatures above 1000'C, Cr2O3 is known to transform into the volatile species Cr03 and
the rupture of the protective scale leads to rapid oxidation of the metal matrix depleted in chromium.
Even though chromium plays the major role in oxidation resistance, the other solid-solution hardening and carbide forming elements cannot be completely neglected. Although they are mostly added to provide strength, they can also influence the oxidation processes. For
example, the beneficial effect of aluminum to improve corrosion resistance in nickel chromium alloys has been demonstrated [3]. In Figure 2, at a given temperature, as the aluminum content is increased, the oxidation rate is shown to decrease and then reach a minimum value. This is due to the formation of volatilization resistant A1203. But high
aluminum content can also have detrimental effect, as it is the case of alloy 693 (wt% Al =
3.36) in air at 1000'C [4]. The growth of aluminum oxide along grain boundaries is found to block the diffusion of chromium from the bulk to the surface and hinder the build-up of a sufficiently protective Cr2O3 layer. This leads to the diffusion of nitrogen into the bulk and the
formation of aluminum nitride and so no protective A1203 layer can grow.
4,0
E
Figure 2. Effect of aluminum content on the air oxidation rate of Ni-20Cr alloys [3]
2.1.2 Precipitate strengthened nickel-chromium base alloys
When added in certain proportions, aluminum and titanium precipitate high volume fractions of the FCC ordered intermetallic Nis(Al,Ti) phase named y'. This coherently precipitated phase greatly increases strength and improves high-temperature oxidation resistance [3]. In several superalloys, niobium is also present and the body-centered tetragonal NisNb precipitate named y' can develop [3]. The final protective oxide scale that forms is a
consequence of several complex and sometimes competitive reactions which are a function of alloy chemistry, environment composition, time and temperature of exposure.
Despite this complexity, it is the chromium-aluminum ratio that plays a critical role and the oxidation processes can be seen as the oxidation of a simple Ni-Cr-Al alloy. During a transient period before steady state, a thin surface film consisting of the spinel Ni(Cr,Al)204
and NiO is first formed. Oxygen diffusion into the bulk leads to the precipitation of Cr2O3 and A1203 particles. Then, depending on the composition, three mechanisms have been proposed
by Giggins and Pettit [5]. In Group I alloys, the fraction of aluminum and chromium precipitated is too low to get a dense film and so we observe internal oxidation of Al and Cr and growth of a dense NiO layer above the spinel. In both groups II and III, a high fraction of
A1203 and Cr2O3 are precipitated and a continuous layer can grow below the surface. In
Group II, the Al content is so low that Al suffers internal oxidation and the film consists of Cr2O3. In Group III, the Al content is sufficiently high to develop a dense A1203 scale near the
surface. Figure 3 gives a schematic of these three possibilities and the oxidation map of Ni-Cr-Al at 1000*C. According to their Cr and Al content and neglecting all other major elements (Co and Mo in 617; W in 230), Inconel 617 and Haynes 230 can be classified as Group II alloys in this oxidation map.
1000 *C Al 1*00 0 alloy00 20 The oxdto a at 1000*C.P lt alloy alloyPl NCr N~ 617 A1 - wtgtt-ent Chfr UOu
Figure 3. The oxidation of Ni-Cr-Al alloys after Gigging and Pettit [5]. (a) The three different mechanisms. (b) The oxidation map at 10000C.
2.1.3 Oxidation experiments on Inconel 617
Since alloy 617 is normally used for very high temperatures applications, most of the studies have been conducted in the range of 900 to 1 100'C in both air and helium environments [6,7]. As predicted by the previous model, the steady state corresponds to the formation of a homogeneous layer of Cr2O3 with internal oxidation of A1203 in the form of
elongated and deep particles growing preferentially at the grain boundaries. The two most important additional components, Mo and Co, show no effect at all on the steady state oxidation. Contrary to alloy 713LC (Al = 5.8 wt%; Cr = 11.8 wt%), the weight gain and
structure of the oxide layer in alloy 617 are found to be identical in air and low oxygen partial pressure environment (10 16 to 10-19 bars) at 900'C despite the huge difference in oxygen content [6, 7]. However, as the temperature or time of exposure is increased the surface oxide becomes unstable and non-continuous in both environments. As a consequence of the spallation and evaporation of surface oxides, Ni and Co from the matrix are exposed and oxidized in air.
All these phenomena (growth of the surface layer, internal oxidation) are enhanced
when a load is applied because of enhanced diffusion of oxygen along the grain boundaries
[7]. Figure 4 shows the volatilization of Cr03 from Cr2O3 layer which leads to a rugged
oxide/metal substrate after long-term oxidation at 1100 C [8].
Figure 4. SEM photo showing the spallation of the outer Cr203 layer at 1100*C after (a) 24h.
More complete studies in air at 900'C [8, 9] have displayed the formation of a triple oxide layer formed by NiO on the outermost surface, some NiCr2O4 pockets below and Cr2O3
inside. At 1
100
C, an outer TiO2 scale is formed but most of it is spalled due to the differencein thermal expansion coefficient with Cr2O3. This results in the exposure of Cr2O3 to an
oxidizing environment and volatilization becomes significant:
3
Cr2 03 (s) + - 02 = 2
2
Cr0 3 (9)This reaction limits the temperature at which the alloy can be efficiently used.
As Haynes 230 is the principal competitor for high-temperature applications, it is essential to consider its behavior in terms of corrosion and compare its performances with that of 617. Experiments in air at 900'C [8, 10] show that a double oxide layer is formed with the outer part being the spinel MnCr204 and the inner one Cr2O3. This tendency for manganese to
concentrate in the outer zone of the scale is explained by its diffusion coefficient being several hundred times larger than that of chromium itself in Cr2O3 at 900'C [8]. As for 617, the
oxidation kinetics in helium environments are similar to those in air. However the oxidation of alloy 230 is less severe than that of Inconel 617. In fact, the presence of the protective MnCr204 scale instead of NiO in 617 prevents oxygen from penetrating into the Cr2O3 layer
and consequently decreases the growth rate of the Cr2O3 layer. At higher temperatures (above 1000'C) spallation and volatilization also occur but with a smaller rate than in 617 [8].
2.1.4 Effects of impurities in helium coolant
In the primary circuit of high-temperature gas-cooled reactors, helium, used as the
cooling gas for the transfer of heat, contains impurities such as CO, CO2, H2, CH4 and H20 in
the microbar range. These impurities are the cause of corrosion phenomena, including oxidation, carburization and decarburization that are highly dependent on temperature and gas composition. The existence of a critical temperature Ta has been demonstrated in several studies [11, 12]. Above Ta, the oxide layer is partly reduced and carbon monoxide is produced by the following reaction: Cr2 03 + 3C (s) = 3CO + 2Cr.
This reaction leads to severe destruction of the carbide microstructure and therefore limits the applicability of the material. The critical temperature significantly depends on the carbon
monoxide partial pressure in helium but surprisingly exhibit almost the same dependence in alloys 617 and 230. This temperature ranges from about 883 to 972'C when the partial pressure of carbon monoxide changes from 0.18 to 5.8 MPa for alloy 617 [12]. This reaction called the "microclimate reaction" [13] is made possible by the reduction of chromium oxide
by hydrogen and the attack of carbides by water with formation of carbon monoxide. Pco and PH20 are found to be the two parameters that have to be accurately control to avoid this deleterious reaction.
Although this present work will be focused on the effects of low oxygen partial pressure on the behavior of alloy 617 at 650'C, it is necessary to be aware that the situation of the Intermediate Heat Exchangers is much more complex as it covers a large range of temperature (450'C to 1000'C) and is governed by diverse environmental parameters which all have a particular influence.
2.2 Crack growth in oxygen-containing environments
At high temperature, the effect of the environment can be so high that high-strength superalloys may fail due to enhanced environmental attack. This section will be limited to the influence of oxygen on crack propagation in nickel base superalloys, especially Inconel 617.
2.2.1 Crack propagation under cyclic loading
The theme of environmental sensitivity at elevated temperatures in superalloys has been taken up by Coffins et al. among many others [14]. Comparative fatigue behaviors clearly showed lives of orders of magnitude less in air than in vacuum. Significant effects of temperature and cycling frequency were found in air but not in vacuum. Crack propagation was transgranular for all the vacuum tests and intergranular or mixed, depending on the frequency, for the high temperature air tests. Figure 5 shows the effect of test temperature at a constant frequency. The fatigue life of IN706 is plotted from room temperature conditions to
800'C for both vacuum and air environments. A pronounced minimum in life is observed in
air at around 700'C, which leads to an increase by more than one order of magnitude for the lifetime in vacuum in comparison to air at this temperature.
TEMPERATM *T
WO 4W0 SWQ so WO M* MW
tepeatre ude aiLn aumcniis[5
ra
I IAIR
AtM09V
I%
Figure 5. Fatigue life of IN706 as a function of temperature under air and vacuum conditions [15]
Many studies have reported enhanced crack growth rates at elevated temperature, which have been attributed to the presence of oxygen in tests conducted in air. Molins et al. [16] have conducted fatigue tests on alloy 718 at a constant AK value under varying oxygen partial pressures and their results clearly demonstrate a critical partial pressure p* (between 10- and 10-2 mbar for 718) at which the crack growth rate changes significantly:
- P(02)< p*: crack growth rate low and independent of the oxygen partial pressure - P(02) > p* but not too high: narrow domain in which the crack propagation rate
increases with the pressure
- P(02) > p* but at higher pressures: an upper plateau is reached; the crack growth rate
is independent of the pressure
A transition pressure has also been found in alloy 718 by Andrieu et al. [17] and in Ni-Cr
alloys [18] and appears to be a function of the chemical composition of the material, especially of the chromium content. The higher the weight content of chromium in the matrix, the higher is the transition pressure. It could result from an oxide formation transition from chromium oxide at low P(02) to nickel oxide at higher P(02). The absence of environmental
embritIlement at low pressure has been related to the passivity of chromium oxide, whereas the formation of porous NiO at high pressures may account for oxygen ingress until the solubility limit of oxygen in the matrix is reached (plateau during the third stage) [17].
Service experience of components involves low cyclic loading frequencies, often with long hold times at maximum load and temperature. Whereas high-frequency crack growth is well described by fracture mechanics with the crack length being a function only of the number of stress cycles, at low frequencies, the crack length is a function of both cycle count and time. In the extreme case of low frequency, the crack length (growth rate) may be fully dependent on time and essentially independent of cycle count. These effects have been observed in many superalloys [19]. These results lead to the classification of crack growth processes in two categories: cycle- or time-dependent. High temperatures and low frequencies favor time-dependent processes (creep and/or environmental effects) and low temperatures and high frequencies favor the cycle-dependent process (fatigue). Many service conditions fall in the range of intermediate temperatures and frequencies where a combination of cycle and time-dependent phenomena take place. In this regime, the crack growth is the result of the complex interactions between fatigue, creep and environmental damage [20]. Concerning alloy 617 few studies have been conducted and the main results from Benz [21] and Hsu [22] are displayed on Figure 6. Both of them find an increase in crack growth rate when the frequency is decreased. In air, for R ratios (Load Ratio, Pmin/Pmax) of 0.6 and 0.05, the time-dependence appears at frequency lower than 0.5 Hz [22] whereas in low oxygen pressure environments, processes are always found to be time-dependent [21]. At low frequency (0.1 Hz) the effect of the environment is clearly visible with a sharp increase in crack growth rate when the oxygen partial pressure is changed from 50 ppm to 1000 ppm. However, at higher frequency (2Hz), the difference in crack growth rate is slight, suggesting that environmental factors may be overtaken by mechanical and/or microstructural effects. Lower frequencies probably allow more time for oxygen transport to the crack tip or for the kinetics of the NiO/Cr2O3system to assert itself.
Fiue64 rc rwhrt s tesitiyrn. (a)dat frmBnS2]a =.,fo s 2]a =.5 (b-aafo
Une tti odng(rqenyeul ozr adRrti qaxt )wer re
ego X~ 1 be o +- dpnigoth x + X t~~r C -, x al l, b 4a 10Di +. X AI*-20 25 30 39- 40 4! - 10 20 2 .30
Figure 6. Crack growth rate vs. stress intensity range. (a) data from Benz [21] at R=o.1, from Hsu [221 at R=.05. (b) data from Benz at R=0.5, from Hsu at R=0.6.
2.2.2 Sustained load crack propagation
Under static loading (frequency equal to zero and R ratio equal to 1) where creep deformation is present, the crack growth rate will be the result of two competitive processes: environmental damage and creep. Various behaviors have been observed depending of the alloy being considered. For example, the crack growth rate for lIN7 18 is around 100 times slower in helium than in air but is reduced at 760'C relative to
650'C
due to an increased plasticity and a reduction in yield stress [23]. Most recent studies on 1N7 18 have reported a precipitous reduction in crack growth rate when the oxygen pressure decreases below 10- Pa[24].
However, this environmental susceptibility is not seen in all nickel base alloys and the influence of the environment varies with the material. This is underlined by Sadananda and Shahinian [25] which define two classes of materials. In one hand are those who exhibit a brittle mode of fracture with a main crack which grows continuously at a rate highly sensitive to the air environment. This is the case for alloy 718 and Inconel X-750 at 650'C. On the other hand, some alloys exhibit a ductile mode of crack growth consisting of nucleation of microcracks ahead of the main crack and joining of the main crack with the most favorably oriented microcracks. This behavior is the one of alloy Udimet 700: the environmental effect is small at all temperatures and creep-related processes dominate. Later, Sadananda and Shahinian have extended their previous study to a large number of alloys (600, 625, X-750, Hastelloy X, PE-16, 800, HS-25) over the temperature range 540 to 870'C in air [26]. Inconel
600 and Hastelloy X did not show any observable crack growth but instead exhibited *
* * *
continuous deformation leading to crack tip blunting and stress relaxation. All the other alloys were characterized by a critical range of temperature where cracks propagate at a rate which is
highly dependent on the alloy and its sensibility to oxygen in air. No correlation of crack
growth rates with yield stress of the alloys has been found. Moreover very strong effects of microstructure on sustained load cracking have been reported for both IN718 and IN706 [19]. Special heat treatments including controlled cooling have been able to provide a reduction in crack growth rate by two orders of magnitude by controlling the alloy's chemistry and microstructure.
Concerning alloy 617, very few data exist on the influence of the environment on static loading crack growth and more studies are necessary to determine which process among creep or environmental damage dominates at different temperatures and oxygen partial pressures. Benz observed a particularly surprising trend [21]: by testing at constant K in varying oxygen partial pressure environments, the crack growth rate was found to increase when P(0 2) is decreased in the range of pressures 10-3 to 2. 10-7 atm. These results clearly differ from those found in fatigue experiments at low R [21]. The crack propagation mode shifts from transgranular to intergranular when the loading mode is changed from cyclic to static with branching and grain boundary cracking away from the crack tip.
2.2.3 Potential mechanisms for oxygen enhanced crack growth
When exploring the literature for the processes responsible for the enhanced crack growth described in the two previous parts, it is clear that many different mechanisms have been proposed but no common agreement has been reached. The first studies on pure nickel recognized that oxygen did not cause embrittlement in the elemental form and that an oxidation reaction was necessary [19]. In their study on cast Udimet 500 subjected to high-temperature, low-cycle fatigue [27], McMahon and Coffin proposed a mechanism starting with intergranular oxidation assumed to occur on boundaries where high stress concentrations existed. In this mechanism, called Oxide Embrittlement or Stress Accelerated Grain Boundary Oxidation (SAGBO), the determining step is the extensive formation of the brittle oxide film along the grain boundary. The authors observed the formation of ridges at selected grain boundaries that were found to be wedge-shaped oxide intrusions, along which a crack could easily propagate. Therefore they proposed that oxide penetration along grain boundaries precedes actual crack formation. Moreover small cracks are sometimes found ahead of the main crack and may act as oxygen sinks and reservoirs for subsequent internal oxidation.
Because they are regions of high defect concentration, grain boundaries provide a rapid diffusion path. They are also regions rich in the strongly oxidizable elements such as aluminum, chromium and carbides. Furthermore a grain boundary can act as a site of stress concentration for externally applied loading. All these reasons lead to a preferential crack growth in the intergranular mode.
The previous mechanism is in contrast to that proposed by Bricknell and Woodford in their embrittlement experiment on superalloy 903 [28]. From their findings, they suggested that the boundary is first embrittled by intergranular oxygen diffusion which then causes the boundary to fail in tension. The boundaries that have been directly exposed to the oxidizing environment oxidize only after fracture. The process repeats itself as oxygen is able to diffuse further down the grain boundary and the next segment of the embrittled grain boundary fractures ahead of the crack tip. This mechanism is validated, they claim, by SEM observations of intergranular fracture still occurring in specimens for whom the external oxidation layer has been removed. Although oxygen in the environment is unequivocally recognized as the damaging species, the question still remains whether the enhanced crack growth rates are due to intergranular oxidation or direct oxygen embrittlement. Figure 7 is a schematic showing the differences between these two mechanisms:
(a)
(b)
(c)
STRESS ACCELERADED GAIN BOUNDARY OXDATMN
0
OXYGEN EMBRITTLEMENT
In a recent review paper by Woodford [19], the author concisely summarizes the four processes which appear to promote intergranular oxygen embrittlement:
- Gas bubble formation (CO and C02): An example is shown in Figure 8 where the
use of mass spectroscopy has allowed attributing the voids at the grain boundaries to gas bubbles and most likely carbon dioxide, possibly with some carbon monoxide.
- Release of sulphur: Oxidation of grain boundary sulphides releases sulphur, which,
contrary to oxygen, does embrittle in the elemental form.
- Precipitation of oxides: In the absence of carbon or sulphides in nickel, internal
oxidation of trace impurities can also occur.
- Solute segregation: In this case, the diffusion of oxygen might affect the cohesive
strength of grain boundaries.
A
Figure 8. External oxide and internal voids formed in Ni270 after air
exposure at 1000*C for 200h [19]
Various investigations have been conducted ahead of crack tips formed in nickel-base superalloys using high resolution SEM, TEM and Auger spectroscopy. Andrieu and Molins et al. [29] proposed that oxidation in IN718 occurs in two stages starting with spinel oxide formation and subsequently chromium oxide formation at the oxide-metal interface. In their TEM studies, the inner layer at the metal-oxide interface was identified as Cr2O3 while the outer layer was identified as a spinel oxide Ni(FeCr)204. Delay in forming the passive chromium oxide could allow deeper oxygen ingress and increase in crack growth rates. A recent study conducted in an oxygen pressure of I atm at 973'C on nickel base superalloys
and using XPS elemental analysis [30] has been able to detect preferential oxidation of Al, Ti and Nb in NisAl, Ni3Ti and Ni3Nb precipitates and Nb-rich carbides over distances of 100 Pm
ahead of the crack tip. However, in Benz's investigation [21] by mean of Auger nanoprobe (lateral resolution of 10 nm up to 0.1% in composition), no indication of oxide formation or long-range intergranular oxygen transport ahead of cracks grown in a 10-3 atm oxygen environment has been found. The diffusion of oxygen, if happening, may extend only on the order of nanometer scale ahead of the crack tip which would not have been detected. The discontinuous change in cracking rate observed by Pfaendtner and McMahon [24] when the oxygen pressure was reduced to extremely low values (10~6 atm) has been explained by a shift from diffusion-controlled decohesion to delivery-controlled decohesion. They contend that when the rate of oxygen delivery from the surface is very slow, the embrittling element is carried away from the tip towards the point of maximum stress, before it can cause decohesion at the tip. This phenomenon occurring at very low pressures leads to the blunting of the tip and a discontinuous cracking starting at some distance from the tip.
Furthermore it has been pointed out that oxygen could cause a chemical reaction (possibly with carbon) which would affect the process of grain boundary migration. Observations conducted by Bricknell and Woodford [31] indicate that dynamic recrystallization does not occur in specimens exposed to air at 800'C prior to testing, while the vacuum exposed specimens do show signs of recrystallization. At low temperature, deformation is mainly carried by slip, whereas at intermediate temperature, grain boundary sliding is the main source of accommodation. If embrittled boundaries are not able to migrate anymore, cracks will initiate at regions of high stress concentrations, accordingly leading to a reduction in ductility. At high temperatures, the grain boundaries have enough thermal energy to overcome the source of pinning and ductility is restored. The source and mechanism of pinning is not yet clearly defined.
2.3 Creep behavior of Inconel 617
When the temperature of metals increases above 0.35 Tm, where Tm is the melting point, time-dependent deformation under stress becomes a consideration. This phenomenon commonly called creep cannot be neglected for the use of alloy 617 in high temperature applications since 0.35 Tm lies in the range 466-483'C.
2.3.1 Results of creep testing
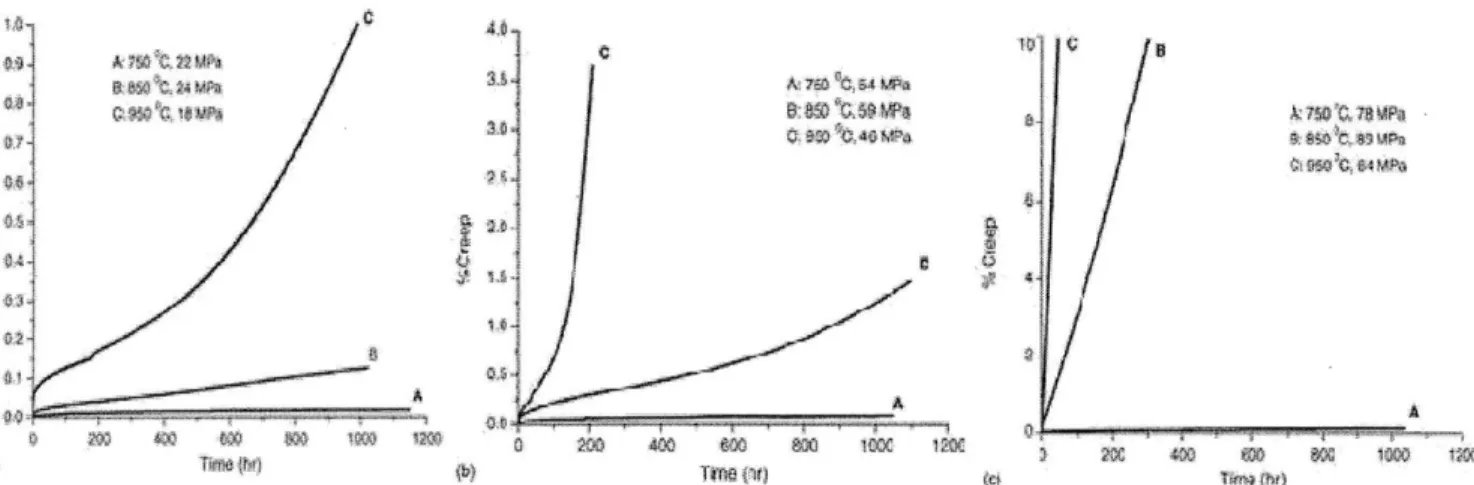
Multiple studies have aimed at determining the creep response of alloy 617 with the main varying parameters being the temperature, the level of applied stress and prior heat treatment/processing. Figure 9 shows typical creep curves for alloy 617 under a set of various conditions in air [32]. Theses curves show a near typical shape with a primary, secondary and tertiary stage but the length of each regime is affected by the conditions of temperature and load. These three distinct domains have been clearly observed at 850'C under stresses between 30 and 80 MPa [33, 34]. If temperature or stress is too high, the tertiary stage is reached almost immediately [35]. Following the typical assumption that a structural material must not undergo creep deformation exceeding 1% strain after 1000 hours of loading at different stress levels, alloy 617 could be safely used at 750'C due to its prolonged and stable steady state rates beyond 1000 hours of testing. However it may not be suitable for application under sustained loading for 1000 hours both at 0.25YS and 0.35YS stress levels at
850'C and higher.
Figure 9. Creep curves of alloy 617 vs. temperature and applied stress. (a) Applied stress =0.10YS. (b) Applied stress =0.25YS. (c) Applied stress = 0.35YS
The influence of the environment on creep behavior has also been investigated and the effects of methane and oxygen as impurities have been underlined [36]. The presence of CH4 at trace level induces cleavage fracture and the creep rupture strain is reduced in comparison to pure He or (He+02) environments where the failure mode is ductile. However, oxygen-containing environments have a highly detrimental impact as they lead to the shortest rupture life. Similar results are obtained by Hosoi and Abe [37] who found the minimum rupture life
to take place in atmospheres with medium 02 concentration (500 ppm 02 in helium) whereas identical values where displayed in pure helium, high vacuum and air. This behavior has been attributed to the presence of a decarburized zone below the surface of the specimen, which tends to reduce the high temperature strength.
The steady state creep rate of alloy 617 is modeled as a thermally activated process by fitting the experimental data with the simple Norton's law:
sS
= Ar
aexp(
)RT
where a is he applied stress, n the stress exponent,
Q
the apparent activation energy for creep mechanism, A a constant, R the universal gas constant and T the absolute temperature. Some values for n andQ
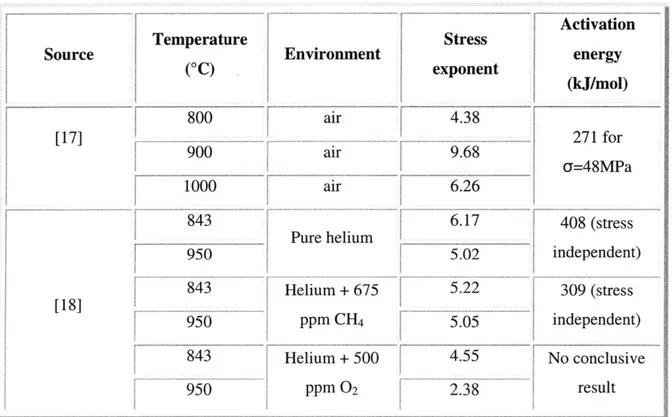
found in the literature are summarized in Table 1. A stress exponent around 5 suggests a dislocation climb-controlled creep behavior [38] whereas n=3 indicates a viscous glide mechanism [39].TemperatureActivation
Source Environment Stress energy
(*C) exponent
CO
(kJ/mol)
800
ir
4.38
[17]
271 for
900 air 96 c=48MPa 1000 air 6.26 843 6.171
408 (stress Pure helium 5.02 independent) Helium + 675 5.22 309 (stress [18]5ppCH
--PPMCH4 5.05 independent) 843 Helium +500 4.55 No conclusive 950 -ppm 02 2.38 resultTable 1. Values of the creep parameters n and Q obtained with various experimental conditions.
As the Norton equation cannot accommodate strain-hardening or strain-softening, more complex models have been developed [40, 41] in order to simultaneously represent the
three stages of creep. In the early 1980s, efforts were concentrated on developing and implementing unified equations for alloy 617 in order to prepare a draft code case covering the temperature range 649 to 982'C. These models contain a structure-dependent variable to take into account the complexities introduced by the TTP (Time-Temperature-Precipitation) characteristics of the carbides and y' phase. The use of modified Norton's law leads to the determination of stress exponent n and activation energy
Q
that are dependent of the level of applied stress. This variation is attributed to a change in creep-governing mechanism with stress [42]. That is why the microstrucural morphology and changes during creep are of high importance.2.3.2 Microstructure changes during creep
The first data on aging effects for alloy 617 were produced in 1974 by Mankins, Hosier and Bassford [43] who covered the temperatures range of 649 to 1093'C. M23C6
carbides were found to be abundant at all temperatures; carbonitrides [CrMo(C,N)] and nitrides (TiN) were present but rare; the intermetallic phase y' was rare but present at temperatures up to 760'C. In addition to M23C6, fine M6C have also been observed after only
one hour of aging at 10000C [44]. Figure 10 provides a TTT
(Time-Temperature-Transformation) diagram for alloy 617 [45] which shows that Ti(C,N), M6C and M23C6 form
when the solid solution material is heated to temperatures in the range of 600 to 10000C and
that small amounts of y' precipitate at temperatures in the range of 550 to 1000 C. The nose of the TTT curve for y' precipitation is located around 750'C and one hour. It was also observed that the M6C carbides were dissolved or replaced by more M23C6 carbides at longer
times and the nose for this disappearance is placed at 550'C and 1000 hours in the TTT diagram. For aging conditions above 1000'C the diagram displays the formation of M12C
120)
T10E0
Tlf(C~.MC.M C-
C
TRC( f4w.MU C *)I-
T
CX~TJC,
4 M CY LTI(CJHQ*,C.M C
TRtC.to.U C
400
10"
le
0to
101
1e
is
l
TIME,
(h)
Figure 10. TT diagram for alloy 617 [45]The evolution of hardness with aging time and temperature has been extensively used in the examination of the aging response of VHTR alloys. Figure 11 is a plot of recent hardness measurements from Marcello Cabibbo et al. [46] accompanied by values reported in the literature at roughly corresponding test temperatures. The hardening response at temperatures below 650'C is rather slow whereas a significant hardening occurs in the range of 650 to 800'C. This response is the result of extensive intergranular y'-Ni3(Al,Ti)
precipitation between 700 and 800'C. A competitive strengthening phase Ni3Mo, called 6, is also detected at 700'C but disappears at 800'C. Aging at 850'C also leads to a peak in the hardness curve which, in this case, is located at around 10 hours when the M23C6 precipitates
on slip lines are the most numerous [33]. The hardness is found to fall to levels that are typical of unaged material when aging temperatures exceed 900'C and the y' phase is no longer observed [47].
9,11IR
II TVC"
V
40 - ---- - 593YC, literatue - -- 6480C. literture 35 -- & aitemture 815C,i cratu rc
- The values incteture are(J . f the
w ks ec~rc~~p. alc [I43 At
-- A
7- 15-- 7R
higherisFchareed by. potedaa fomation of anee instataonefous tiferetirreonnthcep work
~
~
l 4]~
ofMnise~
4rhighe iscFigutred by. Hpoteda funcation of cree durtationefors diferetirreonnthcep
curves and is related to the dissolution of carbides and intermetallic phases. The formation of voids in the tertiary stage accompanied by grain boundary migration and recrystallization has been observed by several researchers [32, 33, 34] and leads to the degradation of the strength of the alloy. The rupture zone appears as completely reformed with recrystallized zones located at grain boundaries (where the carbides mostly were before their dissolution) and formed of multiple fine grains containing twins [33]. During high-temperature creep tests
(900'C to 1000'C at creep stresses ranging from 20 to 40 MPa) [48] voids were detected
mostly on grain boundaries oriented parallel or perpendicular to the tensile axis as well as 45' to the tensile axis.
In the absence of load, long term exposure of alloy 617 to high temperature usually results in coarsening of the carbides but their distribution remains unchanged [49]. In contrast, under tensile load at 1000'C, the carbides redistribute and are found to be gathered on boundaries perpendicular to the stress axis, as illustrated by Figure 12 from [49].
Figure 12. Redistribution of carbides and formation of voids during a creep test at 1000'C. The array indicates the direction of the applied stress
Intragranular carbides are believed to re-dissolve and re-precipitate as grain boundary carbides. Then they are found to be preferentially located on grain boundaries normal to the stress axis to those parallel to it. The driving force for this redistribution is proposed to be the difference in stability of the carbides in compression versus tension [49]. Moreover the majority of the grain boundary precipitates are shown to be Cr-rich (M23C6) carbides. This can
be related to the higher diffusivity of chromium versus molybdenum in Ni base alloys. Mo-rich carbides (M6C) tend to be more resistant to dissolution. The tertiary stage of creep is
initiated when grain boundaries free of carbides begin to migrate. The different steps for microstructural change during creep at 1000'C are summarized in Figure 13.
-'V
P of carbides 4
LMigratio
of grain-toundary cofdes MGC )[Gn- oundary rrdfraifn (GeM )
C reep voids (V)
[Recrysfdiztor I RCRY)
Figure 13. A schematic representation of microstructure changes observed in solution treated Inconel 617 during creep at 1000"C [31]
The present work is an investigation of the behavior of alloy Inconel 617 under static loading at 650'C in low oxygen pressure environments. The goal is to determine which ones among the phenomena described earlier (oxide formation, creep deformation, oxygen embrittlement, aging effects) are relevant in these particular conditions. The temperature of interest in this study (650'C) is the one at which hardening effects are known to become significant. Our alloy is placed in an intermediate domain where neither creep nor environmental damage may dominate but their interaction may give rise to synergistic effects which can either accelerate or delay crack growth. The real mechanism acting in this situation cannot be easily determined and it will be of practical interest to determine which parameters have to be used to correctly characterize alloy 617 in this range of conditions (temperature, pressure and load).
![Figure 2. Effect of aluminum content on the air oxidation rate of Ni-20Cr alloys [3]](https://thumb-eu.123doks.com/thumbv2/123doknet/14149678.471663/16.918.135.466.381.770/figure-effect-aluminum-content-air-oxidation-rate-alloys.webp)
![Figure 3. The oxidation of Ni-Cr-Al alloys after Gigging and Pettit [5]. (a) The three different mechanisms](https://thumb-eu.123doks.com/thumbv2/123doknet/14149678.471663/17.918.108.740.644.1023/figure-oxidation-ni-alloys-gigging-pettit-different-mechanisms.webp)
![Figure 6. Crack growth rate vs. stress intensity range. (a) data from Benz [21] at R=o.1, from Hsu [221 at R=.05](https://thumb-eu.123doks.com/thumbv2/123doknet/14149678.471663/23.918.52.830.19.283/figure-crack-growth-rate-stress-intensity-range-benz.webp)
![Figure 8. External oxide and internal voids formed in Ni270 after air exposure at 1000*C for 200h [19]](https://thumb-eu.123doks.com/thumbv2/123doknet/14149678.471663/26.918.201.625.446.755/figure-external-oxide-internal-voids-formed-after-exposure.webp)