READ THESE TERMS AND CONDITIONS CAREFULLY BEFORE USING THIS WEBSITE. https://nrc-publications.canada.ca/eng/copyright
Vous avez des questions? Nous pouvons vous aider. Pour communiquer directement avec un auteur, consultez la première page de la revue dans laquelle son article a été publié afin de trouver ses coordonnées. Si vous n’arrivez pas à les repérer, communiquez avec nous à [email protected].
Questions? Contact the NRC Publications Archive team at
[email protected]. If you wish to email the authors directly, please see the first page of the publication for their contact information.
NRC Publications Archive
Archives des publications du CNRC
This publication could be one of several versions: author’s original, accepted manuscript or the publisher’s version. / La version de cette publication peut être l’une des suivantes : la version prépublication de l’auteur, la version acceptée du manuscrit ou la version de l’éditeur.
Access and use of this website and the material on it are subject to the Terms and Conditions set forth at
A Method for evaluating the effect of blowing agent condensation on
sprayed polyurethane foams
Kumaran, M. K.; Bomberg, M. T.; Marchand, R. G.; Creazzo, J. A.; Ascough,
M. R.
https://publications-cnrc.canada.ca/fra/droits
L’accès à ce site Web et l’utilisation de son contenu sont assujettis aux conditions présentées dans le site
LISEZ CES CONDITIONS ATTENTIVEMENT AVANT D’UTILISER CE SITE WEB.
NRC Publications Record / Notice d'Archives des publications de CNRC:
https://nrc-publications.canada.ca/eng/view/object/?id=4dd2c524-cca1-4e5d-8664-207d19106d4d
https://publications-cnrc.canada.ca/fra/voir/objet/?id=4dd2c524-cca1-4e5d-8664-207d19106d4d
S e r
T H 1
~ 2 1 a
National Research
Conseil national
n o .
1 6 3 7 1 ( C I
c
ouncil Canada
de
recherche8
Canada
c.
2
BLDG
Institute for
lnstitut de
-
Research in
recherche en
Construction
construction
A
Method for Evaluating the Effect of
Blowing Agent Condenktion on
Sprayed Polyurethane Foams
by M.K. Kumaran, M.T. Bomberg, R.G. Marchand et al
Reprinted from
CFCs & The Polyurethane Industry: Vol. 2
(A Compilation of Technical Publications, 1988-1 989)
p. 84-90
(IRC Paper No. 1637)
Ce
document W t
une technique exp6rimentale pertnewt de &texminer l'influence de
la
temp6rature sur la conduCtivit6 thermique &s isolants en mousse fomds par soufflage au
moyen de
gaz
mdensables.
Cette
technique
sert
B
dtudier l'effet
&
l'agent
porogbne
sur la
conductivit.6 thermique d'un syst&me polydthane
f
d
par
s o d a g e
I'aide
de
CFC-
11
ou de HCFC-123,
B
divers stades de son yieillissement.
On
pdsente aussi une mdthode
permettant de calculer, B partit des donndes concernant la conductivitd thermique, la
pression partielle de l'agent pmogbne
dans
le dlange
gazeux
des dchantillons.
A Method for Evaluating the Effect of Blowing Agent
Condensation on Sprayed Polyurethane Foams
M.
K. KUMARAN
M. T.
BOMBERG and
R. G.
MARCH AN^
National Research Council Canada Building Performance Section Institute for Research in Construction Ottawa, Ontario, CANADA KIA OR6
M. R.
ASCOUGH
D u a n t Canada Inc PO. Box 2200 Streetsville
Mississauga, Ontario, CANADA L5M 2H3
ABSTRACT
An experimental procedure for the determination of temperature dependence of thermal conductivity of foam insulations blown with condensable gases is presented. The procedure is used to investigate the effect of the blow- ing agent on thermal conductivity of a polyurethane sys- tem blown with CFC-11 or HCFC-123, a t various stages of its aging. A method to calculate the partial pressure of the blowing agent in the cell gas mixture of the test speci- mens, from the data on thermal conductivity, is also pre- sented.
INTRODUCTION
T
wo alternative blowing agents, HCFC-123 and HCFC- 1414 have been identified as potential replacements for CFC-11 for manufacturing rigid polyurethane and polyisocyanurate foams. Over the past two years consider- able effort has been made to determine physical properties of these new blowing agents and the foams prepared with them [1,21, to enhance a smooth transition from CFC-11 to the alternatives in foam applications. Before the new prod- ucts are manufactured commercially, more information on the properties of these foams is needed. In an effort to gen- erate such information DuPont Canada Inc. has initiated a series of research projects a t the Institute for Research in Construction, NRCC.The topic selected for initial investigation is the effect of condensable gases on long-term performance of gas-filled cellular plastic (GFCP) insulation. When a GFCP is sub- jected to a broad range of temperatures, the blowing agent
may undergo repeated condensation and evaporation. If this is the case, what is the effect of blowing agent conden- sation on the thermal performance of the foam? Would
J. A. CREAZZO
E. I. du POnt de Nemours & Co. Freonm Products Lab.
Chestnut Run, Bldg. 711 Wilmington. Delaware 19898
repeated condensation and evaporation of blowing agent affect the polymer structure and diffusion characteristics of the foam? To answer these and similar questions one needs to develop appropriate test methods These methods should be general enough to permit evaluation of different polymeric materials (polyurethanes, polystyrenes and phenolics) under a broad range of service conditions.
HACKGROUNI)
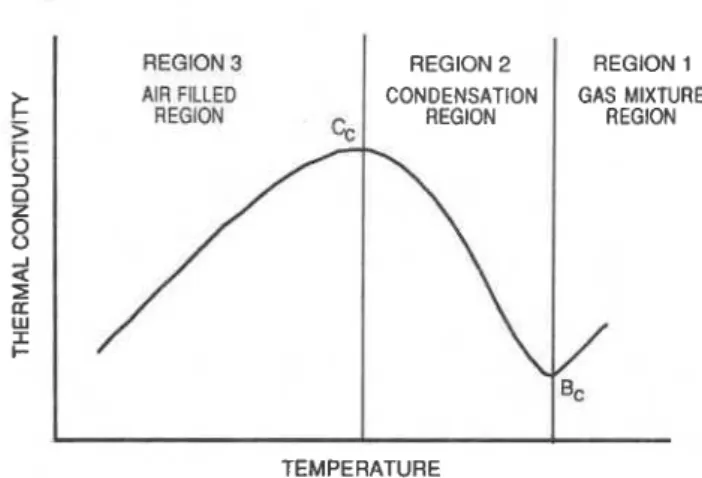
Thermal conductivity of a foam insulation that contains a condensable blowing agent, whose normal boiling tem- perature (T,,) is close to room temperature, varies with temperature, as illustrated in Figure 1. The curve in this Figure can be separated into three regions. In region 1, marked as gas mixture region, thermal conductivity of the foam decreases with temperature. This behavior can be ex- plained using the theory of heat conduction through a mixture of polyatomic gases [31. The second region, marked as condensation region, is bounded by a minimum and a maximum on the curve. In this region the blowing agent present in the cell gas mixture of the foam under- goes a phase change. At the point B, it begins to condense. As the temperature is further decreased, the total amount of blowing agent that is condensed progressively increases and its mole fraction in the cell gas mixture decreases. Since the blowing agent has usually much lower thermal conductivity than any other component such as oxygen or nitrogen, successive reduction in its mole fraction results in a gradual increase in the total thermal conductivity of the cell gas mixture. Hence, the thermal conductivity of the foam increases with decrease in temperature in this re- gion. This increase continues until all of the blowing agent is condensed out of the gas mixture This happens a t the point C, which represents completion of condensation of
REPRINTED FROM
CFCS
& THE POLYURETHANE INDUSTRY: VOLUME 2REGION 3
I
REGION 2I
REGION 11 I
TEMPERATURE
Figure 1. Temperature dependence of thermal conduct~v~ty ol a cel- lular plastlc ~nsulatron manufactured w ~ t h a condensable blowlng agent.
the blowing agent. In the third region, marked as air-filled region in Figure 1, the thermal conductivity of the foam again decreases with temperature. This decrease, as in the gas mixture region, can once again be explained using the theory of heat conduction through a mixture of polyatomic gases-in this case, still air.
The dependence of thermal conductivity of the foam on temperature in the condensation region is governed by the temperature-saturation vapor pressure relation of the blowing agent. The general relation between temperature and saturated vapor pressure of blowing agents is shown in Figure 2. If the partial pressure of the blowing agent in the cell gas mixture is equal to 1 atmosphere, the conden- sation will start a t
T,.
If the partial pressure is below 1 at- mosphere, say P, in Figure 2, the condensation will start a t a lower temperature, T,. Thus information on the pointB, in Figure 1 and temperature dependence of saturation partial pressure of the blowing agent (Figure 2) may lead to the determination of partial pressure of the blowing agent. For blowing agents such as HCFC-123, HCFC-141b or CFC-11, the temperature dependence of saturated vapor pressure may be approximated by Clausius-Clapeyron equation: 1 ATMOSPHERE
...
/I
I I I 1 I I 1 t 1 TEMPERATUREFigure 2. Relation between saturated vapour pressure and tempera- ture of blowing agent; Tb IS the normal bolhng temperature and P, e
the saturated vapour pressure at temperature T,.
where p is the vapor pressure a t temperature T , T , is the boiling temperature of the blowing agent a t standard at- mospheric pressure p,, H i s its molar enthalpy of vaporiza- tion and R is the universal gas constant. Equation (I), along with the information on the point B, in Figure 1, can thus be used to calculate the partial pressure of the blow- ing agent in the cell gas mixture of the foam, knowing the normal boiling temperature and enthalpy of vaporization of the blowing agent.
The objective of the present research project was to de- velop an experimental procedure that can provide informa- tion on the effect of condensation of blowing agents on the thermal conductivity of foam insulations at various stages of their aging. To meet this objective, it was necessary to: 1. Construct and calibrate a heat flow meter (HFM) ap- paratus that can be used for measurements in the tem- perature range, 255 to 325 K
2. Develop a technique to "freeze" the aging process of a given specimen, a t any desired stage, by preventing in- ward diffusion of components of air and outward diffu- sion of blowing a w n t
- -
3. Develop a test method for determining thermal conduc- tivity of the specimen as a function of temperature, effi- ciently in terms of time for measurements
This paper presents an experimental procedure that ad- dresses all the three aspects listed above. It also reports ex- perimental data on a sprayed polyurethane foam with two different blowing agents. A foam system equivalent to a commercial spray polyurethane, referred to a s "base 88," was selected for this investigation. Two blowing agents were used: CFC-11 and HCFC-123. By selecting the "base 88" system with CFC-11 and HCFC-123, this project pro- vided additional support to a research program initiated jointly by the Institute for Research in Construction, Na- tional Research Council of Canada and the Society of Plas- tics Industry of Canada.
EXPERIMENTAL PROCEDURE Heat Flow Meter Apparatus
A 300 mm x 300 mm HFM apparatus was built with heat flux transducers 141 on both hot and cold plates. The 300 mm x 300 mm transducer, with 150 mm x 150 mm metering area at the center, was sandwiched between two layers of cork (thickness = 1.5 mm) before it was mounted on the plate. Then a copper sheet of thickness 0.1 mm was glued to the cork to cover the metering area. The remain- ing part of the cork was covered with Mylar film of the same thickness a s the copper sheet. The copper sheet was divided into four squares, each separated by a 0.6 mm gap, and a thermocouple was soldered to the center of each square. The exposed surface of the plate assembly was then painted with black Nextel brand velvet coating, Series 101, to provide a n infrared emittance, e of 0.89. The interface of the plate and the cork layer was also provided with four thermocouples. These thermocouples and the ones on the copper sheet can be used to monitor the tem- peratures equidistant from either surface of the trans- ducer itself and hence to determine the mean temperature of the transducer.
Calibration of the Apparatus
As discussed elsewhere [51, the use of transfer standards developed in a Guarded Hot Plate apparatus of proven ac- curacy [61 appears to be the most reliable method for cali- brating a HFM apparatus.
Two, 300 mm square, expanded polystyrene specimens with thicknesses 25.50 and 25.53 mm and average densi- ties 19.23 and 19.30 kg/m3 were selected for calibration. Their similarity was further checked in the HFM appara- tus at fixed hot and cold plate temperatures. The ratios be- tween the electrical output from each heat flow transducer and the temperature difference across the specimens were within 0.04%. This confirmed that their thermal transmis- sion characteristics are identical to the extent required by a pair of transfer standards.
The above pair of specimens was subsequently placed in a 300 mm x 300 mm Guarded Hot Plate apparatus to de- termine their thermal resistance as a function of mean temperature in the range 240 to 315 K . The results from these tests are plotted in Figure 3. The temperature de- pendence of the thermal resistance, as shown in Figure 3 , is nearly linear for the specimens in the tested range of temperature. This dependence is given by the equation,
where R is the thermal resistance (m2
.
K / W ) and T , is the mean temperature ( K ) . Thus, in the range of its valid- ity, Equation ( 2 ) can be used to calculate the heat flux across the specimen for any steady state heat transfer con- dition.One of these transfer standard specimens was then used to calibrate the new HFM apparatus under steady state conditions. Using ASTM test method C518 and choosing appropriate hot and cold plate temperatures to cover the range of mean specimen temperature of 250 to 325 K , the electrical output from each transducer and thermocouple was measured. The readings from the thermocouples were used to calculate the surface temperature of each plate assembly and the mean temperature of each transducer. Then Equation ( 2 ) was used to calculate steady state heat flux across the transfer standard. The electrical output from the transducers and their mean temperatures being
MEASURED
,'
0.85-
-
EQUATION (2)-
E uj 0.80-
a
k
2
0.75-
OC -I ag
0.70-
W I I- 0.65 240 250 260 270 280 290 300 310 TEMPERATURE, KFigure 3. Temperature dependence of the thermal resistance of the transfer standard used for calibrat~on of HFM apparatus.
35
MEASURED
TEMPERATURE, K
Figure 4a. Calibration factor of the transducer on the hot plate.
known, the ratio between the steady state heat flux and measured electrical output was calculated a t the mean temperature of the transducer. This quantity, expressed as a function of temperature, serves as the calibration factor for the transducer in subsequent application of the equip- ment for determining thermal conductivities of other test specimens.
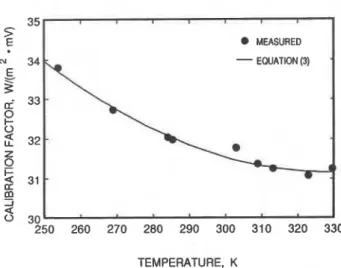
The results from the calibration measurements are plotted in Figures 4a and 4b for the transducers on the hot and cold plates respectively. The calibration factor for each transducer varies non-linearly with temperature in the range of interest to this investigation. Least-squares anal- yses of the calibration data yielded the following empirical equations for the calibration fador of each transducer:
For the hot plate transducer:
and for the cold plate transducer,
MEASURED
-
EQUATION (4)-
Z
0
TEMPERATURE. K
where S is t h e calibration factor
( W .
m-' . mV-') a t mean temperature T , ( K ) .Encapsulation of a Test Specimen
I t was decided that the best way to "freeze" the diffusion processes was to encapsulate the specimen with a n appro- priate coating. Several commercially available coatings and membranes were investigated. For polyurethanes the most promising results were obtained with a coating of an epoxy resin (Canus 1000 Epoxy with No. 68 curing agent). The efficiency of this coating was established by compar- ing t h e change in thermal resistance of encapsulated and open-surface, 300 mm
x
300 mm x 29 mm, specimens cut from freshly sprayed polyurethane foam. A pair of such specimens was cut and their thermal resistances were measured and found identical. One of the specimens was then coated with the epoxy resin, approximately 0.2 mm thick, on all sides including the edges and was allowed to cure. After two weeks of laboratory exposure both speci- mens were retested. During that period the uncoated spec- imen showed 7% reduction in its thermal resistance while the encapsulated specimen showed only 0.6%. reduction. After a further ten week period the thermal resistance of t h e encapsulated specimen was reduced only by 1.2%. This is not a significant change, particularly when a part of this change may be caused by the process of partial pressure equalization due to redistribution of each cell gas com- ponent.Coating with a thin layer (approximately 0.2 mm) of highly conductive material on the specimen surface may increase the lateral component of heat flow and thereby af- fect the calibration factor S. Even though the calibration of t h e HFM included some contribution of the lateral flow, a separate test was performed to examine the effect of the epoxy coating on t h e accuracy of the HFM measurements. Thermal resistance of an extruded polystyrene specimen of thickness 10.4 mm and density 35.6 kg/m3 was mea- sured. The specimen, prepared from a sample aged in the laboratory for more t h a n five years, was encapsulated with the same technique used for the polyurethane test series and its thermal resistance was remeasured. This specimen showed a thermal resistance of 0.3375 m2.K/W before and 0.3292 m2.K/W after encapsulation. The resistance of the encapsulating layer itself is negligible. Even if the difference of 2.5% is entirely ascribed to t h e error caused by increased component of the lateral heat flow, for the HFM apparatus described here, this difference is small enough to consider t h a t the measured value of thermal conductivity of the encapsulated specimen is representa- tive of the true value of thermal conductivity.
Test Parameters
Selection of the specimen thickness and the temperature gradient used in this work was based on a compromise be- tween different requirements. The smaller t h e tempera- ture gradient, the more precise is the determination of the temperature dependence of the thermal conductivity. However, to ensure sufficiently high precision of heat flux measurement one needs a large thermal gradient. Ex- perience with testing 5 to 10 mm thick layers indicated t h a t for the required precision one may use a 10 K temper- ature difference over 1 0 rnm thick specimens. As discussed
in a n earlier publication [7], a period of 1 h was arrived a t a s the time sufficient to establish steady state and to per- form the measurements.
The Test Procedure '
The encapsulated test specimen was placed in the HFM apparatus and the hot plate was initially set a t approx- imately 330 K and the cold plate a t 320 K. Once the steady state was attained, the electrical outputs from the transducers and all thermocouples were recorded. These values were used to calculate the heat flux a t either sur- face of the specimen, using Equations (3) and (4).
One hour from the start, the temperature of each plate was reduced by 1 K, the new steady state was established and the electrical outputs again recorded. This stepwise decrease in temperature was continued until the hot sur- face temperature reached approximately 260 K and the cold surface temperature 250 K. Then the measurement process was reversed and the HFM plate temperatures were increased in steps of 1 K. The successive changes in HFM plate temperatures and the data acquisition were managed by a computer. The entire test comprising two measurement series (temperature decrease and increase) takes four to five days.
APPLICATION O F THE TEST METHOD Sample Preparation
From the core of a given foam sample, a 600 mm
x
600 mm x 25 rnm specimen was cut. This specimen was tested immediately for its thermal resistance in a 600 mm x 600 mm HFM apparatus. This value served a s a n initial reference value. Then this specimen was further divided into four 300 mm x 300 mm slabs and from each
of these two 1 0 mm thick specimens were prepared. Four such specimens were then encapsulated a t different stages of aging. The other four specimens were used to monitor laboratory aging, (i.e., t h e change in thermal conductivity versus exposure time). The encapsulated specimen re- mained in the laboratory a t least for a period of 7 days prior to testing, to allow for equalization of partial pres- sures of all components of the cell-gas.
Results
The details on t h e specimens tested according to the above procedure are given in Table 1. The results on the polyurethane system blown with CFC-11 are shown in Fig- ure 5 and those on the system blown with HCFC 123 are shown i n Figure 6.
1
i
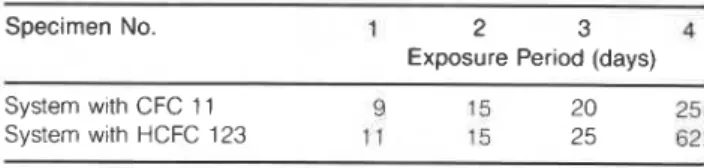
Table 7 . Period of laboratory exposure prior to encapsulation of the test specimens.
Specimen No. 1 2 3 4
Exposure Period (days)
System wlth CFC 11 9 15 20 25
TEMPERATURE, K
Figure 5. Thermal conduct~v~ty of encapsulated spec~rnens of polyurethane foam blown with CFC-I I , at different stages of agelng
To avold crowding, only part of the expenmental data IS plotted (see
Figure 7)
DISCUSSION
Gas-filled cellular plastic insulations gradually lose some of their insulating value during their service life. This phenomenon is referred to as aging. Traditionally it was believed that the outward diffusion of the blowing agent was the main cause for aging. It was only recently, with improved understanding of aging [8], that the role of inward diffusion of air and resulting dilution of the blow- ing agent became apparent.
The experimental results presented here highlight the significance of air diffision in the aging process. Figure 5 shows that the change in overall thermal performance of the test specimens of polyurethane system blown with CFC-11 during 25 days was appreciable. Yet, during this period, the beginning of condensation (point B, in Figure
62DAYS
0.021
250 260 270 280 290 300 310 320
TEMPERATURE, K
Figure 6. Thermal conduct~vlty of encapsulated spec~mens of polyurethane loam blown wlth HCFC-123, at different stages of age- lng To avold crowd~ng, only part of the expenmental data IS plotted
(see Flgure 8)
I), remained unchanged. One may infer from this that the partial pressure of the blowing agent in the cell gas mix- ture remained constant over this period. Thus the increase in thermal conductivity may be attributed mainly to dilu- tion of blowing agent due to the inward diffision of air rather than outward diffiion of the blowing agent. The Figure also shows that the test specimens encapsulated after 20 and 25 days are not too different in terms of aging. One could probably assume that these specimens attained equilibrium with air by 20 days of exposure.
Figure 7 which represents one of the specimens shown in Figure 5 allows one to infer that the point B, for the partic- ular test specimen corresponds approximately to 279.5
K,
as follows. The actual deviation from linearity in the gas mixture region starts approximately a t the mean speci- men temperature of 284.5 K. At that time the coldest layer in the test specimen is approximately a t 279.5
K
and it is the condensation occurring in the layer that causes the de- viation from linearity. (If the measurements were done with an infinitesimally small temperataure gradient across the specimen, a sharp minimum in the curve would occur at 279.5 K.)As previously discussed, information on point B, can be used to calculate the partial pressure of the blowing agent in the above test specimen. The normal boiling point of CFC-11 is 296.95 K and its enthalpy of vaporization is 24.77 kJ.mol-' [9]. Then from Equation (1) the partial pressure can be calculated as 0.53 atmosphere.
As stated earlier, the partial pressure of CFC-11 in all the four test specimens appears to be the same. Since these results relate to 9 to 25 day-old specimens, one may infer that the effective initial pressure of the blowing agent could not have been significantly different from 0.53 at- mosphere. The term "effective pressure" is introduced here to differentiate this value from the actual initial pressure of the blowing agent. During the foaming process, the tem- perature of the foam increases and the pressure of the blowing agent reaches a t least 1 atmosphere.
Subsequently, the foam cools down and part of the blow- ing agent gets adsorbed and dissolved by the polymer matrix. In the tested specimens it appears that the above processes have reduced the pressure of the blowing agent to approximately 0.53 atmosphere.
Figure 7 also shows the results from the cooling and heating parts of the measurement procedure separately. For this specimen containing CFC-11 there is no indica- tion of any hysteresis effect due to condensation and vapor- ization of the blowing agent.
The experimental data on the system blown with HCFC- 123 show slightly different trends. Figure 6 indicates that the test specimens from the system blown with HCFC-123 have already attained equilibrium with air after only 11 days, as the three lower curves are placed close to one another. But the measurements done after 62 days expo- sure indicate significant reduction in thermal condudiv- ity. A shift in the condensation point is also apparent, in- dicating a measurable change in the partial pressure of the blowing agent between 25 and 62 days of exposure.
Unlike the specimen in Figure 7, the specimen contain- ing HCFC-123 represented by Figure 8 showed hysteresis effect, probably due to condensation and vaporization, and yielded two separate curves during the heating and cool- ing parts of the measurement. If this effect is dominant a t all stages of aging, more information on adsorption, desorption and dissolution of the blowing agent by the solid matrix of the foam will have to be acquired before the
0.021 Y
i
5
g
0.020 5-
I-%
0B
5
0.019a
2
-
HEATING LU-
COOLING I I- --O-- HEATINGT h e non-destructive nature of t h e procedure presented here can be used t o investigate t h e effects of environmen- tal factors on t h e long-term thermal performance o f t h e in- sulations, as t h e foam is exposed
to
repeated condensation- evaporation cycles -for example, how freeze-thaw conditions may affect t h e solubility o f t h e blowing agent i n t h e solid matrix o f t h e foam.O f t e n it may not be necessary to perform t h e measure- m e n t s for as large a temperature range as reported i n t h i s work. I t appears that information on a temperature range,
10 K about t h e m i n i m u m value for t h e thermal conduc- tivity should give all t h e details necessary for subsequent 1
analysis for partial pressure o f t h e blowing agent. T h e present method, w h e n integrated w i t h t h e traditional measurements of t h e dependence o f thermal conductivity
I
o f test specimens on time, will provide unique information0 .018
-260 270 280 290 300 310 for predicting thermal performance of gas-filled cellular
plastic insulations [10,111.
TEMPERATURE. K
Figure 7. Experimental results on an encapsulated spec~men of the
foam blown w~th CFC-I 1, dunng three different senes of step ACKN()WLEI)GEMENm
changes In temperature.
T h e authors gratefully acknowledge t h e support from DuPont Canada Inc. for t h i s work. T h e y are indebted t o present data can be analyzed correctly for t h e partial Mrs. N . Normandin for carrying out t h e measurements re- pressure o f t h e blowing agent. ported i n t h i s work.
CONCLUDING REMARKS
T h i s paper presented t h e development and calibration o f a modified HFM apparatus, a method t o freeze t h e aging process of t h i n slices of polyurethane foam insulation by encapsulation and a test procedure t o determine t h e t e m - perature dependence o f thermal conductivity o f t h e encap- sulated test specimen i n a short period o f time.
Measurements were performed on a polyurethane sys- t e m blown w i t h CFC-11 and HCFC-123. T h e results very clearly establish t h e efkct o f condensation o f blowing agents on t h e thermal conductivity of t h e foam. T h e data also permit t h e determination of partial pressure o f the blowing agent i n a non-destructive way.
0.021
I
I
250 260 270 280 290 300 310 320
TEMPERATURE, K
Figure 8. Experimental results on an encapsulated spec~men of the foam blown with HCFC-123, dunng three different senes o f step changes in temperahre,
REFERENCES
1. Creazzo, J. A., P. L. Bartlett and M. R. Ascough. "The
DuPont Program on Alternative Blowing Agents for Polyurethane Foams-Recent Developments," Polyure- thanes 88, SPI Conference, pp. 130-140 (1988). 2. Cunningham, A., I. D. Rosbotham, D. J. Sparrow,
R. K . Brown and C. J. Galbraith. "The Effect of Water as Partial Blowing Agent for Rigid PUR and PUR/ PIR Foams," Polyurethanes 88, SPI Conference, pp.
164-169 (1988).
3. Peters, H. C., J . N . Breunese and L.
J.
F. Hermans. "Thermal Conductivity o f Gaseous CFC1, (Freon 11)and CF,Cl, (Freon 12) and Their Mixtures w i t h
N2
at292
K,"
Znt J of Thermophysics, 13(1):27-34 (1982).4. Degenne, M. and S. Klarsfeld. A New Type of Heat Flowmeter for Application and Study of Insulations and Systems, ASTM Spec. Tech. Publ. 885, pp. 163- 172 (1985).
5. Bomberg, M. and K . R. Solvason. Comments on Cali- bration and Design o f a Heat Flow Meter, ASTM Spec. Tech. Publication 789, pp. 277-292 (1983), cf. also Dis- cussion o f Heat Flow Meter Apparatus and Transfer I
Standards used for Error Analysis, ASTM STP 879,
pp. 140-153 (1985).
6. Bomberg, M. and K . R. Solvason. " Precision and Ac-
curacy of Guarded Hot Plate Method," Thermal Con- ductivity, 17:393-410 (1983).
I
7. Shirtliffe, C. J. Establishing Steady-State Thermal
Conditions i n Flat Slab Specimens, ASTM STP 544,
pp. 13-33 (1974).
8. Schuetz, M. A . and L. R. Glicksman. " A Basic Study
of Heat Transfer Through Foam Insulation,"J Cel- lular Plastics, 20:114-121 (1984).
9. Bulletin Freon Product Information B-2, DuPont
10. Bomberg,
M.
"A Model of Aging for Gas-filled Cellular Plastics,"J.
Cellular Plastics, 24:327-347 (1988). 11. Bomberg,M.
"Scaling Factors in Aging of Gas-filledCellular Plastics," submitted to
J.
Cellular Plastics.I
BIOGRAPHIES
I
Mavinkal K. Kumaran
Kumar Kumaran is a Research
t Officer at the Institute for Re-
search in construction, National Research Council Canada. He is responsible for the Thermal Insu- lation Laboratory a t IRC. He re- ceived his B.Sc. &d M.Sc in Chem- istry from Kerala University, India and Ph.D. in Chemical Thermody- namics from University College London, England, in 1976. He joined NRC in 1981.
Mark T. Bomberg
Mark Bomberg is a Senior Research Officer at IRC. He ob- tained an M.Sc. in Civil Engineer- ing and a D.Sc. at the Warsaw In- stitute of Technology, Poland. Between 1967 and 1975, he worked a t the Division of Building Tech- nology, Lund Institute of Technol- ogy, Sweden, where he received a
9 1 " Doctor of Technology degree. He
joined NRC in 1975. His current
CU:
responsibility includes assistanceto industry and standard writing organizations
to
develop test methods for evaluating performance of construction materials and systems. He is a member of ASTM Commit- tees C-16 on Thermal Insulation and E-6 on Performance of Building Constructions.Roger M. Marchand
Roger Marchand is a Technical Officer a t IRC. He is responsible for constructing and installing equip- ment used in the Thermal Insula- tion Laboratory of the Institute. Mr. Marchand is also involved in the development of test procedures. He joined NRC in 1976.
Michael R. Ascough
Mike Ascough is a Senior Techni- cal Consultant with DuPont Can- ada Inc, located in Mississauga, with responsibility for new product development and technical pro- grams related to alternative fluoro-
w-%
7 carbon blowing agents. A graduate
%
$3
of the Royal Institute of Chemistry,*% England, he joined DuPont Can-
;f
ada in 1969 and has held a variety of technical and supervisory as- signments in Research and Devel- opment and Technical Service functions.