Publisher’s version / Version de l'éditeur:
Canadian Journal of Civil Engineering, 29, Oct 5, pp. 787-798, 2002-10-01
READ THESE TERMS AND CONDITIONS CAREFULLY BEFORE USING THIS WEBSITE.
https://nrc-publications.canada.ca/eng/copyright
Vous avez des questions? Nous pouvons vous aider. Pour communiquer directement avec un auteur, consultez la
première page de la revue dans laquelle son article a été publié afin de trouver ses coordonnées. Si vous n’arrivez pas à les repérer, communiquez avec nous à PublicationsArchive-ArchivesPublications@nrc-cnrc.gc.ca.
Questions? Contact the NRC Publications Archive team at
PublicationsArchive-ArchivesPublications@nrc-cnrc.gc.ca. If you wish to email the authors directly, please see the first page of the publication for their contact information.
NRC Publications Archive
Archives des publications du CNRC
This publication could be one of several versions: author’s original, accepted manuscript or the publisher’s version. / La version de cette publication peut être l’une des suivantes : la version prépublication de l’auteur, la version acceptée du manuscrit ou la version de l’éditeur.
For the publisher’s version, please access the DOI link below./ Pour consulter la version de l’éditeur, utilisez le lien DOI ci-dessous.
https://doi.org/10.1139/l02-078
Access and use of this website and the material on it are subject to the Terms and Conditions set forth at
Effect of joint contamination on the quality of butt-fused HDPE pipe joints
Zhao, J. Q.; Daigle, L.; Beaulieu, D.
https://publications-cnrc.canada.ca/fra/droits
L’accès à ce site Web et l’utilisation de son contenu sont assujettis aux conditions présentées dans le site LISEZ CES CONDITIONS ATTENTIVEMENT AVANT D’UTILISER CE SITE WEB.
NRC Publications Record / Notice d'Archives des publications de CNRC:
https://nrc-publications.canada.ca/eng/view/object/?id=cf7ea536-f310-43a3-88ee-2bbc8ce8c898 https://publications-cnrc.canada.ca/fra/voir/objet/?id=cf7ea536-f310-43a3-88ee-2bbc8ce8c898
Effect of joint contamination on the quality of butt-fused high-density polyethylene (HDPE) pipe joints
Zhao, J.Q.; Daigle, L.; Beaulieu, D.
A version of this document is published in / Une version de ce document se trouve dans :
Canadian Journal of Civil Engineering, v. 29, no. 5, Oct. 2002, pp. 787-798
www.nrc.ca/irc/ircpubs
Effect of joint contamination on the quality of butt-fused HDPE pipe joints
Jack Q. Zhao∗, Ph.D., P.Eng.Research Officer
Institute for Research in Construction, National Research Council Canada M-20, Montreal Road, Ottawa, Ontario K1A 0R6
Phone: (613) 993 – 3802 Fax: (613) 954 – 5984 Email: jack.zhao@nrc.ca
Lyne Daigle, P.Eng. Technical Officer
Institute for Research in Construction, National Research Council Canada M-20, Montreal Road, Ottawa, Ontario K1A 0R6
Phone: (613) 998 – 2584 Fax: (613) 954 – 5984 Email: lyne.daigle@nrc.ca
Denis Beaulieu, Ph.D., P.Eng. Professor
Département de génie civil, Université Laval, Sainte-Foy, Québec G1K 7P4 Phone: (418) 656 – 2869 Fax: (418) 656 – 2928 Email: denis.beaulieu@gci.ulaval.ca
Word count : 6873 (plus 10 figures)
ABSTRACT: Butt fusion is an effective method for joining high density polyethylene (HDPE) pipe on job sites. However, there is lack of quantitative methods to evaluate pipe joint quality. The objective of this study was to develop such a quantitative approach in order to determine the effect of joint contamination on the quality of the fused joints. The study included testing a total of 21 butt-fused HDPE pipe joints that were made under different dust conditions. The results of the tests were then used to determine the effect of dust contamination on the quality of the fused joints. Microscopic examination of the fracture surfaces of the test specimens showed that not all the contaminants at the welding interface were squeezed out into the beads formed during the fusion process. Four failure modes were identified and a failure criterion was established to categorize the quality of a fused joint into four grades – bad, poor, good and excellent. Among the properties of the materials considered, tensile energy to break (TEB) and maximum strain were found to be the most acceptable parameters for distinguishing between different quality of joints. Furthermore, the results showed that under optimum joining conditions, the quality of butt-fused joints can be as good as that of the parent pipe.
Key words: polyethylene pipe, butt fusion, joint contamination, tensile energy to break, failure
Introduction
High density polyethylene (HDPE) pipe is increasingly used for the construction and
rehabilitation of water, sewer and gas pipelines. An advantage of this material is the ability to join pipe segments by heat fusion in the field rather than using the bell and socket joints that are typical for PVC pipe. The ability to fuse and form longer installation lengths means less
installation pits and less disruption to the public when trenchless technologies such as sliplining and directional drilling are used.
In the fusion joining process, the welding surfaces of two pipe segments are properly trimmed and prepared. Then, the fusion process consists of four steps: heating, heat soaking, heater plate removal and joining-cooling (Plastics Pipe Institute 1993; Potente et al. 1988; ASTM D 2657-97 1997). Firstly, the welding surfaces are heated and melted during which the ends of two HDPE segments are pressed against a common heater plate under a specified pressure. Secondly, heat soaking continues the heating and melting but with a reduced pressure. Thirdly, the heater plate is removed and the two molten pipe ends are brought together. Lastly, joining-cooling allows contact of the two molten surfaces under a specific pressure to the moment the pressure is completely removed. The proper times of these steps are dependent on the material, pipe diameter and pipe wall thickness, and are well established (Barber and Atkinson 1974; Plastics Pipe Institute 1993; Benkreira et al. 1991a; 1991b).
The quality of butt-fused joints of HDPE pipe depends largely on joining conditions and procedures (Barber and Atkinson 1974; Pimputkar 1989). Although it is recognized that joints made following standard procedures and in optimum environmental conditions have mechanical properties approximately as good as those of the parent pipe (Bowman 1996; Munns and
Georgiou 1999; Plastics Pipe Institute 1993), improperly-made butt fused joints may be the weakest links in the pipelines (Cowley and Wylde 1978; Lu et al. 1992). Construction sites are not always ideal environments and the standard joining procedures may not be followed. Wind and other external factors may introduce contaminants such as dust, soil, water and grease to the welding surfaces of the pipe, as well as to the surfaces of the heater plate. Dust deposits inside the pipe near the pipe ends may be attracted to the welding surfaces because of electrostatic potentials created by the rotating motion of the trimming plate during the preparation of the welding surfaces.
The standard joining procedure requires cleaning of the welding surfaces just prior to the heating step and the use of a clean heater plate (ASTM D 2657-97; Driscopipe 1997). However, it is impractical to clean manually the surfaces of the heater plate while they are at hot working temperatures. One of the methods suggested by Marshall (1991) is to make a dummy weld (or two dummy welds for pipe walls thicker than 20 mm) at the start of a welding session. This method would be costly and reduce productivity if it is used often throughout a welding session. Accumulated dust on the welding surfaces of the pipe during the heater plate removal step cannot be cleaned. There is no means to clean a molten welding surface without disturbing it or causing a drastic drop in its temperature. Other potential field problems include cold joints resulting from excessively long removal time or inadequate heater plate temperatures and joint misalignment (Bowman 1989; Marshall 1991).
These potential problems with HDPE fused joints have been recognized in the water industry and have led to the formation of “The Thermoplastics Jointing Group” in the United Kingdom to address the quality of butt-fused joints in the field (Buckler 1998). In assessing the quality of
fused polyethylene (PE) pipe joints, the weld factor, f, is often used (Barber and Atkinson 1974). This factor is defined as:
[1]
A weld factor of 1 or greater indicates that the joint is as strong as or stronger than the parent pipe. However, there is disagreement in the literature as to what parameter (or property) should be used to best represent the strength of the joint and the pipe wall. Tensile yield stress (Bowman 1996; Wilson 1995), plastic deformation energy (Nishimura and Narisawa 1991), maximum strain (DeCourcy and Atkinson 1977), and tensile energy to break (TEB) (Wilson 1995; Hinchcliff and Troughton 1998) have all been used for this purpose. TEB, also known as modulus of toughness, is the area under the stress- strain curve (Eq. 2) and is often expressed in Joules per unit volume over the gauge length (refers to the narrowed section of a dog bone shaped specimen) of the specimen:
[2]
where σ is the stress and ε is the strain. Plastic deformation energy is the TEB minus the elastic energy, whereas yield stress is the stress at yield. Maximum strain is the strain at failure, a higher value of maximum strain means a larger area (higher TEB) under the stress-strain curve.
wall pipe the of strength joint the of strength = f
∫
= σdε TEBThere are some reported studies on contaminated fused joints (Lu et al. 1992; Marshall 1991; Reynolds et al. 1998; Watson 1988). Lu et al. (1992) used three types of contaminates – Vaseline, graphite and Teflon in making their fusion joints under two welding pressures. Notched specimens were then prepared from the joints and exposed to a constant low tensile stress. The resistance to slow crack growth was evaluated. They found that at the welding pressure of 1.61 MPa, Vaseline and graphite had a negligible effect on the weld quality. On the other hand, Teflon contaminated joints had greatly reduced lifetime, especially at the pressure of 0.31 MPa.
Marshall (1991) investigated inclusions within a weld, mechanical notching of welds, and dust contamination. Inclusions were artificially produced by placing thin circular aluminum foil discs varying from 0.5 to 8 mm in diameter. These discs were placed in the centre of the weld
following the removal of the heater plate. In another test, chalk dust was transferred from the heater plate to the molten welding surfaces. Finger grease, water spray, and blowing crushed chalk were used in the other tests. After examination of the chalk dust contaminated fracture surface, Marshall found that not all the chalk dust particles had been displaced out of the welding interface. The criterion used in this study for judging the quality of the welds was ductile/brittle failure - a weld that failed in a ductile manner was considered satisfactory. Marshall concluded that medium density polyethylene (MDPE) material was more tolerant to field welding
conditions than HDPE material and that thicker-walled pipe is more sensitive to defects than pipe with a thickness of less than 20 mm.
In the study carried out by Reynolds et al. (1998), circular marks were made with stencils on the welding surface. Test joints were then made with marks of talc, diesel, talc + diesel and talc + silicone lubricant. The effect of these contaminants was evaluated by an “External Bead Test”
that involved removing the bead, and then bending and twisting it to identify visually joint slits or weak points. Tensile tests were also conducted on the samples taken from the test joints. Reynolds et al. concluded that the fusion process results in a stretching of the interface rather than a complete displacement of the interface into the weld beads.
In the aforementioned studies, the type of contaminants are unrealistic and no consideration was given to the likelihood of joint contamination by suspended dust particles. The study reported in this paper was conducted on test joints that were made using clay and cement dust, both of which are common on construction sites. These test joints were made under the dust conditions that represent realistic site conditions caused by blowing wind. Specimens were then prepared from these test joints and tested in the laboratory. The objective of the study was to determine
experimentally if the dust contaminants were all displaced into the beads and, if not, to determine the effects of the dust contaminants on the quality of the butt-fused joints.
Tests using specimens from fused joints, though destructive, can be used to establish the optimal welding conditions at a specific job site. For instance, prior to actual fusion and installation of HDPE pipe, such tests can be carried out to determine the most appropriate timings of the four fusion steps by testing joint specimens made with varying parameters. Also, different diameters and wall thickness require appropriate adjustment of the fusion process. Even wind and dust conditions can vary from site to site. Once a quality criterion (such as the one described in this paper) is established, it can be used to judge the quality of other joints in subsequent tests.
Experimental Work
Pipe WeldingButt-fused test joints were made on a HDPE pipe, 455mm outside diameter and 22 mm thick, by an experienced operator using a commercial fusion machine in a machine shop. The pipe was manufactured with PE 3408 resin and had a diameter ratio (ratio of diameter to thickness) of 21. Dust was dropped through a sieve in front of a fan at one end of the pipe during the removal period in order to simulate a dusty and windy site condition with the wind tunnel effect (Figure 1). The sieve removed large lumps of the dust particles so that a more uniform degree of dust suspension could be achieved. Two types of dust particles were used - dry clay powder and cement powder, both of which are common dust particles on a job site. A USS #200 sieve was used, for both clay and cement powders, to limit the particle size to less than 75 µm. The cement used was Type 10 cement and its particle sizes vary from 3.75 µm to 47.5 µm with an average of 12 µm (ASTM C 115-96a 1996). As expected, all of the particles of the cement powder passed through the sieve. The clay powder used was Edmonton Clay. It had been fully dried and
pulverized for a previous study. The particle sizes of the clay had been found to vary from 0.6 to 1,300 µm (Rajani and Crawford 1996). With the sieve, the particle sizes of the clay powder were limited to the range of 0.6 to 75 µm and the average particle size within this range was about 4 µm. It was observed that the cement powder particles from a freshly opened bag were more uniform in size than the clay powder. Some particles in the clay powder were stuck together. As a consequence, when dropped through the sieve in front of a fan, the cement particles were observed to stay suspended longer in the air than those of the clay.
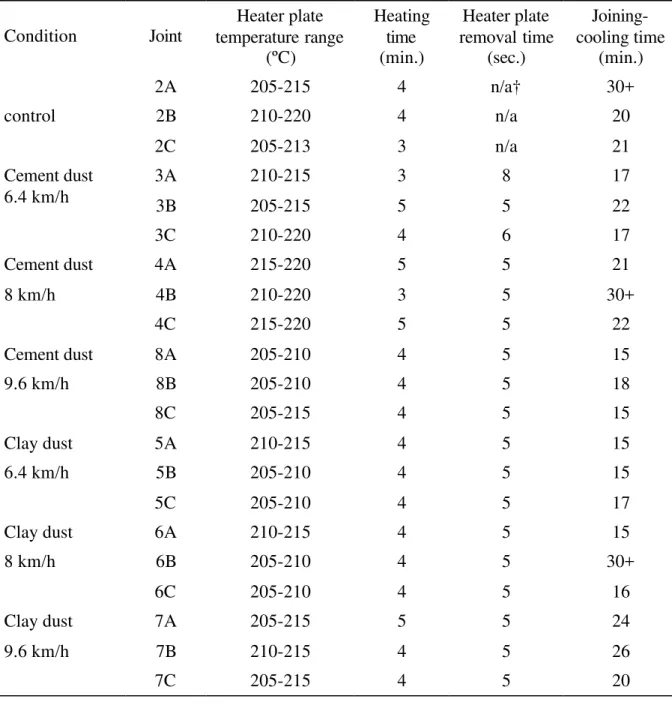
Three pipe joints were made under each of six different dust conditions (Table 1). One set of test joints were made under the standard (control) welding condition. For each condition, three joints
(A, B and C) were made at a distance 450 mm apart, with joint A being the first one made. The distance between the dropping point of dust and the fusing plane for the subsequent joints (joints B and C) was increased intentionally by approximately 450 mm after each fusion. This increase in distance was designed to vary dust intensity as large dust particles would not travel as far as small ones. A total of 21 test joints were made with the following test variables:
• two dust types (clay, cement) • three wind velocities (V1, V2, V3)
• three distances between the dropping point of dust and the fusing plane (joints A, B, C) • one ideal condition (control)
Except for the various dust conditions, all the other welding parameters were maintained in the standard ranges. The pressure during the joining-cooling step was 520 kPa (75 psi) for the first 2 to 3 minutes and then was reduced to 31 kPa (4.5 psi) for the remaining time. The total joining-cooling time varied between 15 and 26 minutes for most joints, except for three joints which were cooled for more than 30 minutes (Table 1). The temperature of the heater plate was measured with a portable laser thermometer just prior to the heating step and was observed to vary by 10ºC across the plate surface, with the warmest location being at the bottom of the plate. The ambient temperature varied between 14.3ºC and 19ºC and the relative humidity varied between 27% and 38% during the test joint preparation.
Sample Preparation and Tests
A sample from each test joint was cut at the invert (the bottom position on the pipe’s
circumference) where the dust accumulation was observed to be the most (discussed further in next section). The sample was then made into two dog bone shaped test specimens, which were designed to include as much as possible the full thickness of the pipe wall (Figure 2). The width
to thickness ratio was 2.5:1 over the gauge length, which was within the standard dimensions for tensile test specimens as per ASTM D 638-99 (1999). These specimens were machined
specifically to have the fused joint in the middle of the gauge length. All the test specimens were tested under the same tensile loading procedure on an Instron machine (Model 4500-4502) located in a laboratory where the relative humidity was maintained between 45 and 55% and the room temperature between 21º and 25 ºC.
Results and Discussions
Observed Dust Accumulation on Welding Surfaces
To inspect the welding surfaces for dust contamination during the fusion process is simply not possible because of the short removal time. Therefore, a qualitative test was carried out to determine dust accumulation on the welding surfaces prior to the heating of the pipe welding surfaces. In this test, the trimmed pipe ends were brought to within approximately 150 mm (6”) of each other, a typical gap during the removal of the heater plate. The dust was then blown into the pipe for 5 seconds, a typical removal time. A visual examination of the welding surfaces showed that dust accumulation was clearly evident (Figure 3). Furthermore, non-uniform dust distribution was observed across the pipe wall thickness and around the circumference of the welding surfaces. Dust accumulated more near the invert than at any other location
circumferentially, and more on the inner section of the pipe wall thickness than on the outer section. This test was duplicated for each of the six different test conditions. The surfaces were then cleaned with common tissues and a cleaning solution that is recommended for such
purposes. Figure 4 shows those tissues, which serve as an indication of dust accumulation on the welding surfaces during a normal removal time.
Seletion of Quality Parameter
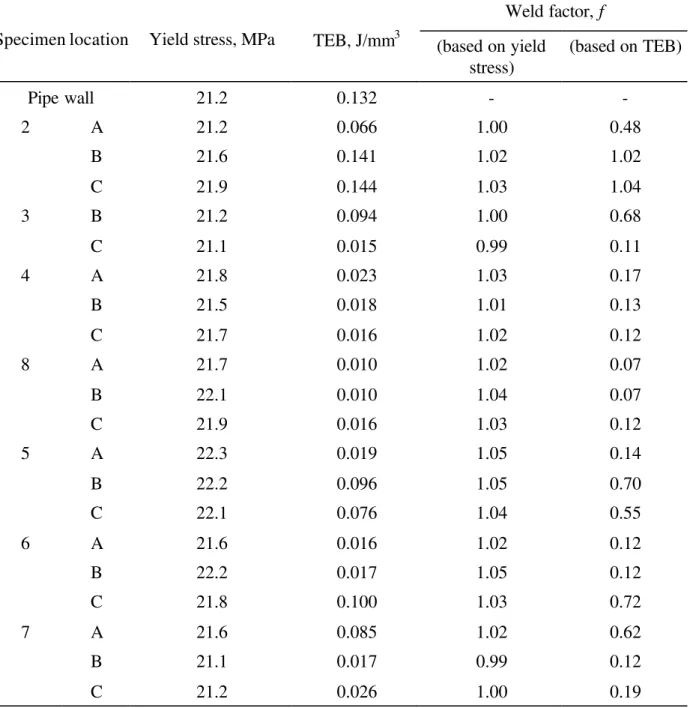
An assessment was made to determine which parameter was most appropriate for determining the weld factor, f (Eq. 1). First, tensile yield stresses were examined. The tensile yield stresses of the joint specimens varied from 21.1 to 22.3 MPa, with a mean value of 21.7 MPa. The mean tensile yield stress of the specimens made from the parent pipe was 21.2 MPa (Table 2). The tensile yield stresses were not significantly affected by the artificial dust conditions, despite the distinct failure modes that were observed (Figure 5). Consequently, the calculated weld factors using the measured tensile yield stresses varied little between 0.99 and 1.05. It was concluded that tensile yield stress could not be used as sole parameter for quality discrimination of butt-fused joints. The same conclusion was reached for yield strain and modulus of elasticity.
The measured maximum strains, or strains at failure, had a larger variation for different test conditions. However, maximum strains cannot be used to distinguish between specimens that have the same magnitude of strains but different stress levels. On the other hand, tensile energy to break (TEB) takes into consideration both maximum strains and the magnitude of stresses, providing a more complete picture. The TEB values (average of inner and outer specimens) obtained in this study are given in Table 2. The TEB-based weld factors varied from 0.07 to 1.04. The physical meaning of a weld factor of 1.04 is that the joint is 1.04 time (or 4% )
stronger than the parent , whereas a weld factor of 0.07 means that the joint is only 0.07 times (or 93% less strong than) the parent pipe . It was therefore decided to use TEB as a quality
parameter for investigating different qualities of the fused joints.
Failure Modes
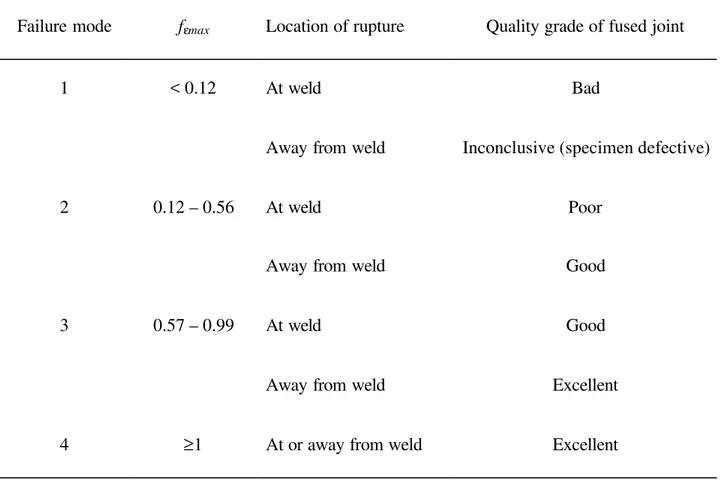
Four distinct failure modes were observed in physical failure patterns (Figure 5) and in stress-strain curves (Figure 6). These failure modes are described below:
Failure Mode 1 – The specimen breaks at the fusion weld before “necking” started (see Fig. 6). Failure was brittle and the maximum strain was less than 100 %. This type of failure mode is considered to be produced by a “bad” joint.
Failure mode 2 – The specimen passed the yield point, and necking started and passed the fusion weld. Failure occurred at the weld before necking reached the natural draw ratio that is defined to be the point at the end of the necking zone (Peacock 2000). The
maximum strain varied between 100% and 500%. This type of failure mode is considered to be produced by a “poor” joint.
Failure mode 3 – The gauge length of specimen was completely necked when failure occurred at the weld. The maximum strain varied between 500% and 900%. Joints that fail in this mode are considered to be “good” joints.
Failure mode 4 – The gauge length of specimen was completely necked when failure occurred away from the weld. The maximum strain was above 900%. This failure mode is comparable to that of the parent pipe that has the same magnitude of failure strain. Joints that fail in this mode are considered to be “excellent” joints.
The ductile or brittle mode of failure has been used as joint quality indicator (Marshall 1991). Although the pipe is always designed not to exceed the yield point under the expected loading conditions, the performance of polyethylene pipes is stress- and temperature-dependent (Nishio 1983) and creep failures may occur even under the long-term loading conditions that are below the yield point (Lustiger 1983). Furthermore, the geometry of a fused joint is such that notches form between the beads and the pipe walls. These notches can become the initiation points of slow- growth cracks under long term creep loading conditions. Therefore, an “excellent” joint is
one that has ductility comparable to that of the parent pipe and will be expected to perform as well during the entire design life of the pipe. It should however be pointed out that these failure modes were established under short-term tensile loading. The long-term effects of the
contaminated joints can be best addressed with long-term and perhaps fatigue loading. Such long-range research is suggested.
These four failure modes are also represented using both the weld factor based on maximum strains and the location of rupture (Table 3). This proposed failure criterion can be used to determine the quality of fused joints from which dog-bone shaped specimens are prepared and tested. It should be pointed out that the amount of strain is also dependent on the thickness of the specimen (Wilson 1995). Therefore, it is imperative to use specimens of consistent dimensions.
Quality Evaluation of Fused HDPE Joints
The inner and outer sets of joint specimens provided two sets of TEB values for each joint (Figure 7). There are some variations in failure modes and in TEB values within each specimen group, which are likely due to variations in joint quality and dust conditions. In general, the TEB values of the inner wall joint specimens were 22% higher on average than those of the outer wall joint specimens, despite the fact that more dust accumulation was observed, in the initial dust test, towards the inner wall thickness than towards the outer. This difference of 22% between the means was significant at the 95% confidence level (Student t test, a statistical test method) and largely attributed to the TEB difference in the wall quality itself because the mean TEB of the inner pipe wall specimens was 20% higher than that of the outer wall specimens. This finding is contrary to the observation of Björklund and Janson (1981) that the quality of the outer wall is generally better than that of the inner wall. More comprehensive research on changes in
materials and pipe manufacture technologies over the last two decades may help explain variations in material quality across pipe walls.
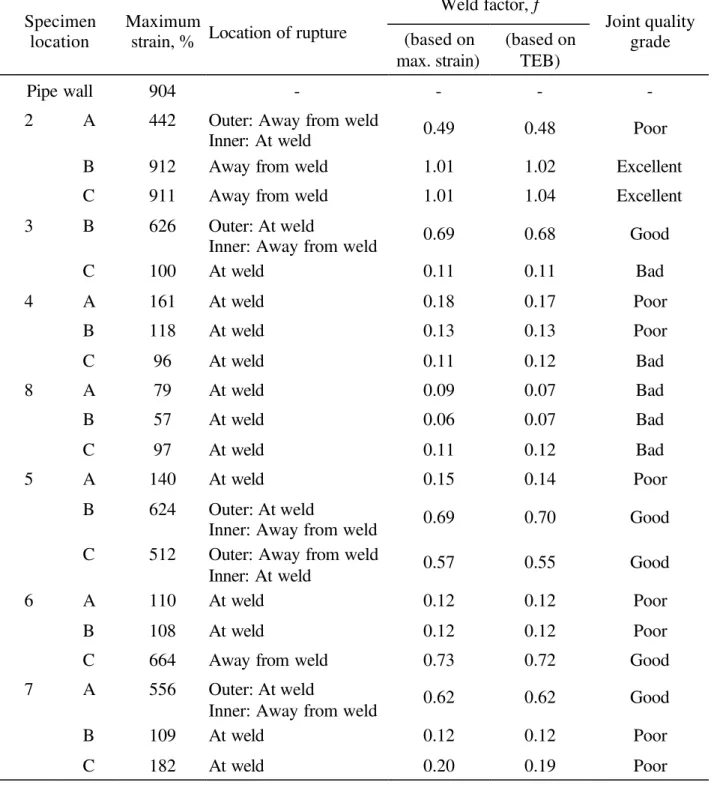
The TEB values in Table 2 are the averages of the inner and outer specimens. Because the stress-strain behaviors of these specimens were similar, either TEB or maximum stress-strain can be used. Table 4 gives the maximum strains, weld factors and the quality grades using the criteria given in Table 3. Two out of three control joints are of excellent quality. The inner specimen of Joint 2A, however, failed at the joint when the maximum strain was less than 100%. The joints that fall into the category of bad quality include 3C, 4C, 8A, 8B and 8C, while those in the category of good quality include 3A, 5B, 5C, 6C and 7A. The rest fall into the category of poor quality.
A t-test was carried out to determine if the control joint specimens and the parent pipe specimens had the same mean at the 95% confidence level. The test showed that these two sets of data had the same mean, indicating that the quality of the control joints was as high as that of the parent pipe. Another t-test was carried out to determine the significance between the TEB results from the contaminated joints and those from the control samples. The difference was indeed
significant at the 95% confidence level.
The mean TEB of the joints made with cement dust was 0.025 J/mm3, which was only half of the mean TEB of the joints made with clay dust. This may be explained by the fact that the cement particles were observed to stay suspended in the air longer than those of the clay, making it more likely to be blown onto the molten welding surfaces. Although the calculated t-value was 1.992, very close to the critical t-value of 2.037 at the 95% confidence level, this difference in TEB caused by the clay dust and cement dust was statistically insignificant.
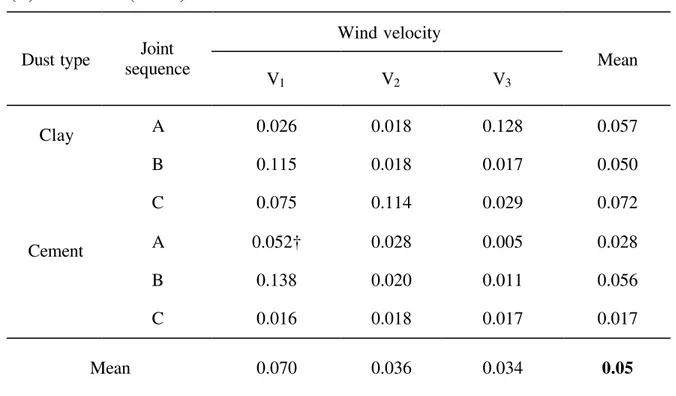
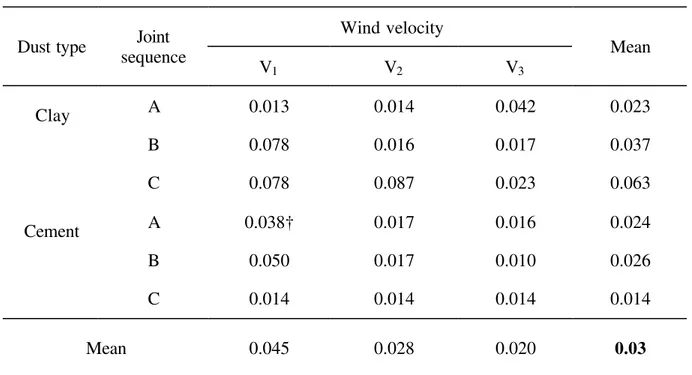
Two-way analysis of variance (ANOVA) was carried out to determine the effect of wind velocity and dust type at the 95% confidence level. The data sets from the inner wall specimens and the outer wall specimens were analysed separately (Tables 5 and 6). The effects of dust type, wind velocity and their interactions were again not significant. In other words, the three wind velocities used in the experiment produced similar contamination on the joint surfaces. This suggests that the experiment could be improved by using a larger range of wind velocities and dust intensities, in order to determine at what velocity the effect of dust becomes negligible.
Microscopic Examination
In order to confirm the presence of dust particles on the fracture surfaces and to understand the failure mechanism of contaminated joints, joint specimens that broke at the weld in a brittle manner were examined under an optical microscope. Figure 8 is a picture of the magnified fracture surface of the specimen from Test Joint 4C. Cement particles are seen as white dots on the fracture surface, and some voids are also evident. Similar features are observed on specimens contaminated with clay dust, as represented by the specimen from Test Joint 7A (Figure 9). For comparison purposes, microscopic examination was carried out on some cross sections of specimens that did not fail at the joint but were instead purposely sectioned for examination. Figure 10 shows the cut surfaces of the specimens from Test Joint 2C (control joint) at the fusion weld and away from the weld but within the heat-affected zone. Although no artificial dust was created during the welding process of this joint, some residual dust particles were still present on the weld interface and can be seen in Figure 10a. These dust particles are believed to be the ambient dust that was attracted to the welding surfaces naturally. Some surface dust attracted to the specimen during the microscopic examination can also be seen. This latter type of dust is
the only kind present on the cross-section away from the weld (Figure 10b). The microscopic appearance of a pipe wall section is similar to that of Figure 10b.
These results show that the dust contaminants were not completely squeezed out of the joints during the fusion process. Furthermore, voids present on the fracture surfaces of the
contaminated joints suggest that the trapped dust particles may act as void and later on as crack initiating points when the pipe is subjected to loading. Long-term fatigue loading may cause initiation of cracks from the trapped dust particles. In addition, the trapped dust particles may act as a barrier to the mixing of the molten materials from both pipe ends, thus creating a weaker plane (Bowman 1996). The denser the dust accumulation, the weaker the joining plane. It follows that mechanical means (e.g. vibration) that promote mixing of the molten materials would reduce the effect of dust contaminates. Further studies to relate the dust intensity on the fracture surface and failure modes can help establish a correlation between these parameters. Folkes et al. (1991) examined the shear flow of material during fusion joining using the scanning electron microscopic technique (SEM). This method may be used to assess the effect of duct contamination on the joint quality. None-destructive detection of dust particles at the joining plane would then help determine the quality of a fused joint in the field. However, these are the subjects of further investigations.
Conclusions
An experimental study has been successfully carried out to determine the effects of dust contamination on the quality of butt-fused joints. A total of 21 test joints were made under the dust conditions created using two common dusts – cement and dry clay. However, readers are reminded of the relatively small sample size when interpreting the results of this study.
Tensile tests were conducted on 42 specimens prepared from those 21 test joints. Fracture surfaces of the joint specimens were examined under a microscope to determine the dust
accumulation on welding surfaces. The statistical analyses were carried out to study the effect of dust type and the difference between inner and outer pipe wall specimens. Based on the results of this study, the following conclusions can be drawn:
• Under optimum joining (environmental and operational) conditions, the quality of butt-fused joints can be as good as that of the pipe wall.
• The contaminants at the welding interface are not completely squeezed into the beads during fusion process. The remaining weld interface is stretched across the pipe wall thickness.
• Properties of the HDPE material, such as yield stress, yield strain and modulus of elasticity, are not suitable for use as a joint quality parameter. Tensile energy to break (TEB) and maximum strain were found to be the acceptable parameters to discriminate between different quality of joints.
• Four modes of failure were defined using maximum strains. A failure criterion has been established and can be used to categorize the quality of a fused joint into four grades – bad, poor, good and excellent.
• The quality of fused test joints was adversely affected by dust contamination. The finer cement dust produced weaker joints than the clay dust, though the difference was not significant. The wind velocities used in the study did not cause any significant difference.
In the absence of a cost-effective, consistent, easy-to-use and non-destructive quality
for construction projects involving butt fusion of HDPE pipe in the field to ensure an acceptable level of joint quality:
• Prior to actual installation, a test program should be implemented to establish a quality criterion similar to the one shown in this paper. Tensile energy to break (TEB) or maximum strain can be used as quality parameters. During field installation, tests should be conducted using the established criterion on specimens that are prepared from randomly selected fusion joints as a quality control method. If poor or bad joints result, joining parameters should be adjusted and the joining environment should be assessed. Subsequent test joints should be made after the adjustment.
• Dust can be attracted to the heater plate as well as to the welding surfaces during a fusion process, and trapped dust will affect the quality of the joint. To ensure a good quality joint, the surfaces of the heater plate should be cleaned at each joining cycle. The welding surfaces should also be properly cleaned after trimming.
• To minimize the wind tunnel effect, the ends of the pipe segments that are being joined should be covered until the joining-cooling step. Then, removal of the covers will benefit the cooling process of the fused joints.
• In windy and dusty conditions, it is necessary to use special and effective shelters that will prevent dust contamination on the welding surfaces.
Acknowledgements
This paper presents results of a research project jointly funded by the City of Ottawa (formerly the Region of Ottawa-Carleton) and the National Research Council Canada (NRCC). Marcel Baril Ltée (Rouyn-Noranda, Québec) and KWH Pipe Ltd. (Anjou, Québec) provided in-kind
contributions by supplying the HDPE pipe and making the test joints. Jim Margeson of NRCC provided assistance in the microscopic examination of the fracture surfaces. The critical review and comments from Balvant Rajani of NRCC during the preparation of this paper are
appreciated.
References
ASTM C 115-96a. 1996. Standard test method for fineness of Portland cement by the turbidimeter. American Society for Testing and Materials. Philadelphia, PA, U.S.A. ASTM D 638-99. 1999. Standard test method for tensile properties of plastics. American Society
for Testing and Materials. Philadelphia, PA, U.S.A.
ASTM D 2657-97. 1997. Standard practice for heat fusion joining of polyolefin pipe and fittings. American Society for Testing and Materials. Philadelphia, PA, U.S.A.
Barber, P., and Atkinson, J.R. 1974. The use of tensile tests to determine the optimum conditions for butt fusion welding certain grades of polyethylene, polybutene-1 and polypropylene pipes. Journal of Materials Science, 9(9):1456-1466.
Björklund, I., and Janson, L.E. 1981. Swedish experience of the use of thermoplastic pipes for water and sewage transport. Proceedings of the International Conference on Underground Plastic Pipe. J. Schrock (editor). American Society of Civil Engineers. New York, NY, U.S.A. pp. 385 – 400.
Benkreira, H., Shillitoe, S., and Day, A.J. 1991a. Modelling of the butt fusion welding process. Chemical Engineering Science, 46(1):135-142.
Benkreira, H., Day, A.J., and Shillitoe, S. 1991b. Butt fusion joining of polyethylene pipes: a theoretical approach. Advances in Joining Plastics and Composites: International Conference. Bradford, Yorkshire, UK, (June 10-12), pp. 188-201.
Bowman, J. 1996. Butt fusion joining polyethylene pipes and assessing the resultant joint strength. Welding and Metal Fabrication, 64(2): 62-65.
Buckler, R.W. 1998. Site Jointing – Bridging the Quality Gap. Plastics pipeline systems for the millennium. Proceedings of Plastics Pipes X, Göteborg, Sweden, (Sept. 14-17), pp. 269-278.
Cowley, W.E., and Wylde, L.E. 1978. Behaviour of butt fusion welded polyethylene pipelines under fatigue loading cond itions. Chemistry and Industry, 3(11): 371-377.
DeCourcy, D.R., and Atkinson, J.R. 1977. The use of tensile tests to determine the optimum conditions for butt fusion welding polyethylene pipes of different melt flow index. Journal of Materials Science. 8(12): 1535-1551.
Driscopipe. 1997. Systems Installation. Philips Driscopipe. Richardson, Texas, U.S.A.
Folkes, M.J., Huanton, J., and Bowman, J. 1991. Microstructure development and its effect on the mechanical properties of butt fusion joints. Advances in Joining Plastics and
Composites. TWI Conference, Bradford, Yorkshire, UK, (June 10-12), pp. 118-127. Hinchcliff, F. A., and Troughton, M. J. 1998. Comparison of short-term coupon tests for
assessing the performance of butt fusion welds in polyethylene pipes. Proceedings of Plastics Pipes X, Göteborg, Sweden, (Sept. 14-17), pp. 555-564.
Lu, X., Qian, N., Brown, N., and Buczala, G. 1992. The effect of pressure and contaminants on slow crack growth in a butt fusion in a polyethylene gas pipe. Journal of Applied Polymer Science, 46(8): 1417-1427.
Lustiger, A. 1983. Analysis of field failures caused by slow crack growth. Proceedings of Eighth Plastic Fuel Gas Pipe Symposium, American Gas Association. New Orleans, LA, U.S.A. (Nov. 29 – Dec. 1), pp. 176-179.
Marshall, J.P. 1991. The Influence of welding parameters on the toughness of butt fusion welds in MDPE. Advances in Joining Plastics and Composites. International Conference, Bradford, UK, (June 10-12), pp. 202-215.
Munns, I.J., and Georgiou, G.A.1999. Ultrasonic and radiographic NDT of butt fusion welded polyethylene pipes. Insight: Non-Destructive Testing and Condition Monitoring. 41(5): 291-303.
Nishimura, H., and Narisawa, I. 1991. Evaluation of impact properties of butt-fusion-jointed medium-density polyethylene pipes for gas distribution. Polymer, 32(12):2199-2204. Nishio, N. 1983. A theory on stress- and temperature-dependence of the life of polyethylene. Proceedings of Eighth Plastic Fuel Gas Pipe Symposium, American Gas Association. New Orleans, LA, U.S.A. (Nov. 29 – Dec. 1), pp. 30-33.
Peacock, A.J. 2000. Handbook of polyethylene, structures, properties, and applications. Marcel Dekker Inc., New York, U.S.A.
Pimputkar, S.M. 1989. The dependence of butt fusion bond strength on joining conditions for polyethylene pipe. Polymer Engineering and Science, 29(19): 1387-1395.
Plastics Pipe Institute. 1993. Polyethylene joining procedures. The Society of the Plastics Industry, Inc., Wayne, NJ, U.S.A.
Potente, H., Michel, P., and Tappe, P. 1988. The principles of hot plate welding of semi-crystalline thermoplastics. Joining Plastics in Production, Welding Institute, Abington, UK, pp.105-126.
Rajani, B., and Crawford, J. 1996. Assessment of Sidewalk Damage and Development of Mitigative Measures. Client Report A-7005.6/A-7013.5, Institute for Research in Construction, National Research Council Canada. Ottawa, ON, Canada.
Reynolds, N.D., Jenkins, P.W., Burgess, P., and Attwood, J. 1998. Fast weld field trials, high productivity butt fused jointing of polyethylene pipes. Proceedings of Plastics Pipes X, Göteborg, Sweden, (Sept. 14-17), pp. 565-576.
Steel, R.G.D., and Torrie, J.H. 1980. Principles and procedures of statistics a biometrical approach. Second Edition. McGraw-Hill, Toronto, ON, Canada.
Wilson, K.A. 1995. Verification of butt fusion weld quality in large diameter PE100 water pipes. Proceedings of Plastics Pipes IX, The Institute of Materials (U.K.). Edinburgh, Scotland, UK, (Sept. 18-21), pp. 168-180.
Table 1. Welding parameters for butt fused joints. Condition Joint Heater plate temperature range (ºC) Heating time (min.) Heater plate removal time (sec.) Joining-cooling time (min.) 2A 205-215 4 n/a† 30+ 2B 210-220 4 n/a 20 control 2C 205-213 3 n/a 21 3A 210-215 3 8 17 3B 205-215 5 5 22 Cement dust 6.4 km/h 3C 210-220 4 6 17 4A 215-220 5 5 21 4B 210-220 3 5 30+ Cement dust 8 km/h 4C 215-220 5 5 22 8A 205-210 4 5 15 8B 205-210 4 5 18 Cement dust 9.6 km/h 8C 205-215 4 5 15 5A 210-215 4 5 15 5B 205-210 4 5 15 Clay dust 6.4 km/h 5C 205-210 4 5 17 6A 210-215 4 5 15 6B 205-210 4 5 30+ Clay dust 8 km/h 6C 205-210 4 5 16 7A 205-215 5 5 24 7B 210-215 4 5 26 Clay dust 9.6 km/h 7C 205-215 4 5 20 † - not available.
Table 2. Mean yield stresses, weld factors and TEB values.
Weld factor, f Specimen location Yield stress, MPa TEB, J/mm3 (based on yield
stress) (based on TEB) Pipe wall 21.2 0.132 - -2 A 21.2 0.066 1.00 0.48 B 21.6 0.141 1.02 1.02 C 21.9 0.144 1.03 1.04 3 B 21.2 0.094 1.00 0.68 C 21.1 0.015 0.99 0.11 4 A 21.8 0.023 1.03 0.17 B 21.5 0.018 1.01 0.13 C 21.7 0.016 1.02 0.12 8 A 21.7 0.010 1.02 0.07 B 22.1 0.010 1.04 0.07 C 21.9 0.016 1.03 0.12 5 A 22.3 0.019 1.05 0.14 B 22.2 0.096 1.05 0.70 C 22.1 0.076 1.04 0.55 6 A 21.6 0.016 1.02 0.12 B 22.2 0.017 1.05 0.12 C 21.8 0.100 1.03 0.72 7 A 21.6 0.085 1.02 0.62 B 21.1 0.017 0.99 0.12 C 21.2 0.026 1.00 0.19
Table 3. Failure modes, weld factors based on maximum strain and quality grades of fused HDPE joints.
Failure mode fεmax Location of rupture Quality grade of fused joint
At weld Bad
1 < 0.12
Away from weld Inconclusive (specimen defective)
At weld Poor
2 0.12 – 0.56
Away from weld Good
At weld Good
3 0.57 – 0.99
Away from weld Excellent
Table 4. Maximum strains, rupture locations, weld factors and quality grades. Weld factor, f
Specimen location
Maximum
strain, % Location of rupture (based on max. strain) (based on TEB) Joint quality grade Pipe wall 904 - - -
-2 A 442 Outer: Away from weld
Inner: At weld 0.49 0.48 Poor
B 912 Away from weld 1.01 1.02 Excellent
C 911 Away from weld 1.01 1.04 Excellent
3 B 626 Outer: At weld
Inner: Away from weld 0.69 0.68 Good
C 100 At weld 0.11 0.11 Bad 4 A 161 At weld 0.18 0.17 Poor B 118 At weld 0.13 0.13 Poor C 96 At weld 0.11 0.12 Bad 8 A 79 At weld 0.09 0.07 Bad B 57 At weld 0.06 0.07 Bad C 97 At weld 0.11 0.12 Bad 5 A 140 At weld 0.15 0.14 Poor B 624 Outer: At weld
Inner: Away from weld 0.69 0.70 Good
C 512 Outer: Away from weld
Inner: At weld 0.57 0.55 Good
6 A 110 At weld 0.12 0.12 Poor
B 108 At weld 0.12 0.12 Poor
C 664 Away from weld 0.73 0.72 Good
7 A 556 Outer: At weld
Inner: Away from weld 0.62 0.62 Good
B 109 At weld 0.12 0.12 Poor
Table 5. TEB values from inner wall specimens and results of the two-way ANOVA to determine the effect of wind velocity and dust type (95% confidence level).
(A) TEB values (J/mm3)
Wind velocity Dust type Joint
sequence V1 V2 V3 Mean A 0.026 0.018 0.128 0.057 B 0.115 0.018 0.017 0.050 Clay C 0.075 0.114 0.029 0.072 A 0.052† 0.028 0.005 0.028 B 0.138 0.020 0.011 0.056 Cement C 0.016 0.018 0.017 0.017 Mean 0.070 0.036 0.034 0.05 (B) Two-way ANOVA
Source of variation SS df MS F F critical
Dust type 0.00304 1 0.00304 1.44 4.75
Wind velocity 0.00496 2 0.00248 1.17 3.89
Interaction 0.00146 2 0.00073 0.35 3.89
Within 0.02544 12 0.00212
Total 0.03490 17
Note: df, degrees of freedom; F, Snedecor statistic; MS, mean square; SS, sum of squares;
Table 6. TEB values from outer wall specimens and results of the two-way ANOVA to determine the effect of wind velocity and dust type (95% confidence level).
(A) TEB values (J/mm3)
Wind velocity Dust type Joint
sequence V1 V2 V3 Mean A 0.013 0.014 0.042 0.023 B 0.078 0.016 0.017 0.037 Clay C 0.078 0.087 0.023 0.063 A 0.038† 0.017 0.016 0.024 B 0.050 0.017 0.010 0.026 Cement C 0.014 0.014 0.014 0.014 Mean 0.045 0.028 0.020 0.03 (B) Two-way ANOVA
Source of variation SS df MS F F critical
Dust type 0.00175 1 0.00175 2.87 4.75
Wind velocity 0.00198 2 0.00099 1.63 3.89
Interaction 0.00008 2 0.00004 0.06 3.89
Within 0.00730 12 0.00061
Total 0.01110 17
List of Figures
Figure 1. Creating dust condition during butt fusion of HDPE pipe.
Figure 2. Dimensions of dog-bone shaped specimens taken from fused joints.
Figure 3. Example of dust accumulation on welding surfaces for 5 s of dust exposure.
Figure 4. Dust on the cleaning tissues used for wiping the welding surfaces.
Figure 5. Failed test specimens displaying different failure modes.
Figure 6. Typical strain vs. stress curves of the test joint specimens.
Figure 7. Tensile energy to break (TEB) values of joint specimens.
Figure 8. Fracture surface of test joint 4C, with cement dust.
Figure 9. Fracture surface of test joint 7A, with clay dust.
Figure 10. Cut surface of test joint 2C (control), (a) at the weld, (b) away from the weld but in the heat affected zone.
Welding surface with dust particles
Joints with cement dust Joints with clay dust 4 Joints sequence 3 8 5 6 7 A B C Wind speed (km/h) 6.4 8.0 9.6 6.4 8.0 9.6
Mode 3 Mode 2 Mode 1 Mode 4 Mode 3 Mode 4
0 5 10 15 20 25 30 35 40 45 0 200 400 600 800 1000 1200 Strain (%) Stress mode 1 mode 2 mode 3 mode 4 Necking zone Yield point Energy to break 1 mode 2 mode 3 1 mode 4 1 mode Strain hardening
0.00 0.02 0.04 0.06 0.08 0.10 0.12 0.14 0.16 0.18 0.20 P1 P2 P3 P4 P5 P6 P7 2A 2B 2C 3B 3C 4A 4B 4C 5A 5B 5C 6A 6B 6C 7A 7B 7C 8A 8B 8C Joint specimen
Tensile energy to break (TEB)(J/mm
3 ) Inner sample
Outer sample
from pipe wall from
control joints
Typical dust
particles
Voids
Voids
Typical dust
(a) (b) Surface dust particle attracted in lab Surface dust particle attracted in lab Residual dust particle