READ THESE TERMS AND CONDITIONS CAREFULLY BEFORE USING THIS WEBSITE.
https://nrc-publications.canada.ca/eng/copyright
Vous avez des questions? Nous pouvons vous aider. Pour communiquer directement avec un auteur, consultez la première page de la revue dans laquelle son article a été publié afin de trouver ses coordonnées. Si vous n’arrivez pas à les repérer, communiquez avec nous à [email protected].
Questions? Contact the NRC Publications Archive team at
[email protected]. If you wish to email the authors directly, please see the first page of the publication for their contact information.
NRC Publications Archive
Archives des publications du CNRC
This publication could be one of several versions: author’s original, accepted manuscript or the publisher’s version. / La version de cette publication peut être l’une des suivantes : la version prépublication de l’auteur, la version acceptée du manuscrit ou la version de l’éditeur.
Access and use of this website and the material on it are subject to the Terms and Conditions set forth at Information needs towards service life asset management
Kyle, B. R.; Vanier, D. J.; Kosovac, B.; Froese, T. M.
https://publications-cnrc.canada.ca/fra/droits
L’accès à ce site Web et l’utilisation de son contenu sont assujettis aux conditions présentées dans le site LISEZ CES CONDITIONS ATTENTIVEMENT AVANT D’UTILISER CE SITE WEB.
NRC Publications Record / Notice d'Archives des publications de CNRC: https://nrc-publications.canada.ca/eng/view/object/?id=4825dc22-91f7-4714-8442-453db9b04a65 https://publications-cnrc.canada.ca/fra/voir/objet/?id=4825dc22-91f7-4714-8442-453db9b04a65
Information needs towards service life
asset management
Kyle, B. R.; Vanier, D. J.; Kosovac, B.;
Froese, T. M.
A version of this paper is published in / Une version de ce document se trouve dans : 17th International CODATA Conference, "Data and Information for the Coming
Knowledge Millennium"
www.nrc.ca/irc/ircpubs
Information Needs towards Service Life Asset Management
Brian R. Kyle, Dana J. Vanier, Branka Kosovac, and Thomas M. Froese
Public Works and Government Services Canada, Architecture & Engineering, Technology, Facility Life-cycle Management, Place du Portage III, 8B1, Hull, Québec, Canada K1A 0S5
Co-authors’ e-mail addresses: [email protected], [email protected], [email protected], [email protected]
The paper stresses the importance of formalized information storage, updating and integration in the domain of “Service Life Asset Management”. The scope of this domain includes all data, knowledge and information required to manage a “built” asset from construction to deconstruction. “Service Life Asset Management” comprises a significant portion of the funds expended by the construction industry each year.
Investigation of the field to date has found a limited number of applications for decision-support in this domain, and did not find any comprehensive solution that addresses the current and future needs for tactical and strategic planning by facility engineers and managers.
The key aspects of information storage and flow in this domain, identified in this paper, are: (1) the data needs for decision support tools, (2) the development of quality metrics for evaluation of performance and condition; (3) the need for standardization of data and information flow, and (4) the need for continuous data transfer amongst actors in the process. The authors also identify the need for continued research and standardization in all these domains.
This paper is exploratory in nature and encourages the reader to visualize what data are required for “Service Life Asset Management” and how those data can be used. This paper proposes schemas and frameworks for storing, updating and accessing the large volumes of heterogeneous data in the construction field. It also proposes a prototype tool to use this information in decision support.
Keywords: Asset Management, Infrastructure Management, Service Life Prediction, Maintenance Management, Decision Support.
1. Introduction
At start-up of any project, construction or otherwise, basic organizational and information handling frameworks are required. These protocols must help meet the immediate goals associated with smooth project execution as well as satisfy the longer-term needs that define the project. Good project management practices and processes usually fulfill these construction project requirements (Sarshar 2000).
The long-term information handling considerations, those for the maintenance and operation phases of a built asset, are dependent upon the information collected, and used, throughout the programming, design, construction and commissioning phases of the project. In fact, information developed and stored during preliminary project phases forms the basis for decisions made during the ‘in-service‘, or operational phase. The ‘in-service’ phase of an asset’s life represents a significant shift in the information flow; that is, from a data collection
mode to an information retrieval one. The information needs of the ‘in-service’ phase are also directly related to the changes in the functional requirements of the asset, the performance capabilities, as well as any maintenance, repair, and renewal projects that may have been affected. In addition, the relevance of any piece of information collected during construction or renovation may not be evident until the ‘in-service’ phase: --all too often the integrity of the original information is not questioned until that point.
The paper describes and discusses the issues pertaining to data management throughout the application of a particular building project delivery and management system but focuses upon the particular concerns regarding data retrieval during the ‘in-service’ phase of the project delivery.
1.1 Definitions
Many different terms are used in the industry to explain similar concepts, and some terms are used interchangeably. The following terms describe concepts that are used in this paper relating to the domain of service life asset management and planning.
Asset managers and property managers are responsible for managing all maintenance, repair and renewal work. It is their collective responsibility to maximize the effect of expenditures and to maximize the value of their assets over the asset’s service life. In many instances, the design and construction costs are small compared to both the asset management costs and service life costs.
The asset manager, by definition in this paper, is responsible for major maintenance, repair and renewal decisions, as well as the long-term strategic planning (beyond five years) of a corporate asset portfolio. The property manager or facility manager primarily deal with day-to-day accommodation issues and the implementation of the strategic plan. All these managers work co-operatively to ensure an asset will attain its predetermined service life.
In this paper, service life is defined as “the actual period of time during which [the asset] or any of its components performs without unforeseen costs of disruption for maintenance and repair” (CSA 1995). The term “unforeseen” is a key word in the definition: all components and materials require planned maintenance and they must be maintained to ensure that the service life is reached. There are two different types of service life, namely: technical service life and economic service life. The term durability has ambiguous meanings in technical circles; its use is discouraged as durability has so many different meanings to so many different people.
The asset managers have to maintain all constructed facilities, either inhabited or not, and these can range from roadways and sewer systems to the building’s envelope and structural system. The term maintenance is normally used to cover a broad range of planned or unplanned activities for “preserving the asset stock and its services in the condition and for the purpose for which it was originally intended” (Burns 1990). Maintenance generally consists of: (1) inspections that are carried out periodically to monitor and record how systems are performing; (2) preventive maintenance that ensures that systems or components will continue to perform their intended functions throughout their service life (e.g. obstructions are removed and depleted protection fluids are replenished); (3) repairs that are required when defects occur and unplanned intervention is required, (4) rehabilitation that replaces one major component of a system when it fails at the end of its service life, and (5) capital renewal that replaces a system because of economic, obsolescence, modernization or compatibility issues.
2. Introduction to the Domain
Service life asset management implies a continuous examination of not just the current condition and performance characteristics of the asset but also a re-evaluation of the relevancy of initial design requirements and the long-term plans. During the service life of any typical asset the functional needs may change repeatedly to meet changing and/or heightened client expectations, to incorporate technological advances, or to satisfy regulatory requirements. An example of a project delivery system for a sophisticated facility owner is used below to illustrate and to delineate the numerous sequential phases of a construction project.
Public Works and Government Services Canada (PWGSC) is responsible for the provision of office space, contracting and construction needs of the Canadian federal public service. In order to provide a consistent framework for the execution of their real property projects, PWGSC implemented a six phase Project Delivery System (PDS) (PWC 1989). The system outlines basic procedures to create integrated project activities, helping to ensure a quality end product provided on time and within budget. It is a generic management tool that emphasizes effective planning as well as the identification and definition of needs, roles and responsibilities. Each of the phases has specific information input requirements that are usually the result of, or output from, the previous phase.
The PDS system is similar in structure to many other project implementation frameworks and is discussed in this paper purely to benchmark typical data needs and information availability in the pre-operational phase of a new facility.
2.1 Pre-operational - Project Delivery System
Phase 1 is the ‘Planning‘ element of the PDS system and attempts to provide the general direction for latter phases. The significant outputs from this phase are: 1) a detailed description of the opportunity, need or problem; 2) prioritized project objectives; 3) an analysis of options; and 4) a recommendation, complete with preliminary project schedule and budget estimates.
In the ‘Definition‘ Phase, Phase 2, the desires stated in the planning document are translated into verifiable technical language suitable for design instructions, contractual agreements and construction terminology.
The ‘Implementation‘ Phase is covered in Phase 3 and is divided into logical steps that permit control of cost, time and quality. In the case of a construction project, this phase includes the development of a design, preparation of working documents, contracting and construction.
‘Commissioning’ or Phase 4 of the PDS is very important to the life of any facility. This phase verifies that the final product satisfies the needs or problems identified in the ‘Planning’ phases. This is accomplished by providing physical confirmations that the technical requirements contained in the design instructions have be satisfied. Failure to fulfill requirements should generate compensating maintenance or operational actions.
The testing of the ‘Operation’ and program of the facility is included in Phase 5. The intent of this phase is to fine-tune the facility operations, with due consideration of the commissioning results. The desired output from this phase is an in-service facility responding to the needs, challenges and opportunities as identified in previous phases.
Following client/user acceptance of the facility, PWGSC conducts an ‘Evaluation’ of the project (Phase 6) relative to content, cost, quality and time, including an identification of major variances between the desired objectives and the finished product. This information is used to generate further action and to contribute to corporate memory for similar projects.
Two other phases are included in this paper to represent the reality of a project delivery system. Phase 7 or the ‘In-service’ phase includes all actions during the normal operations and maintenance phase of a facility’s service life. Phase 8 or the ‘Deconstruction’ phase is primarily concerned with declaring the facility to be “surplus” to the needs of the organization and commencing its dismantling.
2.2 Challenges
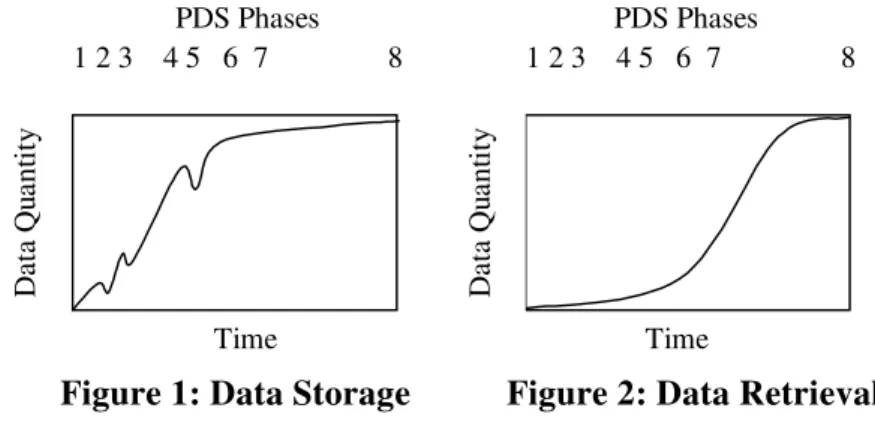
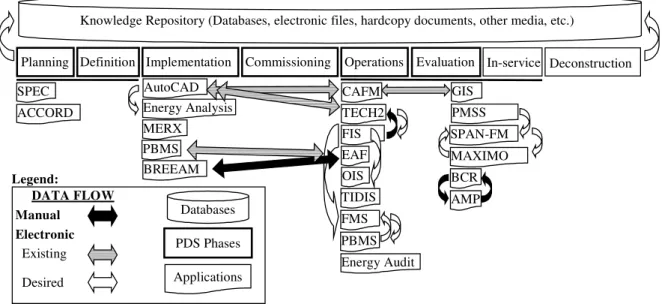
The title “Information Needs towards Service Life Asset Management” stresses the need for sharing data amongst all phases of a project delivery system, such as PWGSC’s PDS, and that those data generated must be passed to the ‘in-service’ phase of the asset. The authors’ views of the potential data growth and data retrieval over the service life of a typical asset are illustrated in Figures 1 and 2. For example, it is assumed that considerable data are generated in the pre-operational phases; however, retrieval demands are highest once the asset has reached a fully operational mode (Yu et al 2000). In Figure 1, the data collected related to a project grows considerably in Implementation Phase 3, but may need to be enhanced in future phases. Others (Yu et al 2000) suspect that data are lost as projects move from one phase to the following, which is illustrated in Figure 1. Figure 2 illustrates an increase in data retrieval as the project matures.
PDS Phases PDS Phases Time Time 1 2 3 4 5 6 7 8 1 2 3 4 5 6 7 8 D ata Q u an tity D ata Q u an tity
Figure 1: Data Storage Figure 2: Data Retrieval
2.3 The Six “Whats” of Asset Management
As PWGSC’s PDS does not elaborate the requirements for data and information in Phases 7 and 8, another model has been selected to represent these requirements. Asset management, which is particularly concerned with the ‘in-service’ life of assets, has been defined by others as a series of six questions that asset managers should be able to answer readily (Vanier, 2001). The data required to answer these six “Whats” for the ‘in-service’ phase are normally generated in the six PDS Phases:
What do you own?: Typically all design data, change orders, contract correspondence, maintenance records, repair data, and renewal information are required to give asset managers a complete picture of the extent of their existing asset. This means that the asset manager requires a complete, up-to-date, set of digital data reflecting the current state of the asset. It is also necessary, at times, to archive or to warehouse snapshots of asset data at specific times during a project to record the state of the asset at that particular time (Vanier, 2001). For example, construction photos or drawings before alterations can be invaluable for future reference.
What is it worth?: The authors believe that, in a perfect world, most decisions regarding asset management are founded on both sound technical and economic data, this stresses the need for accurate cost data. All land purchase, design, and construction costs,
appreciated values, maintenance expenditures, renovation expenses and renewal expenditures (including re-design costs) must be available to asset managers in order for them to conduct proper benefit-cost analysis for maintenance, repair and renewal alternatives.
What is the deferred maintenance?: The backlog of postponed, phased or neglected maintenance must be readily available to asset managers. This deferred maintenance backlog is normally available from the organization’s computerized maintenance management systems (CMMS). Possessing accurate figures on the maintenance backlog provides a quick snapshot of problematic assets and will provide the asset manager a focus for expenditures.
What is its condition?: Cyclic inspection of assets also produces data required to calculate facilities condition index or FCI (NACUBO 1990). These data may reside in numerous databases spread across a large organization. The technical condition index can be obtained from a wide selection of procedures (Vanier, 2001); tools such as Engineered Management Systems (EMS) from the US Army Corps of Engineers (Shahin 1992) provide objective, repeatable processes for evaluating the technical condition of an asset. Typically, these are standalone database applications storing considerable condition data.
What is the remaining service life?: The two remaining “Whats” rely on data that were generated in the previous four “Whats”. Some application programs such as EMSs permit the calculation of remaining service life. However, considerable research is still required to perfect the calculation models. In addition, considerable data are required to feed models such as Markov Chain (Lounis et al, 1998) and no standards have been developed regarding the format of these data.
What do you fix first?: Decision about the ‘best’ maintenance, repair and renewal alternative will take place with or without reliable data. However, good decision can only be made from good data. Asset managers typically compare numerous alternatives when a decision is required, namely: ‘do nothing’, maintain, repair, renew or replace an asset. In addition, after the decisions have been made on individual projects, a prioritization must take place to rank the various competing, yet deserving, projects (Lounis et al, 1998). The amount of data required to perform these two separate, but sequential, tasks can be astronomical. For example, “how much have we been spending on maintenance for this asset?”, “has the asset reached its service life?”, “if not, why not?”, “do we have comparables?”, “what is the design service life of the proposed solution?”, “will a repair effort extend the service life?”, or “can we ‘do nothing’ without affecting performance?” These are all questions that should be asked by asset managers before most decisions can be made and can only be answered with access to data developed throughout the asset’s life cycle.
2.4 From Operational Information to Integrated Asset Management
Designers and specifiers attempt to put facilities in-place that provide the required levels of functionality for a specified design life. They must consider the relative importance of various functional and performance needs that define the project and also be aware that a system’s capability to fulfil the requirements changes over its service life. The reduction of one component’s capability relative to another is non-uniform; that is, the rate of deterioration of one component is often different from that of another. While a premature loss of function does not necessarily mean end of technical service life, it may drastically reduce the economic benefit associated with having and maintaining any given system. Design should be conducted with consideration of clearly identified service lives and awareness of the affect of in-service environment.
To effectively operate a portfolio of facilities it is essential to know the asset base, the operational and functional requirements as well as the associated financial implications
(Refer to Six Whats). As-built, and as-modified, drawings and owner/operators’ manuals are basic to the understanding of ‘in-service’ facilities. The maintenance and inspection practices, and recording thereof, should be of consistent format to readily permit periodic re-assessment of remaining service life. Time and material tracking should be adequately detailed to permit evaluation of the relative effectiveness of maintenance options.
Facility owners and operators maintain, repair, or replace their assets based on perceived economic advantage and their strategic plans for the property. The effectiveness of any (system level) rehabilitation scenario is related to:
• the technical performance and life expectancy of the proposed system;
• the expected and required service lives;
• the significance of the system to the value of the overall facility; as well as
• all associated costs.
Any maintenance, repair or replacement (MR&R) action should be executed only if an examination of the life-cycle economic aspects shows that action to be favourable. Technical service life assessment is a pre-requisite to a life-cycle economic evaluation.
When facilities are removed from service either by decommissioning or deconstruction action at the end of the service life, the as-built drawings, Workplace Hazardous Materials Information Sheets (WHMIS 2000) and any documented modifications are invaluable in assessing the future service possibilities of the facility or any of its disassembled components. 3. PWGSC Situation
PWGSC is a common service provider to the Government of Canada. It employs nearly 12,000 people and delivers services and programs through offices across Canada, as well as in the United States and Europe. PWGSC provides safe, healthy and productive working environments for public servants on behalf of the Government of Canada and manages a diverse portfolio of office space and other general-purpose property.
PWGSC provides professional and technical services, including innovative technological solutions developed through research, to the Government of Canada departments and agencies for the acquisition, development, construction, management, operation, maintenance, repair and disposal of real property. It acts as custodian for approximately $6 billion worth of Government of Canada real property holdings; it houses more than 160,000 public servants across Canada; it administers some 2,000 lease contracts with annual rents of over $500 million, and it administers payments of more than $400 million in lieu of taxes to almost 2,000 Canadian municipalities in which Government of Canada departments own property.
PWGSC has long valued the “principle of knowing” the Six “Whats” of asset management. The quantity of data and multiplicity of data types and user requirements, however, has lead to little success in the application of an integrated asset management plan. Numerous information systems have been developed, each satisfying specific needs of isolated client groups. As more of these systems became computerized over the past three decades, the necessity to move toward an integrated framework has been noted by some and PWGSC began participating in computer-aided design (CAD) development as early as 1975 (PWC 1978) and in standards development bodies related to CAD soon after (CSA 1987). Despite the attempts to move towards interoperable data frameworks, PWGSC still has many systems that independently collect, or process, the same or similar data for use in asset management.
To fully understand the complexity, richness and diversity of PWGSC’s facility operations and asset management practices, the following paragraphs describe various
information systems used by the department. Examples of PWGSC software and information storage, collection and retrieval of data are extensive and the list is not a complete inventory of the relevant software or systems. These software applications, and their interoperability, are illustrated in Figure 3. This listing does not discuss the numerous “off the shelf” applications that individuals may be using to enhance their own proficiencies. Whenever possible, web site information will be provided for all non-PWGSC application packages.
3.1 Phases 1 and 2 Applications - Planning and Definition
The SPEC system has been used since the late 1980’s as a service acquisition and contracting implement for engineering and architectural consulting services. The intent of this computerized system is to spread the lower value technical and design-consulting contracts amongst a pool of pre-qualified professional firms and thereby avoid potential and apparent biases in distributing work to consultants. At approximately the same time, a comparable system, ACCORD, was also established for the allocation of low to moderately priced contracting and construction work.
3.2 Phase 3 Applications - Implementation
A prerequisite of the Implementation Phase of the PDS is an environmental assessment. PWGSC has put together a checklist of items that may indicate the need to perform an in-depth assessment or lead to the revamping of the project definition. The detailed assessments are typically conducted with PWGSC’s Environmental Assessment Framework (EAF), which is paper-based process that relies upon a Canadian version of the British Research Establishment Environmental Assessment Method (BREEAM 2000) score card structure.
While other assessment packages are not stipulated, PWGSC requires that a dynamic energy analysis be conducted prior to design approval on all building projects over 5000 m 2 and on all “potentially energy wasteful” projects. Analysis of this type is typically conducted with DOE2 from the United States Department of Energy (DOE2 2000), BLAST from the U.S. Army Corps of Engineers (BLAST 2000) or a comparable industry recognized package.
PWGSC also requires that all working and as-built drawings be done using computer-aided design drafting software compatible with the most recent release of AutoCAD (Autodesk 2000). Since 1990 the department has specified the layering conventions required for all drawing submissions and has steadily increased the project managers’ responsibility to assure provision of drawings that meet these standards. The drawings are retained in an inventory for future reference and to be applied to computer-aided design drafting or CADD master (base building) plan files.
In the past five years PWGSC has also been very actively using the MERX internet-enabled electronic tendering service to respond to an ever-increasing demand for an array of goods, services and construction needs (MERX 2000).
3.3 Phase 5 Applications - Operation
Once a facility has been brought to ‘in-service’ mode, the changes in its physical condition and performance are monitored. Inspections, of varying detail, are conducted on a scheduled periodic basis and the findings of these inspections are embodied in Building Condition Reports (BCRs). These BCRs are then used to map the repair, rehabilitation and reinvestment scenarios that are likely for the asset and the findings are transferred to the Asset Management Plans (AMPs). These assessment and planning tools are currently only being applied as paper, or textual, documents and efforts are underway to computerize the
processes; providing a higher degree of standardization to the condition assessment as well as the decision framework.
One of the primary responsibilities of PWGSC is to provide office accommodation and services to the Canadian public service. This role requires a dynamic knowledge of the clients’ spatial needs as well as an understanding of the facility stock’s office occupant capacity. The Facility Inventory System (FIS) is a legacy computer program currently running on a mainframe, which is used to record and monitor:
• the rentable and general usage areas within the facility,
• which buildings and floors are occupied by which client departments,
• the tenants’ space needs,
• the amount of space occupied and by whom,
• the amount of space for which the tenants pay rent, and
• projections of future requirements.
Key to maintaining this database is the work of the PWGSC Space Measurement Teams; tasked with the as-required re-measurement of the PWGSC facility asset base and providing updated measurement data for reentry into the FIS. The primary tool used for the recording of the space measurement information is the TECH2 program (Microlight Graphics 2000).
PWGSC’s Spatial Information Management (SIM) encompasses a number of systems and maintains both the CADD file inventory for projects and the CADD master files, described earlier. As mentioned previously, the drawings of newly-built or modified facilities are included in these inventories, as a matter of process. The CADD files are stored and retrieved as required from password-protected FTP sites. The departmental standard CADD drawing format is AutoCAD native format with DWG file extension. In addition, SIM is using geographic information systems (GIS) to manage information on the location and boundaries of parcels of land. SIM also uses many modules from Archibus-CAFM (Archibus 2000) and makes modification to some of these to satisfy problems linked to unique aspects of the PWGSC operational framework.
PWGSC’s Financial Management System (FMS) is another legacy system currently running on mainframes. The system permits the tracking of expenditures relative to an asset’s inventory number, rolling-up to the portfolio, regional and national levels. Historically, this system has not provided adequate detail to be used efficiently for project level financial assessment.
In the mid-90’s the Project Billing and Management System (PBMS), an Oracle-based application (Oracle 2000), was unfolded as the future replacement of the FMS. This program tracks the labour, disbursements and materiel procurement costs, offers basic scheduling tasks and permits both detailed and rollup reporting. As well, at an early stage of projects, the PBMS obliges project managers to complete the Environmental Assessment Framework checklist; this function is provided with automatic linking to a PWGSC Intranet site devoted to the checklists. Environmental audits of the PWGSC facility inventory are conducted on a regular, cyclic basis using the Canadian BREEAM framework and reports and rollups are provided by transferring the score card information to various spreadsheet applications and finally to an Approach (Lotus 2000) database file.
Computerized maintenance management systems (CMMS) provide the capability to schedule, monitor and track all resource information (i.e. labour, material, cost, and time) required for maintenance activities as well as to generate up-to-date condition information. The ease of input of base building data and prescribed maintenance procedures is essential to
the successful application of these systems. In the mid-1980’s PWGSC developed Preventative Maintenance Support System (PMSS), a DOS-based (Clipper/dBase 4) CMMS that satisfied the majority of the required capabilities (dBase 2000). The PMSS did not readily allow for tombstone data entry, it had a mixed acceptance from PWGSC regional offices and it did not become part of the national policy for maintenance management procedures. PWGSC has recently adopted SPAN-FM (Peregrine 2000) as the department standard for CMMS. The 32-bit Oracle-based application permits integration of CADD drawings, scanned images and standard maintenance procedures. As part of the SPAN-FM acquisition contract, the existing data from the PMSS will be migrated to SPAN-FM.
Some of the facilities under PWGSC’s control are managed by a company contracted to operate and maintain the facilities. The current contractor uses another CMMS package, namely MAXIMO (PSDI 2000). It is not known, at this time, the level of interoperability between the SPAN-FM and MAXIMO.
As part of a proactive energy management philosophy, the regions of PWGSC closely monitor the energy consumption of their buildings as well as tracking tendencies at a regional level. There is not a department-wide standardized tool to conduct these collections and assessments and, as a result, various energy accounting systems (EASs) are used. These systems vary from being little more than spreadsheet applications through to the propriety software from energy providers or hardware and instrumentation companies.
The Occupancy Instrument System (OIS) manages the leases and other agreements with client departments of PWGSC. It is a standalone database that receives its information from the FIS, but forms a critical part of the PWGSC knowledge repository.
TIDIS is a document management system that allows the capture of all types on digitized data in one central repository. This provides the opportunity to store both structured and unstructured data in one location.
3.4 Phase 6 Applications - Evaluation
Condition and performance data from the facilities that are operated and maintained by contractors, as Alternate Forms of Delivery or AFDs, are provided to PWGSC on a monthly basis. These data, referred to as the data-bin, is delivered to PWGSC on multiple CDs, then parsed into usable fields into an assortment of existing applications. The changes to identified performance criteria are tracked and used to evaluate the level of service provided by the contractor. This information is, in-turn, used as a basis for payment and bonus for the contractor.
Planning Definition Implementation Commissioning Operations Evaluation Databases PDS Phases Desired Existing Applications DATA FLOW Legend:
Knowledge Repository (Databases, electronic files, hardcopy documents, other media, etc.)
In-service Deconstruction SPEC ACCORD BREEAM MERX AutoCAD Energy Analysis BCR TECH2 GIS AMP PBMS Energy Audit TIDIS FMS FIS PMSS CAFM MAXIMO EAF Manual PBMS SPAN-FM Electronic OIS
Figure 3: Data flow diagram for PWGSC software applications
3.5 Data Requirements of Asset Managers
The above description of applications in a large organization with significant depth and breadth of assets is probably typical of similar large organizations. Therefore it can be easily seen that asset management requires the complete integration of data collected over decades of time from a plethora of software applications and digital data, not to mention hard copy systems. In order to attain comprehensive data systems for asset managers, the following four data requirements have been gleaned from discussions and observations amongst the authors:
(1) development and maintenance of data to satisfy needs of decision support tools, (2) development and standardization of quality metrics for evaluation of performance and
condition;
(3) standardization of data and information flow, and
(4) continuous transfer of data amongst actors in the process. 4 Conceptual Background
The existence, consistency, and accessibility of information discussed throughout the previous section are fundamental to sound decision-making in asset management. The mere amount and strong interdependency of these data indicate the need for powerful and sophisticated information management solutions.
4.1 Heterogeneity of Data in the Asset Management Domain
If one were to step back from the immediate organizational challenges and take a detailed look at the overview of existing and required information, it reveals a whole spectrum of diverse formats and levels of detail. The heterogeneity of data, which puts additional requirements on information management systems, can be observed in terms of the structure of machine-readable data representations. It is possible to distinguish three basic, although not always clearly distinct, categories of information:
(1) Unstructured information encompasses unstructured or barely structured text (e.g. ASCII, tab delimited and a variety of “non-text” information such as bitmap images, video, audio). Its content is meaningful to humans but not to machines, which can only read and
handle such data at the low level of pixels or simple strings or as complete, fixed documents and display it in a single, fixed way. In fact, much of this type of data is still in hardcopy format and in a medium other than digital (e.g. photos, slides, or analogue tape).
(2) Information with structured display includes a variety of primarily textual information such as web pages, structured word-processor documents, or user queries, which are structured according to the HTML specification, a document model (data type definition or DTD), or a particular query syntax. The same category also includes some primarily visual information, for example CAD databases whose underlying schemas involve entities such as lines and shapes but not objects such as doors, columns and roofs. Different displays of such information are possible (e.g. using Cascading Style Sheets for HTML documents or changing layer settings in CADD drawings), but they involve only alternative display properties such as colours, fonts, or line types.
(3) Information with structured content implies machine-readable representation structured according to a certain conceptual schema of a domain (e.g. “smart” CAD drawings, some eXtensible Markup Language or XML documents, and databases). A multitude of essentially different human understandable representations can be derived from a single data set: a schematic 2D drawing, rendered 3D model, process simulation, or textual report, for example. These alternative displays can differ not only in display properties but also in modality (i.e. text vs. graphics vs. audio).
4.2 Standardization Efforts
As in many other domains, the need to minimize data re-entry and to enable horizontal and vertical interoperability has led to the adoption of product modeling and to an industry-wide initiative for the development of a standard domain model. Building upon the more general ISO STandard for the Exchange of Product Model Data (STEP ISO 10303), the Industry Alliance for Interoperability (IAI 2000) is bringing together key industry participants from all around the globe. IAI is developing a standard schema for the architecture, engineering, construction and facilities management (AEC/FM) industries—the Industry Foundation Classes (IFC 2000). An increasing number of software applications already feature IFC support: those developed by Nemetschek, Viatek Oy, Jidea Oy, and NAOKI among asset management software and numerous applications typically used in pre-operational phases. A list of IFC implementers is available at the IAI Nordic Chapter Web site (IAI Nordic 2000).
Another associated standardization effort— aecXML™ is focusing on data exchange over the Internet (aecXML 2000). The AEC/FM industries have acknowledged the importance of Internet-based communication for a domain relying on information from disparate sources and the potential of the eXtensible Markup Language (XML) standard (XML 2000). AecXML™ represents a framework for using XML for electronic communications in the domain.
4.3 Advantages and Limitations of Standard Data Models
The use of a standard data model enables communication between diverse applications as well as re-use of data entered by any participant in any phase of an asset’s service life; thus ensuring data consistency and heightening reproducibility of analysis and assessment results.
However, it is becoming increasingly clear that the use of a standard data model is not an omnipotent solution for interoperability. Amor (2000) gives an overview of unresolved issues related to their implementation, some of which may be intractable. Along with dozens of practical and technical issues such as those related to business interests of information
providers, data transport mechanisms, version management etc., there are potentially more serious conceptual questions related to sufficiency, validity and comprehensiveness of data models and mapping between different views. The work described in this paper focuses only on those issues related to heterogeneous information representations.
Even if a model is accepted as an industry-wide standard, there will always be sub-domains, related sub-domains, and applications that are better served by schemas with partly overlapping scopes and structures of their own. In addition to project-generated information discussed in Section 2, data required for the day-to-day operations of asset managers also include a variety of external data such as libraries and regulations as well as the company’s business information (e.g. personnel files, accounting data). It is possible to distinguish three partially overlapping information spaces:
• global information space,
• project information space, and
• company information space.
An important difference between these three spaces is the possible level of control and management of the information contained. While the company information space can be fully controlled (i.e. theoretically all information can be structured in a standard way and be fully interchangeable), the global information space is driven by a variety of unpredictable free market forces and is hardly submissive to a single schema. This is also reflected in the project information space where it can be difficult to bring together all participants in a project using compatible systems and data representations.
Therefore any information system planning in a domain such as asset management should take into account the unavoidable coexistence of multiple schemas, of multiple views within a single schema, of structured, differently structured, and unstructured information, and of document-based and model-based communication.
On the other hand, the use of standard data models has a potential to change applications based on them, to enable qualitatively new types of applications, and thus to change work practices in the domain. A variety of fully interchangeable data in a populated and shared project model or in company’s archives can be used in new combinations, to be analyzed, compared, manipulated to give new insights and generate knowledge. These opportunities have not been sufficiently explored yet, most likely because of the early stages of IFCs implementation and the lack of populated models.
5. Proposed Framework for Data Management in the Asset Management Domain The development of the framework for data management in the asset management domain starts from the assumption that Internet-based communication, distributed systems, and efforts on the development of IFCs and XML will continue into the foreseeable future. The proposed framework is presented here through a description and analysis of a prototype tool developed to demonstrate, test, and further explore the use and display of data for decision support tools for asset management. The goal of the work is to define a user-centered information architecture for asset management and hence the presentation layer represents the focus and the starting point.
5.1 BELCAM Visualizer
BELCAM Visualizer is a prototype application that allows a user to ask the six “Whats” discussed in Section 2.3 and visually presents the answers. It is implemented in Visual Basic
for Applications (VBA) from Microsoft Excel and uses Microsoft’s Automation for integrating data entered and generated within different applications.
The business layer consists of formulae for the probabilistic prediction of system performance, the assessment of risk and cost, and procedures for the multi-objective optimization of maintenance activities. These elements were developed within the Building Envelope Life Cycle Asset Management (BELCAM) project (Lounis et al, 1998), a joint endeavour of the Institute for Research in Construction - National Research Council Canada and PWGSC. BELCAM is a three-year research and development project to investigate the integration of asset management technologies, namely: maintenance management, life cycle economics, service life prediction, and risk analysis. For the initial stage of BELCAM, work was concentrated on “low slope” roofing systems as a “proof of concept” and therefore the prototype application operates only with data related to low slope roofs. Data required for Visualizer to function include:
• Visual representation (map) of the inventory,
• Stored data about the inventory (mostly alphanumerical),
• External data (e.g. current maintenance costs), and
• User input.
The user interacts with the tool according to the following scenario:
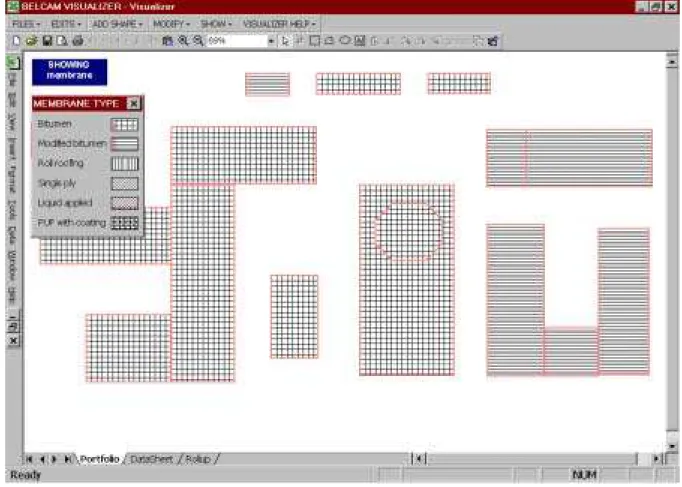
• The user either imports a drawing of the building from any drawing software supporting Automation or creates a building outline in Visualizer using MS Office AutoShapes, typically over an imported raster map, as shown by the building shapes in Figure 4. Precise spatial information, that is—the exact location of buildings, is not vital for the application as maps serve only for visualization purposes and therefore simple rough sketches can be used.
• The user imports required data about the buildings, roofs, and roof sections from MicroROOFER (or potentially any other correspondingly structured database). MicroROOFER is an EMS for low-slope roofing systems from the US Army Corps of Engineers (Bailey et al, 1990) running under MS Access. It has been used primarily as a data collection tool within the BELCAM project.
• The user then draws polygons (red line drawings in Figure 4) representing discrete roof sections on the map and associates these polygons with the roof sections from the corresponding database record.
• After these actions are completed, all data from the database can be visualized, i.e. properties of an object can be translated into the graphical language and represented as properties (colour, hatching pattern, line type etc.) of that object’s surrogate (i.e. shape). The hatching patterns for various types of roofing membranes are illustrated in Figure 4. It is also possible to display two or more properties at the same time (overlay) and to interact with data by directly selecting an object.
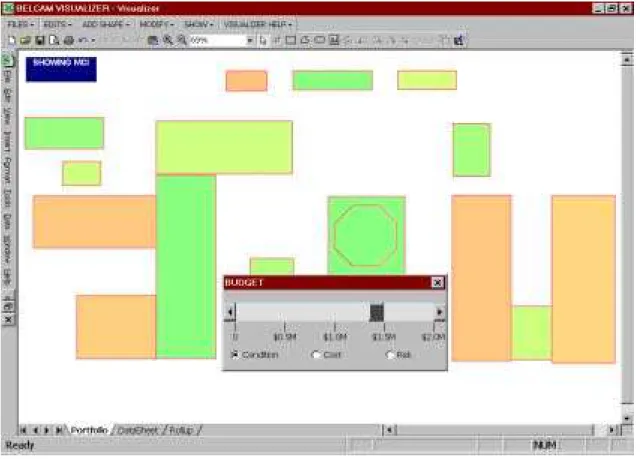
• In addition to displaying the existing data (condition), following user’s input regarding the geographic region, preferences, priorities, etc., the application also allows display of application-generated data, such as risk and cost, as shown in Figures 5 and 6. The tools within the business layer permit visualization of various “what-if” scenarios: change of inventory condition or other properties over time with varying maintenance strategies, as illustrated in Figures 5 and 6.
Figure 4: Screen capture from Visualizer showing plan view of roof sections and attributes
Figure 6: Visualizer showing life cycle cost of repairs of roof sections based on failure state and level of desired maintenance
5.2 Discussion on Visualizer
In this section observations made during the development and testing of BELCAM Visualizer are discussed, particularly in the light of the previously stated assumptions about the future of data communication in the domain. These observations were not scientifically tested, measured, and verified at this stage but should serve as starting guidelines for the future research and development.
General observations:
• Visualization of natively non-visual data for large asset inventories can be a highly useful cognitive aid for grasping the overwhelming amount of information required for decision making in asset management.
• Visualization tools can easily be developed where conceptually structured information is available. Data internally represented in terms of objects or entities defined by sets of attributes or properties and their values can always be displayed in a variety of ways with entity surrogates (representations) and their attributes serving as carriers of information about the entities.
• Basic visualization and analysis techniques have already been developed within GIS and these types of visualization should be extracted, adapted and incorporated into asset management tools.
Implementation:
• Visualization or display translation can be implemented as a service that can form part of many diverse applications, on both clients and data servers (Froese et al. 2000). Along with information about objects, their properties and property values, the data layer needs to expose information about data type and data range for each of the properties, while the presentation layer needs to make available information about its expressive vocabulary. This vocabulary need not be limited to colours and hatching patterns, not even to graphic properties; it can also involve time, speed, loudness, or pitch, for example. Upon the availability of this data, a thesaurus service can perform mapping with any desired level of user intervention and generate an alternative display along with the legend. Such a service can function no matter how close or remote the two layers are, as long as communication between them is ensured.
Opportunities with model-based systems:
• An important feature of information management tools is the ability to work at a varying level of detail; this is one of the most important techniques in GIS, usually called—generalization. As a domain schema identifies generic and hierarchical relationships between concepts it can be used as a possible tool for facilitating navigation between different levels of detail.
• Another GIS technique—information overlay, which is crucial for exploration of interdependencies between data, can also benefit from model-based exchange. The ability to combine and overlay properties from disparate sources depends on the availability of such data in the common format.
• Visualizer was easy to implement thanks to the power of Microsoft’s Automation. However, most pieces of data required several translations—in addition to translation between different modes (alphanumerical to graphic), one human-readable text string often needed a translation for each application (e.g. elimination of white spaces or particular special characters). This requirement coupled with the need to enable navigation between different levels of detail resulted in a number of mapping tables and lines of code that might be avoided with the use of standard data models.
• The weakest point in the application is the need to associate shapes with database records—it requires user’s effort and the need for solutions related to data updating and consistency. This need can be eliminated in model-based systems or by using integrated CAD databases.
• Model-based systems would also allow generically different representations of entities themselves (e.g. 3D models or a variety of symbolic representations) thereby providing a much richer vocabulary for translations.
Desired enhancements
• A useful additional feature, actually vital for decision-making in asset management, is the possibility to relate/link external, unstructured and differently structured information from a variety of sources, such as the World Wide Web to project-generated information. For example, linking infrared images of roofs with a library of typical roofing defects, or to manufacturers’ information about products. A possible tool for this task would be a domain schema enriched by synonyms. This solution has implications for all storage, retrieval, and display of data and requires a separate, although related line of research (Kosovac et al 2000).
5.3 Implications for Further Research
One of the goals of the research is to develop a graphical user interface that would allow direct interaction with all project-related information. At the same time, the interface would have to:
• Maximize access to data,
• Optimize display, and
• Minimize storage space, more precisely, repetition of same information and the accompanying risk for errors and inconsistencies.
Further steps towards attaining this goal are as follows:
• Re-examine what data should be archived, referenced, or discarded at the commissioning of a facility in an Internet-based, distributed environment.
• Support and/or contribute to the further development, implementation, and acceptance of the IFCs, aecXML, XML, and related standards.
• Develop thesaurus-like aids based on the domain model, organized into facets, and enriched with equivalency relationships (synonyms, symbols, and other alternative representations).
• Design generic translation services.
• Investigate the potential of the aids and services for both enhancing information retrieval and facilitating translation into alternative displays.
• Implement the aids and services transparently in user interfaces allowing alternative access structures to project information including but not limited to a 3D geometric representation of the facility.
6. Conclusions
Standardized domain models are undoubtedly a rudimentary answer to the efficient data management in an information-wise complex domain such as asset management. However, these models should be developed, advocated, and used with the awareness that no schema can cover an entire domain in full detail, or from each and every viewpoint, and that there will always be data and processes that are not submissible to it. On the other hand, standard models should be considered not only as tools to enhance existing systems but also as an opportunity to redefine data use in the domain.
The authors believe that thesaurus-like aids and translation services can be used both as a possible remedy for the inherent deficiencies of standard models by allowing association of related unstructured and differently structured information to a project model and as a means to exploit the potential of populated project models by allowing qualitatively new combinations and views of data (Kosovac et al 2000).
The paper stresses the importance of formalized information storage, updating and integration in the domain of “Service Life Asset Management”. The key aspects of information storage and flow in this domain, identified in this paper, are: (1) the data needs for decision support tools, (2) the development of quality metrics for evaluation of performance and condition; (3) the need for standardization of data and information flow, and (4) the need for continuous data transfer amongst actors in the process. The authors also identify the need for continued research and standardization in all these domains. This paper is exploratory in nature and encourages the reader to visualize what data are required for “Service Life Asset Management” and how those data can be used.
7. References
aecXML. (2000) aecXML Home Page, <www.aecxml.org/index2.htm> (3 Oct. 2000). Archibus. (2000) Archibus Home Page <www.archibus.com> (3 Oct. 2000).
Autodesk. (2000) Autodesk Home Page <www.autodesk.com> (3 Oct. 2000).
Bailey, D.M., Brotherson, D.E., Tobiasson, W. and Knehans, A. (1989) ROOFER: An
Engineered Management System for Bituminous Built-Up Roofs, Technical Report M-90/04/ ADA218529, US Army Construction Engineering Research Laboratory, Champaign, Ill.
BLAST. (2000) BLAST Fact Sheet <owww.cecer.army.mil/facts/sheets/cf-6.pdf> (3 Oct. 2000).
BREEAM. (2000) British Research Establishment Environmental Assessment Method Home
Page, <products.bre.co.uk/breeam/default.html> (3 Oct. 2000).
Burns, P. (1990) Asset Management - A Global View, Building Asset Management (Don’t
Wait Until 2000), Building Science Forum of Australia, Randwick Racecourse, NSW, Australia, Jul. 25, pp. 1-15.
CSA. (1987) CAN/CSA-B78.5-M87: Computer-Aided Design Drafting (Building), Canadian Standards Association, Rexdale, ON., 89p.
CSA. (1995) CSA S478-1995: Guidelines on Durability in Buildings, Canadian Standards Association, Rexdale, ON, 93p.
dBase. (2000) dBase Home Page <www.dbase.com> (3 Oct. 2000). DOE2. (2000) DOE2 Home Page <www.doe2.com> (3 Oct. 2000).
Froese, T., K. Yu, K. Liston, and M. Fischer (2000). "System Architectures For AEC Interoperability", Construction Information Technology 2000, Proceedings of CIT
2000 - The CIB-W78, IABSE, EG-SEA-AI International Conference on Construction Information Technology, Reykjavik, Iceland, 28-30 June, 2000, G. Gudnason (Ed.), Icelandic Building Research Institute. Vol. 1, pp. 362-373.
IAI Nordic. (2000) IAI Nordic Implementation <cic.vtt.fi/niai/implementation (3 Oct. 2000). IAI. (2000) IAI Home Page<iaiweb.lbl.gov> (3 Oct. 2000).
IFC. (2000) IAI UK Chapter <cig.bre.co.uk/iai_uk> (3 Oct. 2000).
Kosovac, B., T.M. Froese, and D.J. Vanier (2000). "Integrating Heterogeneous Data Representations In Model-Based AEC/FM Systems", Construction Information
Technology 2000, Proceedings of CIT 2000 - The CIB-W78, IABSE, EG-SEA-AI International Conference on Construction Information Technology, Reykjavik, Iceland, 28-30 June, 2000, G. Gudnason (Ed.), Icelandic Building Research Institute. Vol. 2, pp 556-567.
Lotus. (2000) Approach Home Page, <www.lotus.com/home.nsf/welcome/approach> (3 Oct. 2000).
Lounis Z., Vanier D.J., Lacasse M.A, and Kyle B.R. (1998) “Effective Decision-Making Tools for Roofing Maintenance Management”, First International Conference on New Information Technologies in Civil Engineering, Montreal, Oct., 425-436
<www.nrc.ca/irc/fulltext/nrcc42831.pdf> (3 Oct. 2000).
MERX. (2000) MERX Home Page, <www.merx.cebra.com> (3 Oct. 2000).
Microlight Graphics. (2000) TECH2 Home page <www.microlightgraphics.com> (3 Oct. 2000).
NACUBO. (1990) Managing the Facilities Portfolio, National Association of College and University Business Officers, Washington, DC, 100p.
Oracle. (2000) Oracle Home Page <www.oracle.com> (3 Oct. 2000).
Peregrine. (2000) < http://www.peregrine.com/spanfm/products.htm >(3 Oct. 2000). PSDI. (2000) PDSI Home Page<www.psdi.com> (3 Oct. 2000).
PWC. (1978) Design and Construction Technical Computing Survey, Public Works and Government Services Canada, Ottawa, Ontario, Canada, 128p.
PWC. (1989) Project Delivery System, Public Works and Government Services Canada, Ottawa, Ontario, Canada, 16p.
Sarshar, M. (2000) “Process Modelling in the Facilities Sector: A case Study”, Construction
Information Technology 2000, Reykjavik, Iceland, Jun., pp. 801-812
Shahin, M.Y. (1992) “20 Years Experience in the PAVER Pavement Management System: Development and Implementation", Pavement Management Implementation, F.B. Holt and W.L. Gramling, editors, ASTM, Philadelphia, Pa.
STEP ISO 10303. (2000) ISO Fact Sheet <www.iso.ch/cate/d20579.html> (3 Oct. 2000). Vanier, D.J. (2001) “Why industry needs asset management tools”, To be published in
Special Issue on Information Technology for Life-Cycle Infrastructure Management,
Journal of Computers in Civil Engineering, To be published Jan 2001, ASCE, Washington, D.C.
WHMIS. (2000) WHMIS Home Page < WHMIS. (2000) WHMIS Home Page <www.ccohs.ca/oshanswers/legisl/intro_whmis.html> (3 Oct. 2000). XML. (2000) XML Home Page, <www.w3.org/TR/REC-xml> (3 Oct. 2000).
Yu K., Froese T., and Grobler, F. (2000) A development framework for data models for computer-integrated facilities management, Automation in Construction, 9, pp.145-167.