HAL Id: hal-02891737
https://hal.archives-ouvertes.fr/hal-02891737
Submitted on 7 Jul 2020
HAL is a multi-disciplinary open access
archive for the deposit and dissemination of
sci-entific research documents, whether they are
pub-lished or not. The documents may come from
teaching and research institutions in France or
abroad, or from public or private research centers.
L’archive ouverte pluridisciplinaire HAL, est
destinée au dépôt et à la diffusion de documents
scientifiques de niveau recherche, publiés ou non,
émanant des établissements d’enseignement et de
recherche français ou étrangers, des laboratoires
publics ou privés.
A convolutional neural network for 250-MHz
quantitative acoustic-microscopy resolution enhancement
Jonathan Mamou, Thomas Pellegrini, Denis Kouamé, Adrian Basarab
To cite this version:
Jonathan Mamou, Thomas Pellegrini, Denis Kouamé, Adrian Basarab. A convolutional neural
net-work for 250-MHz quantitative acoustic-microscopy resolution enhancement. 41st IEEE Annual
In-ternational Conference on Engineering in Medicine and Biology (EMBC 2019), Jul 2019, Berlin,
Germany. pp.6212-6215, �10.1109/EMBC.2019.8857865�. �hal-02891737�
Official URL
https://doi.org/10.1109/EMBC.2019.8857865
Any correspondence concerning this service should be sent
to the repository administrator:
[email protected]
This is an author’s version published in:
http://oatao.univ-toulouse.fr/26198
Open Archive Toulouse Archive Ouverte
OATAO is an open access repository that collects the work of Toulouse
researchers and makes it freely available over the web where possible
To cite this version: Mamou, Jonathan and Pellegrini, Thomas and
Kouamé, Denis and Basarab, Adrian A convolutional neural network for
250-MHz quantitative acoustic-microscopy resolution enhancement.
(2019) In: 41st IEEE Annual International Conference on Engineering
in Medicine and Biology (EMBC 2019), 23 July 2019 - 27 July 2019
(Berlin, Germany).
A Convolutional Neural Network for 250-MHz Quantitative
Acoustic-microscopy Resolution Enhancement
Jonathan Mamou1, Thomas Pellegrini2, Denis Kouam´e2, Adrian Basarab2
1
Lizzi Center for Biomedical Engineering, Riverside Research, New York, NY, USA
2
University of Toulouse, IRIT, CNRS UMR 5505, Universit´e Paul Sabatier, INP-ENSEEIHT, Toulouse, France {jmamou}@riversideresearch.org, {pellegri, kouame, basarab}@irit.fr
ABSTRACT
Quantitative acoustic microscopy (QAM) permits the formation of quantitative two-dimensional (2D) maps of acoustic and me-chanical properties of soft tissues at microscopic resolution. The 2D maps formed using our custom SAM systems employing a 250-MHz and a 500-MHz single-element transducer have a nom-inal resolution of 7 µm and 4µm, respectively. In a previous study, the potential of single-image super-resolution (SR) im-age post-processing to enhance the spatial resolution of 2D SAM maps was demonstrated using a forward model accounting for blur, decimation, and noise. However, results obtained when the SR method was applied to soft tissue data were not entirely satisfactory because of the limitation of the convolution model considered and by the difficulty of estimating the system point spread function and designing the appropriate regularization term. Therefore, in this study, a machine learning approach based on convolutional neural networks was implemented. For training, data acquired on the same samples at 250 and 500 MHz were used. The resulting trained network was tested on 2D impedance maps (2DZMs) of human lymph nodes acquired from breast-cancer patients. Visual inspection of the reconstructed enhanced 2DZMs were found similar to the 2DZMs obtained at 500 MHz which were used as ground truth. In addition, the en-hanced250-MHz 2DZMs obtained from the proposed method yielded better peak signal to noise ratio and normalized mean square error than those obtained with the previous SR method. This improvement was also demonstrated by the statistical anal-yses. This pioneering work could significantly reduce challenges and costs associated with current very high-frequency SAM sys-tems while providing enhanced spatial resolution.
1. INTRODUCTION
Quantitative acoustic microscopy (QAM) uses very high frequency ultrasound (> 100 MHz) to form quantitative, two-dimensional (2D) maps of acoustic and mechanical properties of soft tissues at reso-lutions better than 10 µm [1]. SAM systems use a single-element transducer and the spatial resolution of the resulting 2D maps is ap-proximately equal to the wavelength at the center frequency of the transducer. For instance, our custom SAM systems, which employ a250-MHz [2] or a 500-MHz [3] single-element transducer, the re-sulting 2D acoustic impedance (Z) maps (2DZMs) have a nominal in plane spacial resolution of 7 µm, and 4µm, respectively. Nev-ertheless, the design and use of the 500-MHz system is challeng-ing. Therefore, while increasing the transducer frequency improves resolution, it often comes with increased costs associated with the
transducer and the necessary electronics (i.e., pulser, amplifier, A/D conversion, precise motor stages). In addition, experimental difficul-ties also arise (e.g., sensitivity to nm scale vibrations and tempera-ture). Therefore, in a previous study, the potential of single-image super-resolution (SR) reconstruction to enhance 2DZM resolution obtained using our250-MHz SAM system was investigated [4]. The forward image degradation model in [4] linked the non-observed high-resolution (HR) image to the250-MHz 2D impedance map (2DZM) through two operators (2D convolution with the imaging system point spread function (PSF) and spatial subsampling) and ad-ditive white Gaussian noise. To invert this model, a reconstruction-based approach was used by minimizing the HR image total vari-ation, i.e., assuming it is piece-wise constant [5]. While encour-aging results were obtained in [4] on simulated and experimental phantom data, results were less satisfactory, when the SR method was applied to experimental data acquired from soft tissues. This outcome can be explained by several factors. First, the considered image formation model (e.g., spatially-invariant PSF) may not be sufficient to explain the complex physical phenomena occurring in QAM. Second, the parameters of the model (e.g., the PSF and the noise variance), known in simulations, must be estimated in prac-tical situations increasing drasprac-tically the complexity of the inverse problem. Finally, the data-independent regularization function (e.g., total variation) strongly influences the results and making an appro-priate choice is challenging. Therefore, in the present study, a deep learning based approach is proposed to improve the flexibility relat-ing the low-resolution 2DZMs to their high-resolution counterpart by learning their relationship from training data instead of imposing a predefined model. Specifically, a U-Net like convolutional neural network (CNN) was trained to learn the relationship between250 and500-MHz 2DZMs in order to enhance 250-MHz previously un-seen 2DZMs at test time. This kind of architecture has gained popu-larity in recent years, in particular in the fields of biomedical image segmentation [6] and image SR [7]. The objective of this study is to adapt and test this CNN for SAM, which, to the best of our knowl-edge, is the first attempt of using machine learning in 2D acoustic map reconstruction from SAM data.
2. MATERIAL AND METHODS
2.1. Experimental SAM data
Experimental data were acquired at 250-MHz and 500-MHz from the same areas of 6-µm thick sections of cancerous human lymph nodes. (The protocol was approved by the Internal Review Board of Kuakini Medical Center in Honolulu, HI, where the samples
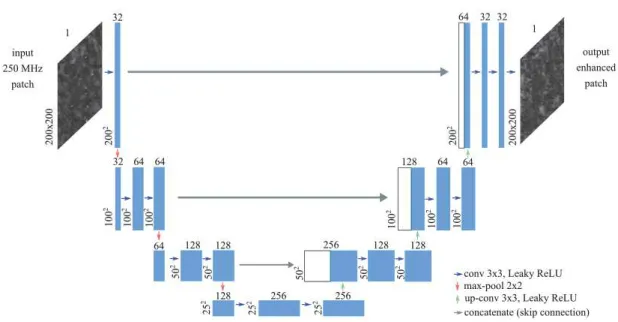
Fig. 1. U-net architecture. The colored arrows represent different layer operations: convolution (conv) and transposed convolutions (up-conv), max-pooling and concatenation (skip connections, in grey). The numbers on top of the rectangles denote the numbers of channels or activation maps, and width/height dimensions are indicated vertically on each map block.
were prepared.) Briefly, the ultrasound transducer performed a two-dimensional raster scan of the sample. Data were first collected using the 500-MHz transducer with 1-µm steps immediately fol-lowed by the 250-MHz transducer with 2-µm steps. At each scan location from both scans, an RF signal is digitized with 12-bit accu-racy at 2.5 GHz [2, 3]. The two 3D block of RF data (2D vs time) are then processed using an auto-regressive algorithm [8] to yield 2D maps of impedance, speed of sound, and acoustic attenuation. In total, QAM data were acquired at both frequencies from15 samples of an average area of approximately2 by 2 mm. Without loss of generality, we focused in this study, both within the training and testing phases, on 2DZMs.
2.2. U-net convolutional neural network
U-nets are a special type of fully convolutional neural networks (CNN) that have two particularities: their architecture is symmetric and they include skip connections. U-nets are encoder-decoder-like networks: an input image is processed through a number of stacked convolution-pooling blocks to obtain a new data repre-sentation (i.e, encoder or contracting/downsampling path) that is then processed by transposed convolution blocks (the decoder or expanding/upsampling path).
The specific U-net architecture used in the present study is de-picted in Figure 1. The encoder is composed of four successive con-volution (3 × 3 filters, [32, 64, 128, 256] maps, respectively) and downsampling layers (2 × 2 max-pooling). The output of these lay-ers is of dimension25 × 25 × 256 (see bottom of Fig. 1). The de-coder part of the model is symmetric except that transposed convolu-tion layers are used to upsample the activaconvolu-tion maps to progressively obtain the same dimensions as the input patch. These upsampling convolutions are depicted as vertical green arrays in Fig 1. Blue horizontal arrows represent standard convolution layers. The grey arrows indicate the skip connections, i.e., the activations of the same-level encoder layers (left part) are concatenated to the current
acti-vations before being processed by two conv-pooling layers at each level. The final network output is of the same dimension as the in-put patch. (All the convolution layers use the leaky Rectifier Linear Unit (leaky-ReLU) activation function: f(x) = max(αx, x) with α= 0.01 [9].)
The skip connections intend to provide local information to the global information during upsampling [6]. The U-net design was chosen for its efficiency in image segmentation and image SR due to these skip connections: first, these connections enable passing low-level details to deeper layers, second, they facilitate the training process by back-propagating the gradients more easily through the entire network. Furthermore, such a network can be trained end-to-end from a limited amount of images and was shown to outperform standard CNNs without skip connections. For instance, U-nets were used by the winners of the 2015 ISBI challenge for segmentation of neuronal structures in electron microscopic stacks [6]. (The Tensor-flow deep learning library1was used to run the U-net experiments.)
Training: A set of approximately5600 200 × 200-pixel (i.e., 0.4 by 0.4 mm) patches were generated from thirteen 250 MHz 2DZMs together with the ground-truth patches from the correspond-ing coregistered 500 MHz 2DZMs. To do so, a 10% (20 pixels) overlap was used to extract patches. Training mini-batches were made of eight patches drawn randomly from the training set. A smooth absolute error function (ℓ1smooth loss) was used, because
it is less sensitive to outliers than ℓ2or standard ℓ1losses, and also
prevents exploding gradients. The learning rate adaptive optimizer Adam was used with a starting learning rate of1e−4 [10]. The total training time on a 1080 Ti NVidia GPU was 40 hours to perform 105
steps (number of processed mini-batches). No development subset was used so that no specific learning termination criterion was applied except that of the total number of steps. Several values were tested and no further gain was observed for longer duration. Due to the limited amount of experimental data in this initial study,
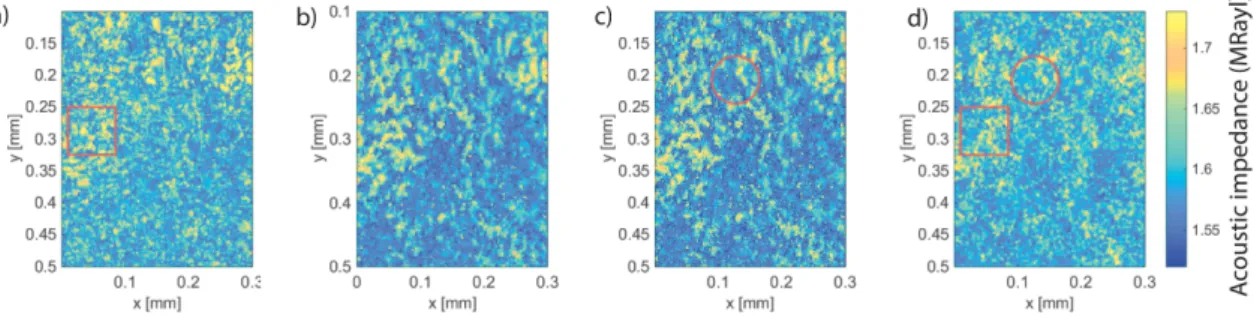
Fig. 2. Illustrative 2DZMs: a) Original at 500-MHz , b) Original at 250-MHz, c) SR approach applied to b), d) proposed machine-learning approach applied to b).
Fig. 3. Zoomed-in Fig. 2 from the white rectangle in Fig. 2a.
a leave-one-out learning procedure (i.e., where a single full 2DZM is left apart for testing) was used.
Testing: At test time, in order to reconstruct an entire enchanced 2DZMs instead of a 0.4 by 0.4 mm patch, overlapping patches (this time 50% overlap, equivalent to 100 pixels) were processed through the network and output patches were concatenated to form the final enhanced entire 2DZM.
2.3. Performance quantification
In addition to qualitative visual comparison between enhanced 2DZMs and corresponding 500-MHZ 2DZMs, the results were also quantitatively analyzed using two standard metrics: the normalized root mean square error (NRMSE) and the peak signal-to-noise ratio (PSNR) defined as follows: NRMSE= s kx − ˆxk2 kxk2 , PSNR= 10 log10 Nhmax(x) 2 kx − ˆxk2 , where the vectors x and ˆx are the 2DZMs reconstructed from data acquired at500 MHz and the one obtained by postprocessing using either the proposed machine-learning based method or the previous SR approach in [4], respectively. Note that all the parameters of the method in [4] (e.g., PSF, balance between total variation and data fidelity terms) were manually tuned to optimize the NRMSE and the PSNR. The statistical distribution of the images were also evaluated through first and second order statistics and Rayleigh fitting.
3. RESULTS
Figures 2a and 2b display illustrative 2DZMs of a section obtained from a lymph node of a breast-cancer patient using the 500-MHz
SAM system and the 250-MHz SAM system, respectively. Figures 2c and 2d show the resulting 2DZMs obtained using the previous SR method and the proposed method applied to Fig. 2b, respectively. These 2DZMs were not part of the CNN training subset and left out for testing purposes. For further visual inspection at finer scales, Figure 3 displays the zoomed in region (white rectangle) of Fig. 2 in the same format.
Visual inspection of Fig. 2c and 2d reveals novel fine details not previously seen in Fig. 2b, but the spatial resolution improvement seems far better in Fig. 2d obtained with the methods presented herein. See for example, the area within the small red circle where more detailed structures are visible, in particular in the background (i.e., low Z) regions and also in the high Z values regions as expected from better resolution images.
These observations are also confirmed by the comparison of Fig. 2c and 2d with Fig. 2a which also reveals the superiority of the proposed approach. Specifically, Fig. 2d is more similar to Fig. 2a. For example, the area within the red squares are similar even though the 500-MHz 2DZMs contains a lot of fine structures.
Another striking feature of the proposed method is its poten-tial ability to properly account for dispersion. Physics predict that speed of sound and therefore Z is a slightly increasing function of frequency. Dispersion is likely responsible for the slightly larger Z values obtained at 500 MHz (Fig. 2a) compared to those obtained at 250 MHz (Fig. 2b). The previous SR approach is completely in-capable of taking that phenomenon into account because it was not integrated in its model, whereas in the proposed approach the net-work was able to learn and account for dispersion on its own. This finding is even more visible in Fig. 4 which shows the estimated probability density functions (PDFs) of Z for all the 2DZMs of Fig. 4. The peak of the PDFs are nearly identical of the enhanced 2DZM and the 500-MHz 2DZM. They are also nearly identical for the SR 2DZM and the 250-MHz 2DZM.These observations are consistent
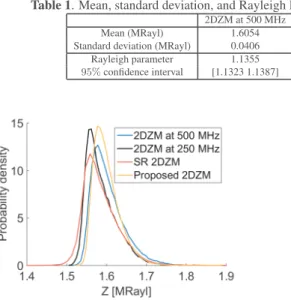
Table 1. Mean, standard deviation, and Rayleigh PDF fit obtained on the PDF of the four 2DZMs of Fig. 3.
2DZM at 500 MHz 2DZM at 250 MHz SR 2DZM Proposed 2DZM Mean (MRayl) 1.6054 1.5889 1.5889 1.6021 Standard deviation (MRayl) 0.0406 0.0391 0.0449 0.0329 Rayleigh parameter 1.1355 1.1238 1.1240 1.1331 95% confidence interval [1.1323 1.1387] [1.1207 1.1270] [1.1208 1.1272] [1.1299 1.1363]
Fig. 4. Estimated probability density functions of Z for all four 2DZMs of Fig. 3
with the first row of Table 1 displaying the actual mean of the four PDFs.
Overall, all the above findings are also confirmed by the com-puted metrics. The SR approach, in spite of its ability of producing a sharper 2DZM than the native250-MHz 2DZM, produced worst PSNR and NRMSE values than the original 2DZM, as shown in Table 2. This may be explained by the fact that the model con-sidered (decimation, convolution and Gaussian noise) is not suffi-cient to explain the entire quality gap between the250 and 500-MHz 2DZMs. Learning this model from the data, as proposed in this study through a convolutional neural network, allows to improve the PSNR and the NRMSE and to get closer to the high-resolution (500-MHz) 2DZMs than the native low-resolution (250-MHz) 2DZM. More-over, although not perfectly matched, the PDFs of the 2DZMs shown in Fig. 4d demonstrate that the statistical properties of the proposed 2DZM image are closer to that of the 2DZM at500 MHz than those of the SR 2DZM and the native 2DZM at 250 MHz. The visual im-pression of the histograms in Fig. 4 is confirmed by computing the maximum likelihood estimate of the Rayleigh distribution parameter and the95% confidence interval of the parameter (Table 1). These results confirm the best statistical matching between the proposed 2DZM and the one computed from the 500-MHz high resolution data.
Table 2. Numerical results on experimental 2DZM data.
2DZM at 250 MHz SR 2DZM Proposed 2DZM NRMSE 0.0297 0.0326 0.0286 PSNR [dB] 32.2296 32.1680 32.5662
4. CONCLUSIONS
SAM can provide invaluable new information about the acoustical and mechanical properties of tissue at microscopic scale. Ultimately, the required spatial resolution is driven by each specific investiga-tion, but the most usual way to reach finer resolution is the use of
a higher center frequency transducer. SAM systems at frequencies greater than 250 MHz are challenging and expensive because pre-cise motor stages are necessary, fast electronics are needed to excite, amplify, and digitize RF signals, vibrations must be mitigated, and temperature control becomes critically important. In this study, a fundamentally different approach was investigated to improve spa-tial resolution of SAM data thereby avoiding aforementioned chal-lenges. Specifically, a machine-learning method based on U-net CNNs was implemented and trained on SAM data acquired from samples scanned using two SAM systems operating at250 and 500-MHz. Results indicated that this approach can provide a significant resolution enhancement as well as take into account complex phys-ical phenomena (e.g., dispersion). The machine-learning method was also found to be superior than a previous SR approach based on the standard model including blurring, decimation and Gaussian noise and using total variation to stabilize the solution. The pro-posed method could revolutionize SAM technology by significantly lowering costs, mitigating experimental challenges, while improving spatial resolution.
5. REFERENCES
[1] R. A. Lemons and C. F. Quate, “Acoustic microscopy: biomedical ap-plications,” Science, vol. 188, no. 4191, pp. 905–11, 1975.
[2] D. Rohrbach, H. O. Lloyd, R. H. Silverman, and J. Mamou, “Fine-resolution maps of acoustic properties at 250 mhz of unstained fixed murine retinal layers,” The Journal of the Acoustical Society of
Amer-ica, vol. 137, no. 5, pp. EL381–EL387, 2015.
[3] D. Rohrbach, A. Jakob, H. Lloyd, S. Tretbar, R. H. Silverman, and J. Mamou, “A novel quantitative 500 mhz acoustic-microscopy system for ophthalmologic tissues,” IEEE Trans Biomed Eng, 2016, in press. [4] A. Basarab, D. Rohrbach, N. Zhao, J. Tourneret, D. Kouam,
and J. Mamou, “Enhancement of 250-mhz quantitative acoustic-microscopy data using a single-image super-resolution method,” in
IEEE International Symposium on Biomedical Imaging, April 2017, pp. 827–830.
[5] N. Zhao, Q. Wei, A. Basarab, N. Dobigeon, D. Kouam´e, and J.-Y. Tourneret, “Fast single image super-resolution using a new analytical solution for ℓ2-ℓ2 problems,” IEEE Trans. Image Process., vol. 25,
no. 8, pp. 3683–3697, 2016.
[6] O. Ronneberger, P. Fischer, and T. Brox, “U-net: Convolutional net-works for biomedical image segmentation,” in International
Confer-ence on Medical image computing and computer-assisted intervention. Springer, 2015, pp. 234–241.
[7] J. Hatvani, A. Horv´ath, J. Michetti, A. Basarab, D. Kouam´e, and M. Gy¨ongy, “Deep learning-based super-resolution applied to dental computed tomography,” IEEE Transactions on Radiation and Plasma
Medical Sciences, 2018.
[8] D. Rohrbach and J. Mamou, “Autoregressive signal processing applied to high-frequency acoustic microscopy of soft tissues,” IEEE
Transac-tions on Ultrasonics, Ferroelectrics, and Frequency Control, 2018, in press.
[9] A. L. Maas, A. Y. Hannun, and A. Y. Ng, “Rectifier nonlinearities im-prove neural network acoustic models,” in Proc. ICML, vol. 30, no. 1, Atlanta, 2013, p. 3.
[10] D. P. Kingma and J. Ba, “Adam: A method for stochastic optimization,”