HAL Id: hal-01194729
https://hal.archives-ouvertes.fr/hal-01194729
Submitted on 10 Jun 2016HAL is a multi-disciplinary open access
archive for the deposit and dissemination of sci-entific research documents, whether they are pub-lished or not. The documents may come from teaching and research institutions in France or abroad, or from public or private research centers.
L’archive ouverte pluridisciplinaire HAL, est destinée au dépôt et à la diffusion de documents scientifiques de niveau recherche, publiés ou non, émanant des établissements d’enseignement et de recherche français ou étrangers, des laboratoires publics ou privés.
TOWARDS A DATA MODEL FOR PLM
APPLICATION IN BIO-MEDICAL IMAGING
Marianne Allanic, Alexandre Durupt, Marc Joliot, Benoit Eynard, Philippe
Boutinaud
To cite this version:
Marianne Allanic, Alexandre Durupt, Marc Joliot, Benoit Eynard, Philippe Boutinaud. TOWARDS A DATA MODEL FOR PLM APPLICATION IN BIO-MEDICAL IMAGING. 10th International Symposium on Tools and Methods of Competitive Engineering (TMCE 2014), May 2014, Budapest, Hungary. pp.365-376. �hal-01194729�
TOWARDS A DATA MODEL FOR PLM APPLICATION IN BIO-MEDICAL IMAGING
Marianne ALLANIC
Department of Mechanical Systems Engineering UMR7337 Roberval CNRS Universit ´e de Technologie de Compi `egne, France
{marianne.allanic,alexandre.durupt,benoit.eynard}@utc.fr
Alexandre DURUPT Marc JOLIOT
Neurofunctional Imaging Group UMR5296 GIN CNRS CEA Universit ´e de Bordeaux, France
{marianne.allanic,marc.joliot}@u-bordeaux2.fr Benoit EYNARD Philippe BOUTINAUD Cadesis company Courbevoie, France {mallanic,pboutinaud}@cadesis.com ABSTRACT
Bio-Medical Imaging (BMI) is currently confronted to data issues similar to those of the manufacturing in-dustry twenty years ago. In particular, the need for data sharing and reuse has never been so strong to foster ma-jor discoveries in neuroimaging. Some data manage-ment systems have been developed to meet the require-ments of BMI large-scale research studies. However, many efforts to integrate the data provenance along a research study, from the specifications to the published results, are to be done. Product Lifecycle Management (PLM) systems are designed to comply with manufac-turing industry expectations of providing the right in-formation at the right time and in the right context. Consequently PLM systems are proposed to be rele-vant for the management of BMI data. From a need analysis led with the GIN research group, the BMI-LM data model is designed: it is PLM-oriented, generic (enabling the management of many types of data such as imaging, clinical, psychology or genetics), flexible (enabling users’ customisation) and it covers the whole stages of a BMI study from specifications to publica-tion. The test implementation of the BMI-LM model into a PLM system is detailed. The preliminary feed-back of the GIN researchers is discussed in this paper: the BMI-LM data model and the PLM concepts are rel-evant to manage BMI data, but PLM systems interfaces are unsuitable for BMI researchers.
KEYWORDS
Bio-Medical Imaging (BMI), data model, data prove-nance, Product Lifecycle Management (PLM), neuro-science
1. INTRODUCTION
The inherent complexity of biological data has always challenged researchers, as they have to deal with many data sources, natures and types of processing [10]. In particular neuroimaging domain is multidisciplinary ”by its very nature” [26]: the study of brain require an active interaction between many specialties - physics, medicine, mathematics and engineering among others. With the recent technological improvements in imag-ing devices, but also networkimag-ing and computimag-ing, the data handled by researchers has remarkably evolved. More and more cross analyses are carried out, lead-ing to results that combine imaglead-ing, behavioral and ge-netics together. The size and amount of data have in-creased significantly, as huge cohorts of patients are re-quired to draw strong inferences. Only big institutions can afford prohibitive costs, and with the complexi-fication of analyses, it becomes difficult for research groups to hold/own all necessary competencies among the team.
The imaging technologies, among which MRI - Mag-netic Resonance Imaging, a medical imaging technique to visualise internal body structures -, have reach a plateau which guarantee BMI data consistency at least for several years. This allows the data to be reused for longitudinal studies or any other analysis. How-ever, costs, time and difficulty of leading BMI studies are not decreasing. For [30], neuroscience researchers would be rewarded to move toward a more synthesis-oriented research strategy: more studies should focus on the synthesis of previous findings. Capitalizing the data among laboratories and institutions is an evident solution to get sufficient data. However, it raises
trace-ability, collaborative and confidentiality issues, and it requires efficient generic classification methods, such as data annotation, taxonomy, or ontology.
To be able to query, analyze and crosslink the complex, heterogeneous and large-scale image data resources, the BMI community must be provided with new tools and methods [28]. For 15 years the neuroimaging com-munity has been aware of the need of neuroinformatics to advance its understanding of the brain (human and non-human), but some efforts have to be done to reuse and share BMI data efficiently.
Product Lifecycle Management (PLM) systems are de-signed to solve these issues, and enables manufactur-ing industry to stay efficient and competitive. So, PLM systems promise to be adequate tools for the manage-ment of BMI data coming from large-scale studies that handle heterogeneous data.
The paper proposes a survey of BMI efforts to de-sign relevant data management systems. Second, the similarities between BMI field and industry are devel-oped. Third, the BMI-LM model for BMI data man-agement with PLM is detailed. Then, an application of the model into a PLM system with a dataset from the GIN Neurofunctional Imaging Research Group -is presented. D-iscussion and proposal for future work conclude this paper.
2. RESEARCH SURVEY ON
NEUROSCIENCE SOLUTIONS FOR BMI DATA MANAGEMENT
2.1. Modeling of BMI data organization
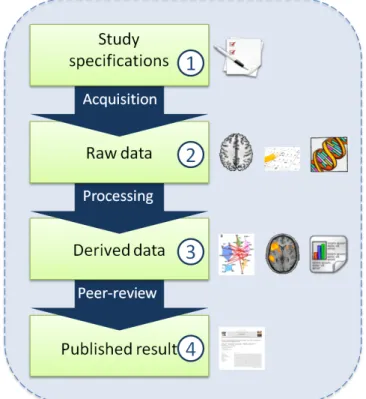
Data management in Neuroscience is recent, and few works addressing formal modeling can be found in the litterature. However, the authors of [19] describe the stages of Electronic Data Capture. Based on last-mentioned paper and on an interview conducted with the GIN researchers, a BMI research study in neuro-science can be formalized in the four stages presented on figure 1.
Firstly, the nature of the acquisitions and their intended use must be detailed, and approved by an ethic comity. This information is called study specifications in the paper and is the stage 1 of a BMI research study. Raw data- images, clinical data, results of a behavioral or ability test, genetics results - are acquired based on the study specifications and are annotated; they con-stitute the stage 2 . Then raw data are processed to get derived data or stage 3 , which in turn are pro-cessed as many times as required to reach the final
re-sult. There are different kinds of processing: single data type or combining heterogeneous data types, intra-subject (only combining data of a intra-subject) or inter-subjects (combining data of several inter-subjects). Finally, derived data are prepared for a publication format and proposed to the community. These published results are the stage 4 of a BMI research study and they can be qualified of finalized, quality-checked data, as they are validated by peers.
Figure 1 The four stages of a BMI study in neuroscience, with examples of data at every stage: documents of the study at stage 1; brain image, exam debriefing, test result, genetics sequence at stage
2
; graph of brain regions, activation coordinate, statistics and correlations at stage 3; articles, books at stage 4
Acquisition, processing and peer-review represent the processes between two stages of a research study. Knowing what has exactly been done at every stage is a key to the understanding of a piece of data by anyone who would like to reuse something from the study. The information of what a piece of data is, when, where and how it was produced, why and for whom it was per-formed is called provenance - the origin and history of a set of data [23].
2.2. Types of BMI data management solutions
There exists a growing awareness about the importance for an efficient data management in the neuroscience community. Several sizeable databases show the com-mitment of the BMI research field. They are mainly de-velopped by networks of research groups, such as the Biomedical Informatics Research Network (BIRN), the Mind Research Network (MRN), the International Neuroinformatics Coordinating Facility (INCF) or the Neuroimaging Data Access Group (NIDAG). Some data management tools are developed for projects that combine design of a database and large-scale imag-ing acquisitions and processimag-ing: the Human Connec-tome Project (HCP, [25]) and the Human Brain Project (HBP, [22]) are such projects.
Different approaches of what data and how this data could be managed are found in the literature. Two main categories of neuroimaging databases are emerging: • The first category of database enables researchers to
manage data locally and to share between sites and laboratories during large-scale studies. They handle raw and processed data (stages 2 and 3 ) accom-panied by associated metadata for study manage-ment and retrieval. The types of handled data are demographic data in addition to imaging data, and sometimes results to non-imagery tests such as be-havioral tests. Examples of such systems - the most common used in the literature by individual and col-laborative projects as observed in published papers - are XNAT [15], LORIS [6], COINS [20] and IDA [27]. They are usually open-source and used by in-stitutions or inside small collaborative projects to store and exchange easily some data.
• The second category focuses on results coming from peer-reviewed published papers (stage 4 ). Activation coordinates - one of the current targeted derived fMRI data in neuroscience - with associated metadata are the most frequently managed data in these databases. In some ways, published results databases, in particular BrainMap [9], supplement the literature by providing a unusual consistency of description, required for reuse: it appears that the information provided by the authors of papers to meet the requirements of such databases are some-times more complete and precise than what is writ-ten in the original papers [8]. Examples of such databases are BrainMap, CocoMac [4], SumsDB [7], Neurosynth [29].
2.3. Drawbacks of existing solutions
Despite around thirty BMI data management solutions developed by the neuroscience community, there are several recurrent drawbacks that prevent BMI research study data to be appropriately managed, shared and reused.
1. Global management Currently no data manage-ment tool enables heterogeneous data managemanage-ment from study specifications 1 to published results 4 . In particular, no one takes into account stage 1 ; even LORIS, which seems to be the most complete, does not manage it, nor it manages published data 4 . Few data management systems, XNAT and IDA, integrate work-flows between stages 2 and 3 , with a quality check. All other database solutions rather store the data than currently manage the concepts.
2. Integrated file management The management of the data files themselves is a weakness of all types of databases. Some local and collaborative sharing databases contains metadata only, and the data are reachable via a link to the file that is stored outside the database. This is a big issue for data consistency and retrieval, as nothing guarantee that the files are always at their location. In case of published results databases, only the data contained in the publication plus addi-tional metadata are stored and managed, but not the datasets that enables the researchers to run their analy-sis. This prevent researchers from reproducing the re-sults and limits the scope of data reuse to run further analyses.
3. Access management No data management system enables both limited-sharing and public-sharing, with access rules depending on the membership and the role played in a project. From a general matter, there exists no flexible access management.
4. Reuse strategies For the authors of [13], data provenance is crucial to ensure the quality, accuracy, reproductibility and reusability of study results. How-ever, few solutions propose a reuse strategy that try to trace data provenance. Consistency and complete-ness of data description (metadata) is one of the strate-gies for efficient data retrieval [18]. But it is most of the time partially implemented and currently there ex-ists no standard. Most of the systems belonging to the second category, and which manage published results, use taxonomies or ontologies to enhance data retrieval, which allows the manipulation of concepts. However it is not sufficient for capturing data provenance.
5. Data model flexibility Due to the technologies used to develop the solutions, it is difficult to obtain a flexible data model. Although research BMI study pro-cessing and methods are continuously evolving. Most solutions are relational databases (SQL-based), which do not allow a modification of the data model without migrating the data.
3. PLM FOR BMI DATA MANAGEMENT
When Product Lifecycle management (PLM) systems matured from Product Data Management (PDM), com-panies have evolved from managing documents to the management of enterprise concepts. To gain efficiency, the idea was to provide the right information in the right context at the right time among the global flow of information and throughout the lifecycle of the product [2]. A lifecycle is the whole set of phases which could be recognized as independant stages to be followed by a product. PLM is defined by the authors of [24] as a ”product centric - lifecycle-oriented business model, [...] in which product data are shared among actors, processes and organizations in the different stages of the product lifecycle”.
3.1. Industry and BMI: similar data management issues
PLM was designed to help the companies to be more efficient and thus develop better product more rapidly. BMI research groups evolve as well in a competitive environment: researchers have to publish noteworthy papers to get the financial grants that will allow them to lead the next studies. PLM is precisely used in indus-try to help producing better (innovative products) and faster (reduction of the duration of the product develop-ment cycle) to cut costs and stay competitive. To reach this goal, the following requirements must be taken in account: sharing, reuse, flexibility
1. Sharing There are some Protected Health Informa-tion (PHI) constraints and property rights issues that slow down data exchanges in neuroscience. Especially, only physicians can access to subject’s individual clin-ical data, and the data belong to the institution that fi-nances the acquisitions or the whole study. Collabo-rative research is crucial to obtain significant analysis and to take advantage of expertises from other research teams. An efficient and integrated data sharing sys-tem with access management is a solution to gain time and to produce more complex analysis. However, for the authors of [19], researchers are rather reluctant to share data with their peers, because of the fear to see
their methods criticized or their results challenged by a peer. Other disciplines, such as genetics[5] demon-strated that large-scale public sharing is a requirement for fast scientific advances in a research field [30]. Due to the growing complexity of products, the industry had difficulties to make people from different knowledge domains communicate during the design and manufac-turing processes. PLM systems solve the issue of data exchange between team members, whatever they are: in the same building or in different continents. Thus a PLM solution can handle the access restrictions needed by BMI for local and collaborative management. 2. Reuse The quality of information exchange be-tween two stages (Acquisition, Processing and Peer-review, see figure 1) is essential for the reusing - or repurposing - of data at any stage in a new context. Reuse of previous data is an aim shared by the BMI domain and the manufacturing industry, and is one of the features of a PLM system: providing the right in-formation at the right time and in the right context. Classified, organized and commented processes are es-sential to manage complex neuroscience analyses, as it is required to manage product complexity in manu-facturing companies. PLM systems not only manage the data, but the data processes that are traced. The data are made explicit, so that anyone can interpret its context and provenance. Traceability of what has been done promises to be a real change in the BMI work methods, as it was for industry.
3. Flexibility An important need in neuroscience data management is the required flexibility of the data model. Imaging computing technologies (between stages 2 et 3 ) are continuously evolving, as well as research protocols. In industry, design and manufac-turing methods are also updated from time to time, and PLM systems offer solutions to bring flexibility in data management: their data models are object-oriented and they easily enable classification of objects and design of workflow. The main shift brought by PLM systems is the management of concepts, instead of the manage-ment of data. BMI generic concepts must be defined to deal with the growing complexity of neuroscience analyses.
3.2. PLM and BMI up to now
Originated from the automotive and automatic indus-try, PLM has now been widely adopted by the whole manufacturing industry, including pharmaceutical sec-tor.
Nevertheless, PLM has not yet been widely set up in the medical field, except for:
• Prosthesis design and manufacture: each prosthesis is one-patient customized and thus designed with BMI 3D reconstructions based on scanned images of the patient. Tornier, Groupe Lepine or Mount Kisco Medical Group are example of companies using PLM to manage the lifecycle of each prod-uct, whatever the types of the documents: imaging, computer aided-design (CAD) or text.
• Healthcare companies: PLM are coupled with med-ical devices to eliminates manual data entry and as-sociated errors. ARAS or Teamcenter PLM systems propose this piece of software.
4. AIM AND METHODOLOGY 4.1. Requirements
Based on the review above, the data management sys-tem presented in the paper will meet the following re-quirements:
• The targeted population is the neuroscience re-searchers dealing with BMI studies;
• It manages data from study specifications to pub-lished results (the 4 stages, see figure 1);
• It allows the data to be shared throughout a com-plete access management;
• It enables retrieval and reuse of data;
• It is flexible enough to enable data model evolution. From the experience of new data management sys-tem implementations, the project management and the users’ acceptance of the system are the two main pit-falls. The last one particularly occurs when the users does not have a large culture in data management sys-tem, which is overall the case of the neuroscience com-munity.
A data management solution understood and accepted by the users is the solution aimed in the paper.
4.2. Methodology
Agile Methodologies (AM) enables continuous changes in project requirements and technologies to be managed. The approach is based on feedback and adjustments, which is great for scientific research and innovation. AM are considered very successful in the realm of software development, and they are now adapted to industrial projects as demonstrated in the Wikispeed project or for research projects such as the FP6 EURACE European project [14]. AM enable a better appropriation of the project by the users, as these last are involved in the process
by giving regularly their feedback. In particular, a Scrum [21] process organize the work presented in this paper, following an iterative, incremental approach to optimise predictability and control risk.
An existing analysis and a needs analysis have been led. Based on this work, a first PLM object-oriented neuroimaging datamodel has been specified in collab-oration with experts and key-users of the GIN research group. The model is implemented into a well-tried PLM software, and preliminary feedback from neuro-science researchers is collected.
4.3. Use case
One of the most promising application of data reuse is longitudinal study. This type of study consists in mak-ing exams twice - or more - on a cohort of subjects with an interval of several years. The aim is to analyze the evolution of the results when the subjects get older, which is currently a major concern in western countries due to the aging of the population. Keeping the prove-nance in longitudinal studies is obviously crucial, as the researchers must be able to exactly carry out the same analyses several years later, even if they did not do it themselves the first time.
The use case developed in the paper is a resting-state longitudinal study, which means that the subjects are conscious but are not performing specific cognitive tasks during the imaging exam that last many minutes. In functional studies, the subjects are alternatively per-forming specific cognitive tasks and resting time. Con-sequently, some data from functional studies could be reuse for resting-state studies, as soon as the raw data is stored with all provenance information. Additionally, the results of behavioral, ability and genetics exams could also be reused, since they are properly linked to the subjects and their imaging exams.
To carry out a longitudinal resting-state study whose raw data is originated from a longitudinal functional study, researchers must be able to perform in a database the following actions:
• Find the required raw data and its provenance to en-sure that analyses will be accurate;
• Store the derived data and keep the processing chronicle by tracing all operations and how they were performed;
• Compute the derived data - because launching a processing from the database ensure that no pieces of information is lost.
5. THE BMI-LM DATA MODEL
The BMI stages of a study can modelled as a cycle that constitutes the lifecycle of a research study, from 1 to
4
[1]. Indeed, published results constitute a basis on which to design the next studies, from both definition and processing points of view.
Three phases define PLM [12]: the design and man-ufacturing stages are the Beginning-of-life (BOL), the distribution and use stages are the Middle-of-life (MOL), and the retired stage is the End-of-life (EOL). Due to the non-material nature of BMI in fundamen-tal research studies - there exists no resulting material product, so no manufacturing stage -, the PLM EOL phase cannot be applied: as long as the images are consistent and can be read and processed, there is no obsolescence. BMI stages 1 to 3 are the BOL and stage 4 is the MOL.
From this start point the BMI-LM - Bio-Medical Imag-ing Lifecyle Management - data model is presented in the following sections.
5.1. Data reuse
The BMI-LM data model supports BMI data manage-ment during the four stages of the BMI lifecycle. On the figure 2, the circled numbers indicate the objects -or concepts - c-orresponding to the stages. Each object can contain as many description attributes as needed in order to retrieve easily the information. In the follow-ing sections, an object type is called a Business Object (BO)
Some BOs are dedicated to the definition of the BOs corresponding to a stage, in order to enable the reuse of data. The information resulting from the associa-tion of objects, via specific relaassocia-tionships, is part of the data provenance. So by example all the processing re-sultsBOs computed with a given tool and given param-eters can be attached to the same corresponding pro-cessing definitionBO. Then a user can retrieve easily all derived data obtained with an identical processing. From a general matter, with the BMI-LM model, re-searchers can query data from BOs attributes (data de-scription and worflow information) and from the defi-nition objects. Specific relationships between two con-cepts complete the reuse strategy, by making queries on relations more efficient.
5.2. Access management
The BOs are divided in two categories which compose a basis for data property rights and Protected Health Information (PHI) preservation :
• The BOs that can be created at any time and used for any study: unique subject in database, imaging and non-imaging exam definition, processing defi-nition, computing tool, acquisition device, imaging templateand bibliographical reference. All of these BOs are concepts and definitions that are used to keep the data provenance during the whole lifecy-cle of a study.
• The BOs that can be created only inside a study: these objects contain subject’s individual context data (subject demographic and clinical information) and result data (non-imaging and imaging exam, processing) of subjects, as well as result data of groups of subjects (processing). The BO study gath-ers data such as ethical research comity reports and PHI policy.
The bibliographical reference is an ambivalent BO, as it is both data resulting from a processing and definition information.
The database users can choose to share or to keep for themselves the content of a study. The main idea is to share between studies as many definition references of how to acquire and process the data as possible, in order to obtain an efficient data retrieval for reuse. For example with the resting-state longitudinal study use case, researchers will be able to find appropriate raw data from a functional longitudinal study thanks to the exam definition objects. Then they will have access to the data once the owner of the functional longitudinal study modify the access rules in their favor.
5.3. Model flexibility
The data model has been specified with in mind the idea of flexibility. The concepts associated to each BO enable any kind of subject’s data (e.g. imaging, ge-netics, behavioral, ability...) to be managed. In par-ticular, raw data is stored in a hierarchical structure of three BOs: exam (set of acquisitions acquired in a single examination), acquisition (indivisible period of data collection), and data unit (single data). This structure is required to enable the researchers to man-age different kind of data. For example a functional MRI exam consists in several acquisitions (anatomical one, then two functional ones) that can be made suc-cessively on a subject, and it is an interesting informa-tion to know that they were acquired the same day. For a functional acquisition, the resulting data is naturally made of images, but there exists also some informa-tion about subject’s feelings and behavior. The images have no sens without subject’s debriefing information,
Figure 2 BMI-LM data model UML schema with cardinality; the circled numbers shows the corresponding stages of a study. TheIn the studycategory of object is highlighted by the dotted square.
and vice versa, so both are stored under the same ac-quisition (a functional one), but in two different data units (they are not the same type).
To make the definition of metadata more flexible, spe-cific classes are added to general objects. The class defines the attributes that contain a BO and is of great help to enhance the retrieval capacities. All the classes are organized in a hierarchy, and thus some attributes can be inherited. Notably, processing result and pro-cessing definition are the most versatile objects, be-cause of the growing trend of data reuse: raw data ac-quisition protocols are less evolving than derived data processing.
To stay flexible with the AGILE method, the BO at-tributes are not part of the generic model itself (classi-fication attributes and others). Moreover, the structure can be useful not only in neuroscience, but to the whole BMI community: all BMI domains obviously does not have the same vocabulary and the same processing pa-rameters.
6. APPLICATION
6.1. The BIL&GIN datasets
The researchers of the GIN research group study brain maps of anatomical and functional cognitive activa-tions of hundred-subject cohorts, acquired with MRI. The original GIN database (GINdb) implemented by
the research group, is a relational database managing metadata and paths to related files [11]. Since 2010, it has been managing the GIN first Brain Imaging Later-ality (BIL&GIN1) dataset, which is composed of 300 subjects, balanced by gender and handedness, and was acquired between 2009 and 2011 [17]. The dataset is used in this paper as an application for the BMI-LM data model.
6.2. Implementation in Teamcenter
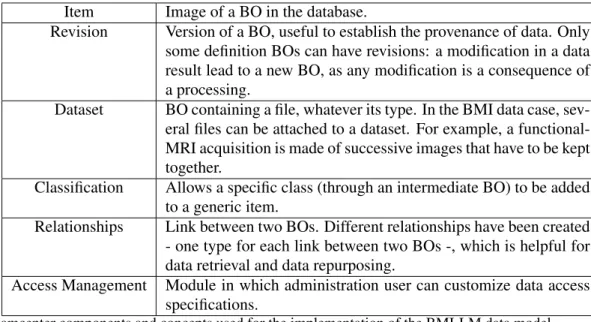
The BMI-LM data model has been implemented in the Siemens PLM software Teamcenter 9.1. A class of Teamcenter objet is created for each BO of the BMI-LM model, so that the four stages of a BMI study are supported. Data are attached to BOs instances in Teamcenter system. The BOs instances contain the metadata and are linked between them, which consti-tute the provenance. Many components and concepts of Teamcenter software system have been used, such as described in table 1.
For the purpose of the implementation some changes of the basic Teamcenter window display were neces-sary. Due to the unusual quantity of BO types (16), unique icons have been set for each type. Further to key-users’ interviews, it was decided to present all the information, such as form and classification attributes, inside the item: it simplifies the display.
Item Image of a BO in the database.
Revision Version of a BO, useful to establish the provenance of data. Only some definition BOs can have revisions: a modification in a data result lead to a new BO, as any modification is a consequence of a processing.
Dataset BO containing a file, whatever its type. In the BMI data case, sev-eral files can be attached to a dataset. For example, a functional-MRI acquisition is made of successive images that have to be kept together.
Classification Allows a specific class (through an intermediate BO) to be added to a generic item.
Relationships Link between two BOs. Different relationships have been created - one type for each link between two BOs -, which is helpful for data retrieval and data repurposing.
Access Management Module in which administration user can customize data access specifications.
Table 1 Teamcenter components and concepts used for the implementation of the BMI-LM data model
users than the BO attributes (no need of a BMIDE -Business Modeler IDE - customisation, it can be made in the rich client), which is good to fit the model flexi-bility requirement and also for the appropriation of the database by the users.
6.3. Migration from BIL&GIN1
From the SQL GINdb database, the BIL&GIN1 dataset was migrated by using:
• Talend Open Studio for MDM v5.2.0 to map the GINdb data model and the BMI-LM data model, • PLMXML language to import the data in the new
Teamcenter database.
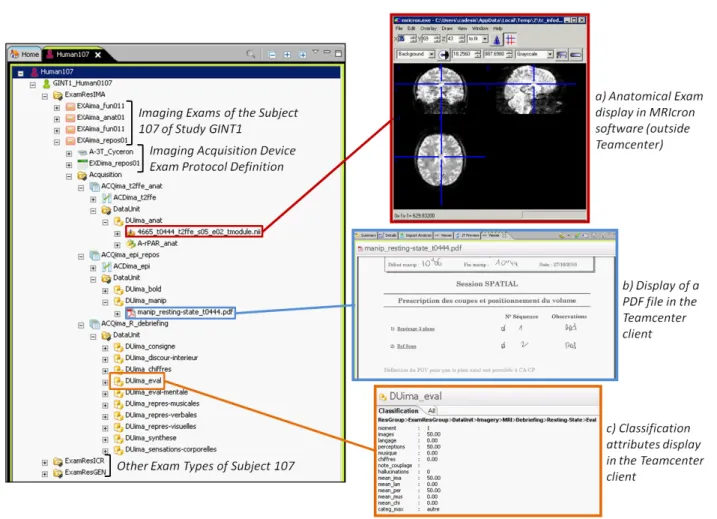
The classification has been developed with a GIN ex-pert. The figure 3 shows a screenshot of the imple-mentation in Teamcenter rich client. A tree with one subject’s BOs contains the raw data of all his or her exams, with the associated definition BOs (acquisition device, data unit definition...). An example of classi-fication attributes display is shown. The datasets are stored under their parent BO; two of them are cur-rently opened: a pdf file in Teamcenter viewer, and an anatomical MRI image in an external image visualiza-tion software (MRIcron).
In a first step of the AGILE method, no effort has been made to develop integrated neuroscience visualizers in Teamcenter. Besides, the difference between the pre-vious data concept organization (GINdb) and the BMI-LM has been minimized deliberately, in order to reduce the required training of the GIN researchers on the new environment.
6.4. Integrated processing workflow
A workflow has been designed to manage the pro-cessing of BMI data. As an example in the context of the longitudinal resting-state study use case, it is useful to compute the average anatomical image of a group of subject that meet some criteria, for example the subjects are aged between 25 and 40 with an Edin-burgh score between 50 and 100 (behavioral test eval-uating manual preference [16]). The researcher de-fines the anatomical exam query in Teamcenter, col-lects the results, secol-lects the processing definition of average anatomical image and launch the calculation through the worflow. The anatomical images and the processing script and parameters are exported, then sent to an external computing grid, and then the re-sulting average anatomical image is imported. A new processing result item is created: it contains the file of the average anatomical image and it is linked to the av-erage anatomical definition as well as to the raw data anatomical exams that were used for the processing. During all the process, the only action to perform by the user is to select initial items, and to check the out-comes in the new resulting items. An immediate bene-fit is the automatic definition of data provenance which will be useful for future reuse during the longitudinal study itself, or other studies.
6.5. Feedback
The implementation has been demonstrated to the members of the GIN research group, in order to fo-cus on the benefits and drawbacks of the BMI-LM data model. The researchers recognize their familiar con-cepts and fully agree with the new organization of the
Figure 3 Screenshot of Teamcenter rich client window. The items under the subject 107 belonging to the study GINT1 are displayed; a brain imaging resting-state exam is partially expanded and two datasets are opened: an anatomical image (a) and a pdf file (b); the display of classification attributes is also shown (c).
data. The main critics was dealing with the interface of the software (basic Teamcenter rich client display): there are too many menus, icons and sub-windows in the environment. The actions of searching for infor-mation is not immediate. What they are looking for in terms of ergonomics is an over-simplified interface with few choices to make for each options. They want to be able to handle the tool almost without any train-ing. Another remark was the profusion of industry vo-cabulary, which constitutes an interference in the inter-face.
7. DISCUSSION AND FUTURE WORK
In the paper, the BMI-LM data model for a PLM appli-cation to BMI data management and its implementa-tion in Teamcenter PLM software are presented. Com-pared to existing databases of neuroimaging domain, the PLM system implementation of the BMI-LM data model enlarges the scope of data management possi-bilities. Indeed, the database thus obtained enables
data of neuroscience research studies to be managed from study specifications to published results. In ad-dition, it provides an efficient access management, a complete data provenance and quite a durability of the data model thanks to its flexibility. By solving the main issues of BMI data management, PLM constitutes a promising tool for the domain. The choice of Team-center PLM software is justified because of its practi-cal use (software modular and customization facilities, access to the software, administration competencies), and the authors of the paper have no interests in the software (neither Talend Open Studio). As the model is generic, there exists no reason that the BMI-LM data model do not work with another PLM software. A limitation of the current works is the sharing of the data to the public community. Thanks to its access management module, Teamcenter can deal easily with different access rules on each study and depending on user’s category. However, even if a PLM light web client exists, licenses to connect to the database and
users training are required, which prevents from occa-sional use. This review is validated by the users’ feed-back that has critics not about data processing and man-agement of the software, but its interface. So in the fu-ture, a simplified and more adequate non-licensed user interface has to be developed.
Besides, traditional PLM systems are flexible, but re-search work requires more, as the rere-search practices are continuously evolving. As a consequence, a future work could be to propose a semantic enrichment, based on ontology, and which handles the management of re-lationships between objects [3]. In neuroscience, some popular and complete ontologies are existing (Cogni-tive Atlas Project, CogPO, Neurolex, OBO) and could be used as is. The understanding of the relationships between objects is complex, and a second point in the upcoming works is to visualize the relationships by graphs, in order to improve the navigation as well as the visualization of data provenance in the PLM software. Currently, no PLM software has a satisfactory relation browser or viewer, but this constitutes a requirement to the plain management (access and appropriation) of a big amount of data, and not just its storage.
Thanks to all these developments for neuroscience field, the aim is to achieve a BMI-dedicated module for PLM, as well as to enhance some PLM features as a feedback.
ACKNOWLEDGMENT
The authors wish to thank in particular the Associa-tion NaAssocia-tionale de la Recherche et de la Technologie (ANRT) for its financial support to their work (CIFRE 2012/0420).
The work presented in the paper is conducted within the ANR (Agence Nationale de la Recherche) founded project BIOMIST (no ANR-13-CORD-0007) for the-matic axis no2 of the Contint 2013 Call for Proposal: from content to knowledge and big data.
References
[1] M Allanic, A Durupt, M Joliot, B Eynard, and P Boutinaud. Application of plm for bio-medical imaging in neuroscience. In Product Lifecy-cle Management for Society, pages 520–529. Springer, 2013.
[2] F Ameri and D Dutta. Product Lifecycle Manage-ment : Closing the Knowledge Loops. Computer-Aided Design & Application, 2(5):577–590, 2005.
[3] I Assouroko, G Ducellier, B Eynard, and P Boutinaud. Semantic relationship knowledge management and reuse in collaborative product development. 9th International Conference on Product Lifecycle Management, Qu´ebec, 2012. [4] R Bakker, T Wachtler, and M Diesmann.
CoCo-Mac 2.0 and the future of tract-tracing databases. Frontiers in neuroinformatics, 6(December):30, January 2012.
[5] DA Benson, I Karsch-Mizrachi, DJ Lipman, J Ostell, and EW Sayers. Genbank. Nucleic acids research, 38(suppl 1):D46–D51, 2010.
[6] S Das, AP Zijdenbos, J Harlap, D Vins, and A C Evans. LORIS: a web-based data management system for multi-center studies. Frontiers in neu-roinformatics, 5:37, January 2011.
[7] J Dickson, H Drury, and DC Van Essen. The surface management system (sums) database: a surface–based database to aid cortical sur-face reconstruction, visualization and analysis. Philosophical Transactions of the Royal Soci-ety of London. Series B: Biological Sciences, 356(1412):1277–1292, 2001.
[8] PT Fox, AR Laird, SP Fox, P Mickle Fox, An-gela M U, Michelle Crank, Sandra F Koenig, and Jack L Lancaster. BrainMap taxonomy of exper-imental design: description and evaluation. Hu-man brain mapping, 25(1):185–98, May 2005. [9] PT Fox and JL Lancaster. Mapping context and
content: the BrainMap model. Nature reviews. Neuroscience, 3(4):319–21, April 2002.
[10] C Goble and R Stevens. State of the nation in data integration for bioinformatics. Journal of biomedical informatics, 41(5):687–93, October 2008.
[11] M Joliot, N Delcroix, L Zago, M Vigneau, F Criv-ello, G Simon, L Petit, MR Turbelin, M Naveau, F Lamberton, PY Herv, G Jobard, E Mellet, B Mazoyer, and N Tzourio-Mazoyer. GINdb: portable database for the storage and processing of human functional brain imaging data. Proceed-ings of the 16th Annual Meeting of the Organiza-tion for Human Brain Mapping Barcelona, Spain, 2010.
[12] D Kiritsis, A Bufardi, and P Xirouchakis. Re-search issues on product lifecycle management
and information tracking using smart embedded systems. Advanced Engineering Informatics, 17(3-4):189–202, July 2003.
[13] AJ MacKenzie-Graham, JD Van Horn, RP Woods, KL Crawford, and AW Toga. Provenance in neuroimaging. Neuroimage, 42(1):178–195, 2008.
[14] M Marchesi, K Mannaro, S Uras, and M Locci. Distributed scrum in research project manage-ment. In Agile Processes in Software Engineer-ing and Extreme ProgrammEngineer-ing, pages 240–244. Springer, 2007.
[15] DS Marcus, TR Olsen, M Ramaratnam, and RL Buckner. The Extensible Neuroimaging Archive Toolkit and Sharing Neuroimaging Data. Neuroinformatics, 00:11–34, 2007.
[16] RC Oldfield. The assessment and analysis of handedness: the edinburgh inventory. Neuropsy-chologia, 9(1):97–113, 1971.
[17] L Petit, F Crivello, E Mellet, G Jobard, L Zago, M Joliot, B Mazoyer, and N Tzourio-Mazoyer. BIL&GIN: a database for the study of hemi-spheric specialization. Proceedings of the 18th Annual Meeting of the Organization for Human Brain Mapping, Beijing, China, 2012.
[18] RA Poldrack, PC Fletcher, RN Henson, KJ Wors-ley, M Brett, and TE Nichols. Guidelines for re-porting an fMRI study. NeuroImage, 40(2):409– 14, April 2008.
[19] JB Poline, JL Breeze, S Ghosh, K Gor-golewski, YO Halchenko, M Hanke, C Hasel-grove, KG Helmer, DB Keator, DS Marcus, R Poldrack, Y Schwartz, J Ashburner, and DN Kennedy. Data sharing in neuroimaging re-search. Frontiers in neuroinformatics, 6:9, April 2012.
[20] A Scott, W Courtney, D Wood, R de la Garza, S Lane, M King, R Wang, J Roberts, J a Turner, and VD Calhoun. COINS: An Innovative In-formatics and Neuroimaging Tool Suite Built for Large Heterogeneous Datasets. Frontiers in neu-roinformatics, 5(December):33, January 2011. [21] SCRUM.ORG. Improving the profession of
soft-ware development. http://www.scrum.org/, Jan-uary 2014.
[22] GM Shepherd, JS Mirsky, MD Healy, MS Singer, E Skoufos, MS Hines, PM Nadkarni, and PL Miller. The Human Brain Project: neuroinfor-matics tools for integrating, searching and mod-eling multidisciplinary neuroscience data. Trends in neurosciences, 21(11):460–8, November 1998. [23] YL Simmhan, B Plale, and D Gannon. A survey of data provenance in e-science. ACM Sigmod Record, 34(3):31–36, 2005.
[24] S Terzi, Bouras A, B Butta, M Garetti, and D Kir-itsis. Product lifecycle management from its history to its new role. International Journal of Product Lifecycle Management, 4(4):360–389, 2010.
[25] DC Van Essen, K Ugurbil, E Auerbach, D Barch, TEJ Behrens, R Bucholz, A Chang, L Chen, M Corbetta, SW Curtiss, S Della Penna, D Fein-berg, MF Glasser, N Harel, AC Heath, L Larson-Prior, D Marcus, G Michalareas, S Moeller, R Oostenveld, SE Petersen, F Prior, BL Schlag-gar, SM Smith, AZ Snyder, J Xu, and E Yacoub. The Human Connectome Project: a data acqui-sition perspective. NeuroImage, 62(4):2222–31, October 2012.
[26] JD Van Horn, JS Grethe, P Kostelec, JB Wood-ward, JA Aslam, D Rus, D Rockmore, and MS Gazzaniga. The functional magnetic reso-nance imaging data center (fmridc): the chal-lenges and rewards of large–scale databasing of neuroimaging studies. Philosophical Transac-tions of the Royal Society of London. Series B: Bi-ological Sciences, 356(1412):1323–1339, 2001. [27] JD Van Horn and AW Toga. Is it time to
re-prioritize neuroimaging databases and digital repositories? NeuroImage, 47(4):1720–34, Octo-ber 2009.
[28] T Walter, DW Shattuck, R Baldock, ME Bastin, AE Carpenter, S Duce, J Ellenberg, A Fraser, N Hamilton, S Pieper, M a Ragan, JE Schneider, P Tomancak, and JK H´erich´e. Visualization of image data from cells to organisms. Nature meth-ods, 7(3 Suppl):S26–41, March 2010.
[29] T Yarkoni, R Poldrack, TE Nichols, DC Van Es-sen, and TD Wager. Large-scale automated syn-thesis of human functional neuroimaging data. Nature Methods, 8(8):665–670, 2011.
[30] T Yarkoni, R Poldrack, DC Van Essen, and TD Wager. Cognitive neuroscience 2.0: build-ing a cumulative science of human brain func-tion. Trends in cognitive sciences, 14(11):489– 96, November 2010.