Cation-Disordered Oxides for
Rechargeable Lithium Battery Cathodes
by
Jinhyuk Lee
B.S. Materials Science and Engineering
Seoul National University (2010)
Submitted to the Department of Materials Science and Engineering
in partial fulfillment of the requirements for the degree of
Doctor of Philosophy
in Materials Science and Engineering
at the
MASSACHUSETTS INSTITUTE OF TECHNOLOGY
September 2015
© Massachusetts Institute of Technology, 2015. All rights reserved.
Signature of author ...
Department of Materials Science and Engineering
July 21, 2015
Certified by ...
Gerbrand Ceder
R. P. Simmons Professor of Materials Science and Engineering
Thesis Supervisor
Accepted by ...
Donald R. Sadoway
Chair, Departmental Committee on Graduate Students
3
Cation-Disordered Oxides for
Rechargeable Lithium Battery Cathodes
by
Jinhyuk Lee
Submitted to the Department of Materials Science and Engineering On July 21, 2015, in partial fulfillment of the requirements for the degree of
Doctor of Philosophy in Materials Science and Engineering
Abstract
The demands for high-energy density cathode materials for rechargeable lithium batteries are ever increasing. This is because such cathode materials will enable smaller and lighter
rechargeable lithium batteries for complex applications such as in electric vehicles or in grid energy storage. Nearly all high-energy density cathode materials for rechargeable lithium batteries have been sought from well-ordered close-packed oxides in which lithium and transition metal ions occupy distinct sites. In contrast, cation-disordered oxides, whose cation distribution is fully or partially random, have received only a limited attention, because lithium diffusion tends to be limited by their cation-disordered structure.
In the first part of this thesis, from the study of Li1.211Mo0.467Cr0.3O2, it is demonstrated
that cation-disordered oxides can be promising cathode materials if they contain enough lithium excess (x >1.09 in LixTM2-xO2). Li1.211Mo0.467Cr0.3O2 forms into a layered structure, but
transforms almost completely to a cation-disordered structure during cycling. While common wisdoms would expect poor cyclability of this material due to limited lithium diffusion in its structure, the reversible capacity of this material is remarkably high (~265 mAh/g), which demonstrates that lithium diffusion can be facile in the cation-disordered structure. Using ab
initio calculations, we show that this counterintuitive behavior is due to percolation of a certain
type of active diffusion channels (0-TM channels) in disordered Li-excess materials, which becomes more extensive as the lithium-excess level increases.
In the second part of this thesis, a new class of high capacity cation-disordered oxides (Li-Ni-Ti-Mo oxides) is designed based on the 0-TM percolation theory. As the theory predicts, the reversible capacity and rate capability in these materials considerably improve with lithium excess. In particular, Li1.2Ni1/3Ti1/3Mo2/15O2 delivers high capacity and energy density up to
250 mAh/g and 750 Wh/kg at 10 mA/g. Combining in situ X-ray diffraction, electron energy loss spectroscopy, and X-ray absorption near edge spectroscopy, we investigate the redox mechanism of the new materials and discuss how oxygen loss with lattice densification can affect lithium diffusion in the materials by decreasing the lithium-excess level. From these understandings, strategies for further improvements are proposed, setting new guidelines for the design of high performance cation-disordered oxides for rechargeable lithium batteries. Thesis Supervisor: Gerbrand Ceder
4
Acknowledgements
First, I would like to thank my thesis advisor, Professor Gerbrand Ceder, for his intellectual and mental supports. I was very excited and honored to work with him who is not only insightful but also fearless in conducting research. Thanks to him, I could finally become an independent researcher who can pursue ideas that can greatly contribute to the materials research society.
I would also like to thank my thesis committee members, Professor Donald Sadoway and Professor Jeffrey Grossman, for their valuable comments and supports on my research. Thanks to their generosity and supports, I could successfully complete my doctoral research.
I also thank my collaborators in the CEDER group (Dr. Alexander Urban, Dr. Xin Li, and Dr. Dong-Hwa Seo) for their continuous support on my research. Without them, none of my work could have been realized. The entire CEDER group members (Aziz Abdellahi, Rahul Malik, Stephen Dacek, Sai Gautam, Eric Wang, Rui Wang, Lei Liu, Wenxuan Huang, Daniil Kitchaev, Ian Matts, William Richards, Ziqin Rong, Wenhao Sun, Alexandra Toumar, Piere Manuele Canepa, Shinyoung Kang, Jae Chul Kim, Dong-Hwa Seo, Nancy Twu, Alexander Urban and Kathy Simons) are greatly acknowledged. The greatest thing about the CEDER group is that you can work with the nicest and the smartest people in the world whom you can be greatly inspired by. In particular, I thank the Korean members in the CEDER group (Dr. Jae Chul Kim, Dr. Shinyoung Kang, Dr. Dong-Hwa Seo, and Prof. Byoungwoo Kang) for their support. Thanks to them, my life in the CEDER group could be more lively and vivid. I always felt joys when spending time with them. Moreover, Nancy Twu and Wenhao Sun are greatly acknowledged. I had to go through many different moments during the graduate life, and I was so happy to share happy and harsh moments with them as the same-year CEDER group
5
Samsung Scholarship is greatly acknowledged for supporting me both financially and mentally. I will not forget happy moments that I shared with the Samsung Scholarship
community. I also thank the Robert Bosch Corporation and the Umicore Specialty Oxides and Chemicals for their financial support on my research.
All the Korean graduated students in the DMSE are greatly acknowledged. They have been a social family to me, guiding me toward a right direction for my graduate life. In
particular, I thank all the Korean students who joined DMSE MIT in the same year of 2010 (Donghun Kim, Mansoo Park, Jiyoun Chang, Gyehyun Kim, and Sangtae Kim). I spent more time with them than any other people in MIT, and shared all the fun and happy moments with them during the graduate life. I hope to keep in touch with them and wish their future stays as bright as now.
I cannot thank enough to my parents and my brother. I could not have grown up strong and confident without their endless support and love. Finally, I thank my beloved wife, Lina Dahye Song, whose patience, support and love made this possible.
7
Contents
List of Figures and Tables
... 11Part I. Introduction
... 201.1 Motivation
... 211.2 Overview of rechargeable lithium batteries
... 221.3 Layered lithium transition metal oxides for Li-ion battery cathodes ...
261.4 Ordering paradigm for the oxide cathodes
... 301.5 Overview of the thesis
... 35Part II. Unlocking the potential of cation-disordered oxides for
rechargeable lithium batteries
... 362.1 Introduction
... 372.2 Methodology
... 39 2.2.1 Experimental methodology ... 39 2.2.1.1 Synthesis ... 392.2.1.2 Electrochemistry... 45
2.2.1.3 Characterization ... 45 2.2.2 Computational methodology ... 46
2.2.2.1 Density-functional theory calculations ... 46
2.2.2.2 Structural model ... 47
8
2.3 Experimental results
... 492.3.1 Characterization of the as-synthesized Li1.211Mo0.467Cr0.3O2 ... 49
2.3.2 The electrochemical properties of Li1.211Mo0.467Cr0.3O2 ... 51
2.3.3 The structural change in Li1.211Mo0.467Cr0.3O2 during cycling ... 55
2.3.4 Redox mechanism of Li1.211Mo0.467Cr0.3O2 ... 59
2.4 Computational results
... 612.4.1 Li diffusion channels in cation-disordered oxides ... 61
2.4.2 Li diffusion barriers in cation-disordered oxides: active 0-TM channels ... 62
2.4.3 Percolation of 0-TM diffusion channels ... 65
2.5 Discussions
... 67
2.6 Conclusion
... 69Part III. A new class of high capacity cation-disordered oxides for
rechargeable lithium batteries: Li-Ni-Ti-Mo oxides
... 71
3.1 Introduction
... 723.2 Methodology
... 743.2.1 Experimental methodology ... 74
3.2.1.1 Synthesis ... 74
3.2.1.2 Electrochemistry ... 74
3.2.1.3 X-ray diffraction (XRD), scanning electron microscopy (SEM), and electron energy loss spectroscopy (EELS) ... 75
3.2.1.4 In situ X-ray diffraction ... 76
9
3.2.2 Computational methodology ... 77
3.3 Experimental results
... 793.3.1 Design strategy form percolation theory... 79
3.3.2 Characterization of Li-Ni-Ti-Mo oxides ... 81
3.3.3 The electrochemical properties of Li-Ni-Ti-Mo oxides ... 86
3.3.4 The structural evolution of Li1.2Ni1/3Ti1/3Mo2/15O2 during cycling ... 92
3.3.5 Investigation on the redox mechanism ... 93
3.4 Computational results
... 993.4.1 Oxygen loss mechanisms ... 99
3.4.2 Calculated voltage profiles from possible redox mechanisms ... 101
3.4.3 Reduction of Mo and Ti after oxygen loss ... 103
3.5 Discussions
... 1053.5.1 Redox mechanism ... 105
3.5.2 Electrochemical performance ... 107
3.5.3 Strategies for improvements ... 109
3.6 Conclusion
... 111Part IV. Conclusions
... 112
References
... 11711
List of Figures and Tables
Figure 1-1 Gravimetric power and energy densities for different rechargeable batteries, which are currently being investigated for grid storage applications.
Figure 1-2 Schematic description of Li-ion batteries: reversible shuttling of Li+ ions between the cathode and the anode enables Li-ion batteries.
Figure 1-3 Illustrations of the crystal structure of (a) a layered Li-TM oxide, (b) a spinel Li-TM oxide, and an olivine LiMPO4 (M = Fe, Mn etc.)
Figure 1-4 The first-cycle voltage profile of bare and coated LiCoO2 when cycled between
2.75−4.4 V at a rate of 70 mA/g.
Figure 1-5 The first-cycle voltage profile of Li/LiNi1/3Mn1/3Co1/3O2 with a current density of
0.2 mA/cm2.
Figure 1-6 The first-cycle voltage profiles of 0.3Li2MnO3·0.7LiMn0.5Ni0.5O2.
Figure 1-7 The discharge profile at various C rates for the ion-exchanged (IE)-LiNi0.5Mn0.5O2
(above) and sold state (SS)-LiNi0.5Mn0.5O2 (below). In the test, the cell was charged at C/20 to
4.6 V, then held at 4.6 V for 5 hours and discharged at different rates. 1C corresponds to 280 mA/g.
Figure 1-8 (a) The octahedral to tetrahedral to octahedral Li diffusion in general rocksalt-type Li-TM oxides (b) The 1-TM channel in stoichiometric Li-TM oxides
Figure 1-9 (a) The decrease in the Li slab distance (tetrahedron height) by cation mixing: the layered structure has much larger Li slab spacing than the cation-disordered structure. (b) The calculated activation barrier for Li migration in LiNiO2 with cation mixing (stars) and without
12
with thick and thin dashes at different Li contents, respectively. The shift on the left is from fully lithiated state and the one on the right is from partially delithiated state.
Figure 1-10 (a) The X-ray powder diffraction patterns of LiCoO2 powders prepared at high
temperature after subsequent exposure to different milling times. (b) Voltage profiles of cathodes prepared from LiCoO2 samples exposed to different milling times.
Figure 1-11 (a) Charge-discharge curves of high-temperature α-LiFeO2 and low-temperature
ɑ-LiFeO2 (b) Capacity retention of low-temperature α-LiFeO2.
Figure 2-1 Illustration of the layered rocksalt structure and disordered rocksalt structure: cation mixing between Li and TM layers lead to a disordered rocksalt structure, which tends to result in poor cyclability of Li-TM oxides by slowing down Li diffusion.
Figure 2-2 The voltage profile of Li2VO3.
Figure 2-3 High resolution transmission electrons microscopy images in two directions of the carbon-coated Li1.211Mo0.467Cr0.3O2 particle (top), and uncoated Li1.211Mo0.467Cr0.3O2 particle
(bottom)
Figure 2-4 The two upper left images show a Li metal foil and a separator from a
Li1.211Mo0.467Cr0.3O2 half-cell that was charged/discharged for 100 cycles between 1.5−4.3 V at
164 mA/g at room temperature. The upper right SEM image shows spherical particles on the colored area on the separator (dotted circle). The lower image shows an energy dispersive X-ray spectroscopy (EDS) spectrum of a particle attached to the separator, indicating that the particles from the colored area are composed of Mo and Cr (Mo:Cr = 8.875:1).
Figure 2-5 Li1.211Mo0.467Cr0.3O2 half-cells were disassembled at points A, B, and C on the first
charge voltage profile of Li1.211Mo0.467Cr0.3O2 at 3.2 mA/g. The three inset images with red
boundaries show Li metal anode foils (attached to a current collector rod) from
Li1.211Mo0.467Cr0.3O2 half cells that were disassembled after four days of resting at the first
charge state of A) 200 mAh/g, B) 250 mAh/g, and C) 300 mAh/g. The inset image with a blue boundary shows a Li metal anode foil that was disassembled from a carbon-coated
13
Li1.211Mo0.467Cr0.3O2 half-cell after four days of resting at the same first charge state of
300 mAh/g as point C.
Figure 2-6 The discharge-capacity retention of carbon-coated and uncoated
Li1.211Mo0.467Cr0.3O2 during cycling between 1.5−4.3 V at 16.4 mA/g at room temperature. The
two inset images show Li metal anode foils from uncoated and carbon-coated
Li1.211Mo0.467Cr0.3O2 half-cells after ten cycles. Carbon coating retards transition metal
dissolution, improving the capacity retention of carbon-coated Li1.211Mo0.467Cr0.3O2.
Figure 2-7 The first-cycle voltage profile of the carbon-coated and uncoated
Li1.211Mo0.467Cr0.3O2 when cycled between 1.5−4.3 V at 32.7 mA/g at room temperature.
Figure 2-8 Structural model of disordered-Li2MoO3: The simulation cell contains 12 formula
units (72 atoms). In the figure, large red balls represent oxygen atoms, and small green and violet balls represent the octahedral sites of lithium and molybdenum, respectively.
Figure 2-9 0-TM wrapping probability (a) and accessible lithium fraction (b) as a function of the Li-excess level for different FCC supercell sizes. Results for fully disordered structures are shown. The legends refer to supercells of the primitive FCC unit cell.
Figure 2-10 Rietveld refinement on the XRD pattern of pristine Li1.211Mo0.467Cr0.3O2 powder.
The atomic ratio between elements was first set to the ICP result, and then Mo and Cr
occupancy in Li and TM layers were refined. The refinement suggests no transition metals in Li layers at all. Li occupancy was refined after Mo and Cr occupancy had been determined.
Figure 2-11 (a) The (003) peak in the XRD pattern on Li1.211Mo0.467Cr0.3O2 [black] and that of
LiCrO2 [blue] (b) The electron diffraction pattern along ZA[010] of Li1.211Mo0.467Cr0.3O2.
Figure 2-12 The broader XRD peaks of the carbon-coated Li1.211Mo0.467Cr0.3O2 powder (lower
left) compared to the sharper XRD peaks of pristine Li1.211Mo0.467Cr0.3O2 powder (upper left)
indicate that the carbon-coated Li1.211Mo0.467Cr0.3O2 particles are smaller than the uncoated
particles. Furthermore, SEM images (right) confirm that the particles of the carbon-coated Li1.211Mo0.467Cr0.3O2 are smaller than those of uncoated one. During the carbon coating process,
14
sucrose (carbon precursor) and the Li1.211Mo0.467Cr0.3O2 powder were mixed in a planetary
ball-mill for six hours at 300 rpm, resulting in smaller particles after carbon coating.
Figure 2-13 The voltage profile of the carbon-coated Li1.211Mo0.467Cr0.3O2 when cycled
between 1.5−4.3 V at the rate of 16.4 mA/g at room temperature
Figure 2-14 The 10-cycle voltage profiles of the carbon-coated Li1.211Mo0.467Cr0.3O2 when
cycled between 1.5−4.3 V at the rate of (a) 4.1 mA/g, (b) 8.2 mA/g, and (c) 16.4 mA/g at room temperature (d) Corresponding specific capacity vs. cycle number plot
Figure 2-15 The voltage profile of the carbon-coated Li1.211Mo0.467Cr0.3O2 when cycled
between 1.5−4.3 V at a rate of C/10, C/2, 1C, 2C, 4C and 10C (1C = 327 mA/g)
Figure 2-16 Capacity retention of the carbon-coated Li1.211Mo0.467Cr0.3O2 when cycled between
1.5-4.3 V at a rate of C/10, C/2, 1C, 2C, 4C and 10C (1C = 327 mA/g)
Figure 2-17 The ex situ XRD pattern of the carbon-coated Li1.211Mo0.467Cr0.3O2 electrode
before cycle, after one cycle, after two cycles, and after 10 cycles between 1.5−4.3V at 32.7 mA/g.
Figure 2-18 Rietveld refinement on the XRD pattern of a carbon-coated Li1.211Mo0.467Cr0.3O2
electrode after ten cycles between 1.5−4.3 V at 32.7 mA/g. Kapton film was applied to prevent oxidation, resulting in humps below 30°. From XRD refinement, it is difficult to precisely quantify and distinguish the level of Mo migration and Cr migration to Li layers. Therefore, we refined the XRD pattern with two different methods: (a) Refine Mo occupancy first then Cr occupancy. Here, refinement suggests that only Mo migrates (0.2634 Mo in Li layers). (b) Assume all Cr are in Li layers then refine Mo occupancy. Refinement is much improved by assuming 0.097988 Mo in addition to 0.3 Cr in Li layers. In both methods, Li occupancy was later refined by distributing 0.92 Li (based on the cumulative charge-discharge capacity after ten cycles) to Li and TM layers. However, the values are more subject to error. The two ways of refining give two extremes of the transition metal (TM) migration level. Refinement based
15
on the method A suggests a TM migration level of ~34.3% (i.e. ~34.3% of overall TM ions are in Li layers), and refinement based on the method B suggests a TM migration level of ~51.88%. From the two values, we can expect that at least ~34% to ~52% of TM ions have migrated to Li layers after ten cycles, indicating substantial cation mixing in Li1.211Mo0.467Cr0.3O2. Note that
the TM migration level can slightly vary with the rate of cycling which changes the delithiation level at the end of charge. To determine the average tetrahedron height of the disordered- Li1.211Mo0.467Cr0.3O2, eight tetrahedron heights (four from the tetrahedron in Li layers, and four
from that in TM layers) were averaged out, as Li1.211Mo0.467Cr0.3O2 is not yet completely
disordered. Method A yields 2.39701 Å (× 3), 2.38362 Å (× 3), 2.41831 Å (× 1), and 2.37791 Å (× 1), resulting in the average tetrahedron height of 2.39226 Å . Method B yields 2.39816 Å (× 3), 2.38775 Å (× 3), 2.40875 Å (× 1), and 2.37756 Å (× 1), resulting in the average tetrahedron height of 2.393 Å . Therefore, both methods suggest the average
tetrahedron height of disordered- Li1.211Mo0.467Cr0.3O2 to be ~2.39 Å .
Figure 2-19 Left: the scanning transmission electron microscopy images along the [010] zone axis in a carbon-coated Li1.211Mo0.467Cr0.3O2 particle before cycling and after 1 and 10 cycles
between 1.5−4.3 V at 16.4 mA/g. Right: Corresponding line profiles of the Z-contrast information with the measured spacing of Li-Mo-Cr layers.
Figure 2-20 (a) The cyclic voltammetry profile of the carbon-coated Li1.211Mo0.467Cr0.3O2, (b)
Cr EELS L3/L2 ratio in Li1.211Mo0.467Cr0.3O2 before cycling, after the first charge, and after the
first cycle. (c) Integrated spin density of Mo and Cr in Li1.211Mo0.467Cr0.3O2 as a function of the
delithiation level, obtained by DFT calculations.
Figure 2-21 (a) o-t-o diffusion: Two tetrahedral paths connect each pair of neighboring
octahedral sites (b-d) The activated Li+ ion can face-share with no octahedral transition metals (0-TM channel) (b), one transition metal (1-TM channel) (c), or two transition metals (2-TM channel) (d): note that the 2-TM channels do not support divacancy diffusion mechanism, and thus diffusion barrier through the 2-TM channels are extremely high.
Figure 2-22 Calculated Li migration barriers along 1-TM (Mo4+) channels (red squares), 1-TM (Cr3+) channels (blue triangles), and 0-TM (Li+) channels (black circles) as a function of the
16
average tetrahedron height of model disordered structure (disordered Li2MoO3, disordered
LiCrO2). Error bars denotes standard deviation. The shaded area highlights typical tetrahedron
heights of disordered materials
Figure 2-23 (a) Computed probability to find a percolating network of 0-TM channels (color) vs. Li content (x in LixTM2-xO2) and cation mixing (TMLi layers/TMTM layers ×100%) (b) The
accessible Li contents by a percolating 0-TM network (color) vs. Li content and cation mixing. In the simulation, cations were randomly distributed at each cation mixing level
Table 2-1 The average tetrahedron height of disordered rocksalt-type Li-TM-oxides, deduced from the literatures. The tetrahedron height of a disordered Li-TM-oxide is equivalent to its (111) plane distance, which can be derived by dividing the a-lattice parameter of each material by √3.
Figure 2-24 (a) The XRD patterns of the carbon-coated Li1.211Mo0.467Cr0.3O2 after ten cycles,
after ten cycles then charged to Li0.6165Mo0.467Cr0.3O2, and after ten cycles then charged to
Li0.3082Mo0.467Cr0.3O2 when cycled between 1.5−4.3 V at 32.7 mA/g. (b) The c- and a-lattice
parameter in disordered Li1.211Mo0.467Cr0.3O2 (based on the space group of R-3m) at different
delithiation states (x = 0.291, 0.5945, 0.90275 in Li1.211-xMo0.467Cr0.3O2). The change in the
lattice parameters is very small, leading to negligible volume change (<~0.12 %) upon delithiation
Figure 3-1 (a) The crystal structure of disordered rocksalt-type solid solution compounds between LiNi0.5Ti0.5O2 and Li1+xM1-xO2 (M = Ti4+, Nb5+, Mo6+) (b-d) Theoretical capacities are
given when M is (b) Ti4+ (c) Nb5+ and (d) Mo6+. Each figure plots three different capacities: Li capacity that assumes full extraction of available Li-ions, Ni2+/Ni4+ redox capacity, and 0-TM capacity that is the Li capacity accessible by the percolating 0-TM network
Figure 3-2 The X-ray diffraction patterns of LiNi0.5Ti0.5O2 (LNTO), Li1.05Ni11/24Ti11/24Mo1/30O2
(LNTMO5), Li1.1Ni5/12Ti5/12Mo1/15O2 (LNTMO10), Li1.15Ni3/8Ti3/8Mo1/10O2 (LNTMO15), and
Li1.2Ni1/3Ti1/3Mo2/15O2 (LNTMO20): insets are the a-lattice parameters of the compounds
17
emission spectroscopy.
Figure 3-3 Rietveld refinements on the XRD patterns of (a) LiNi0.5Ti0.5O2 [LNTO], (b)
Li1.05Ni11/24Ti11/24Mo1/30O2 [LNTMO5] (c) Li1.1Ni5/12Ti5/12Mo1/15O2 [LNTMO10], (d)
Li1.15Ni3/8Ti3/8Mo1/10O2 [LNTMO15], and (d) Li1.2Ni1/3Ti1/3Mo2/15O2 [LNTMO20]: structural
parameters from the refinements are listed in Table 3-2.
Table 3-2 Structural parameters from the Rietveld refinements in Figure 3-3: crystallographic information file of Fm-3m LiFeO2 was first used as an input file. The atomic occupancies were
initially set to the atomic ratio obtained from the elemental analysis by direct current plasma emission spectroscopy, based on which the lattice parameters were initially refined. Then, we further refined the lattice parameters and the atomic occupancies simultaneously: TM
occupancies were first refined, and then Li occupancy was refined. O occupancy did not change after the refinement.
Figure 3-4 Scanning electron microscope (SEM) images of LNTO, LNTMO5, LNTMO10, LNTMO15, LNTMO20, and high-energy ball-milled LNTMO20 (HB-LNTMO20)
Figure 3-5 (a) The first-cycle voltage profiles of LNTO, LNTMO5, LNTMO10, LNTMO15 and LNTMO20 [1.5−4.5 V, 20 mA/g], and (b) 20-cycle capacity retention of the compounds.
Figure 3-6 The voltage profiles for 10 cycles of (a) LNTO, and (b) LNTMO20 [1.5−4.5 V, 20 mA/g, room temperature].
Figure 3-7 The voltage profiles of (a) LNTO and (b) LNTMO20 when charged and discharged once at 10 mA/g, and then at 20, 40, 100, 200, and 400 mA/g for the subsequent cycles.
Figure 3-8 (a) The first discharge voltage profile of LNTMO20 from a galvanostatic intermittent titration test after charging to 270 mAh/g: the inset zooms in the time range
between 240 h and 270 h. (b) The voltage profile of LNTMO20 when charged-discharged three times between 2.0−4.1 V (black) then between 1.5−4.5 V (blue) at 20 mA/g.
18
Figure 3-9 (a) The In situ XRD patterns of LNTMO20 upon two galvanostatic
charge-discharge cycles between 1.5−4.8 V at 10 mA/g (b) The corresponding voltage profile (c) and the a-lattice parameter from single phase XRD refinements are shown. (d) The (002) peak is zoomed in for the intensity comparison.
Figure 3-10 The X-ray absorption near-edge structures of (a) Ni, (b) Ti, and (c) Mo in LNTMO20 before cycle [black], after the first charge to 4.8 V [blue, ~300 mAh/g charged], and after the first discharge to 1.5 V [red, ~250 mAh/g discharged] at 20 mA/g.
Figure 3-11 Electron energy loss spectra of Ti L-edge and O K-edge in LNTMO20 before cycling [black] and after 20 cycles between 1.5−4.5 V [red] at 20 mA/g: the inset focuses on the Ti L-edges.
Figure 3-12 The first-cycle cyclic voltammetry profiles of LNTMO20 when voltage-swept between 1.5−4.5 V [black solid] and 1.5−4.1 V [red dash] at 0.1 mV/s.
Figure 3-13 Back-of-the-envelope calculation: Average Mo oxidation state expected after the first charge to 300 mAh/g then discharge to 250 mAh/g as a function of the oxygen-loss capacity during the first charge. It was assumed that Ni, Ti, and O stay as Ni2+, Ti4+, and O 2-after the first discharge, and that there is no loss in the TM content during the first cycle.
Figure 3-14 The calculated energies of densified Li0.52Ni0.37Ti0.37Mo0.15O2 structures and
Li0.47Ni0.33Ti0.33Mo0.13O1.8 structures with oxygen vacancies: From the plot, it is seen that the
energies of the densified Li0.52Ni0.37Ti0.37Mo0.15O2 structures are lower than those of
Li0.47Ni0.33Ti0.33Mo0.13O1.8 structures with oxygen vacancies. This indicates that oxygen loss
with densification is thermodynamically more favorable than that with oxygen vacancies in the lattice.
Figure 3-15 (a) The voltage profiles of Li1.2-xNi0.33Ti0.33Mo0.13O2: The black curve is an
experimental profile from the galvanostatic intermittent titration test (GITT) during the first charge, and the red line is calculated voltage profile of Li1.2-xNi0.33Ti0.33Mo0.13O2 that assumes
19
no oxygen loss during the first charge: the dotted red arrows specify the region of Ni oxidation and O oxidation. Finally, the dashed blue line indicates the oxygen-loss potential of Li
1.2-xNi0.33Ti0.33Mo0.13O2-y. (b) The calculated contribution of Ni [black] and oxygen [red] oxidation
upon delithiation in Li1.2-xNi0.33Ti0.33Mo0.13O2 when no oxygen loss is assumed (the red curve in
Figure 3-15a)
Figure 3-16 (a) The voltage profiles of Li1.11-xNi0.37Ti0.37Mo0.15O2. (b) The average net moments
of Ni, Ti, Mo and oxygen ions in Li1.11-xNi0.37Ti0.37Mo0.15O2 (x = 0, 0.074, 0.148, 0.222, 0.296,
0.370, 0.444, 0.519, 0.593, 0.667, 0.741, 0.815, 0.889, 0.963 and 1.037).
Figure 3-17 Proposed first charge mechanism of LNTMO20: Ni2+/Ni~3+ oxiation, oxygen loss, and oxygen oxidation largely in sequence. The voltage profile of LNTMO20 from the in situ XRD test and the corresponding a-lattice parameters from single-phase XRD refinements are overlayed.
Figure 3-18 Illustrations of a LNTMO20 particle before and after oxygen loss with
densification near the surface: oxygen loss with densification reduces the Li-excess level, and thus decreases the 0-TM capacity.
20
---Part I---
21
1.1 Motivation
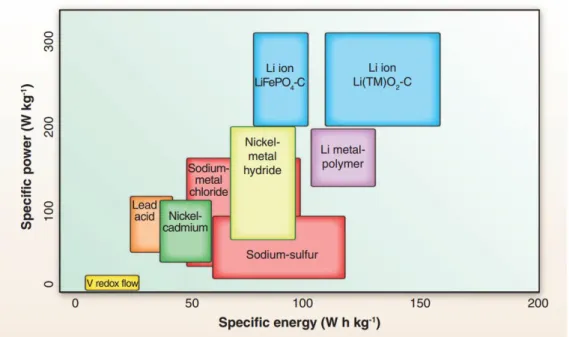
Sustainable growth of our modern society requires clean energy production, storage, and transport. For the energy storage, rechargeable lithium batteries (i.e. Li-ion batteries) have played an irreplaceable role as they outperform the other types of technologies in terms of energy densities and power densities (Fig. 1-1).1,2 Due to their great performance, the Li-ion batteries have enabled many of the convenience of modern life, powering increasingly capable electronics. However, as the batteries are requested for more complex technologies where higher power consumptions are required, such as for electric vehicles and grid energy storage, the demand for higher performance Li-ion batteries has been ever increasing.2–6
Figure 1-1 Gravimetric power and energy densities for different rechargeable batteries, which are currently being investigated for grid storage applications.2
The development of better Li-ion batteries requires improvements in the electrode materials.1,5 In particular, current cathode materials do not satisfy all desired characteristics for
22
high-performance Li-ion batteries, including energy density, rate capability, safety, cycle life, cost, and toxicity.5 Hence, the development of novel cathode materials is critical for the design of high-performance Li-ion batteries for future applications such as in grid storage and long-range electric vehicles, thereby our society can grow sustainably and continuously.2,3,6
1.2 Overview of rechargeable lithium batteries
Figure 1-2 Schematic description of Li-ion batteries: reversible shuttling of Li+ ions between the cathode and the anode enables Li-ion batteries.
The Li-ion batteries are electrochemical energy storage devices that operate by shuttling Li+ ions and electrons between the cathode and the anode both of which serve as a reservoir for Li (Fig. 1-2).5,7–9 They are composed of three main components: the cathode, the anode, and the electrolyte. The cathode and anode are the positive and negative electrodes, respectively, where oxidation and reduction occur during charge and discharge.5,7 The electrolyte is an ionic
23
anode. Upon charge, an external power supply is applied to convert electrical energy into chemical energy, transferring Li+ ions (through the electrolyte) and electrons (through an external circuit) from the cathode to the anode, for example, with the following reactions:4,5,9
(1) Cathode: LixMOy (cathode) σ Li+ (electrolyte) + σ e- + Lix-σMOy (cathode)
(2) Anode: σ Li+ (electrolyte) + σ e- + σ C6 (anode) σ LiC6 (anode)
During charge, oxidation and reduction occurs at the cathode and anode, respectively. Upon discharge, the reverse reactions occur, thus Li+ ions and electrons migrate from the anode to the cathode. Concurrently, reduction and oxidation occurs at the cathode and anode, respectively, releasing chemical energy into electrical energy.
In commercial Li-ion batteries, graphite is typically used as the anode, which allows intercalation of Li+ ions between its sheets to form LiC6.4 The cathode usually is composed of a
cathode material from inorganic compounds with transition metal ions as redox active species, carbon black to enhance electronic conductivity, and a polymeric binder such as poly
tetrafluorethylene (PTFE). The electrolyte typically consists of Li salts, such as LiPF6,
dissolved in organic solvents, such as ethylene carbonate (EC) with dimethyl carbonate (DMC).7,10,11
One of the greatest aims in the Li-ion battery research is to develop very high energy density Li-ion batteries. The energy density of a battery is defined as the energy per unit weight or volume, which is equal to the product of the cell voltage and specific capacity.5,12 Voltage of a Li-ion battery whose cathode and anode are both intercalation compounds for Li is
determined by the difference in the chemical potential of Li in the cathode and the anode:5,12 V = −µLi(𝑐𝑎𝑡ℎ𝑜𝑑𝑒) − µLi(𝑎𝑛𝑜𝑑𝑒)
𝐹
In most commercial Li-ion batteries, LiCoO2 and graphite are used as the cathode and the
24
The specific capacity of Li-ion batteries is determined by the cyclable Li content per unit weight or volume.5 As both cathode and anode are intercalation compounds for Li ions, the specific capacity of a battery depends on those of both electrodes. The specific capacity of an intercalation electrode can be calculated using the following equation:
Specific capacity = 𝛥𝑥·𝐹
𝑀
×
1000
3600 [mAh/g]
where Δx is the number of moles of Li that can reversibly inserted/extracted in and out of the electrode structure within a designated voltage window. M is the molar mass of the electrode compound. Finally, F is the Faraday constant. As can be inferred from the above formula, a high specific capacity of an electrode requires a light electrode material (small M) that can reversibly store and release a large amount of Li+ ions (high Δx).
High power density (or high rate capability) is also a highly desired property of Li-ion batteries, particularly for high-power applications such as for electric vehicles or power
tools.13,14 The power density of a battery is defined as the battery power per unit weight, which is the product of the current and the cell voltage.13 The power density is determined by the cell resistances from various factors such as mass transfer resistance of electrodes (related to Li diffusion), charge-transfer resistance at the electrode/electrolyte interface (related to solvation and desolvation of Li salts), and electric resistances (related to ionic conduction) in the electrolyte.8,13,14 A battery with large resistances will have a poor rate capability, and a large portion of the chemically stored energy will dissipate into heat upon discharge.
Cycle life, cost, and safety are the other desired properties of Li-ion battery.8 Cycle life is defined as the number of charge-discharge cycles that can be performed before the specific capacity decreases below a certain cut-off limit. Using Li-ion batteries for a while, many kinds of side reactions can occur, which can build up internal resistances on the batteries. Also, the crystal structures of electrode materials can change during cycling, adding resistances as well.
25
Such increase in the resistances can lead to poor cycle life.8 Low cost is also very critical for successful Li-ion batteries, because the cost determines the economic viability of a battery.8 The deployment of electric vehicles has been slow because of the high cost of Li-ion batteries, resulting in no advantages of buying the electric vehicles instead of conventional gasoline
vehicles.15 The cost of a battery will decrease as processing cost and materials’ cost decrease. The performance of the Li-ion batteries is largely determined by the properties of
electrode materials. Thus, the search for better cathode/anode materials has been intense.4,5,8 Electrode materials for high performance Li-ion batteries should have the following
characteristics. First, the materials should have a stable and sturdy crystal structure with many available Li sites to reversibly store and release a large amount of Li+ ions. Second, the
material’s (molar) mass should be light such that the charge-storage capacity per unit weight can be high. Third, the Li-intercalation potential of the electrode material should be within a voltage window of an electrolyte for safety.5,8 Within an acceptable voltage window, high (low) intercalation potential is preferred for a cathode (anode) material, because it will result in high voltage thus high energy densities. Fourth, Li diffusion should be facile in the crystal structure, allowing for fast Li (de)intercalation reaction with negligible resistances.13,14 Fast Li diffusion is critical to achieve high energy densities and high rate capability from an electrode material and thus from a battery. Finally, the electrode materials should be thermally safe (stable) such that they do not release oxygen and heat at a high temperature. Oxygen evolution is an exothermic reaction, and thus can substantially increase temperature inside a battery. With oxygen gas, high temperature, and a flammable organic electrolyte, a Li-ion battery can catch fire, which must be prevented for safety.16,17
26
1.3 Layered lithium transition metal oxides for
Li-ion battery cathodes
While all components are important in Li-ion batteries, the cathode has been the limiting component on the current stage of Li-ion battery technology. This is because the cathode is the major factor that determines the energy density, rate capability, safety, and cost of Li-ion batteries.5,8 As the cathode materials, intercalation compounds have been most widely used due to their peculiar ability to accommodate Li+ ions over large concentration intervals.
Figure 1-3 Illustrations of the crystal structure of (a) a layered Li-TM oxide, (b) a spinel Li-TM oxide, and an olivine LiMPO4 (M = Fe, Mn etc.)
Today, three types of intercalation cathodes are being intensively studied, so called layered (rocksalt-type) lithium transition metal oxides (Li-TM oxides),18–24 spinel-type Li-TM oxides,25–30 and olivine LiMPO4 (M = Fe, Mn etc.) (Fig. 1-3).14,31–37 While each class has its
own strength, none of them are perfect. For example, Li-excess layered oxides offer the highest capacity (> 220 mAh/g) and energy density (~900 Wh/kg), but are less safe than other types of cathode materials.38–45 On the other hand, spinel-type oxides have excellent rate capability but
27
with low specific capacity (~100 mAh/g), low energy density, and poor cycle life at high temperature.25,27,30,46–49 Finally, olivines such as LiFePO4 are cheap, safe and have excellent
cycle life and rate capability, but with low gravimetric and volumetric energy densities (590 Wh/kg, 2000 Wh/l) due to their low density (~3.4 kg/l) and low average voltage (~3.5 V vs. Li/Li+).14,16,32,33
Among the cathode materials, the layered Li-TM oxides have been the most successful class, delivering high capacities, high volumetric, and gravimetric energy densities.40,41,50 The layered Li-TM oxide consists of close-packed oxygen planes that are stacked with the ABC stacking. Between the oxygen planes, layers of TM ions are alternating with layers of Li ions.13,51 TM ions in the TM layers can release or take electrons by redox reactions. Li layers are where Li ions are stored and Li diffusion takes place. Many commercial Li-ion batteries adopt cathode materials from the layered oxides.
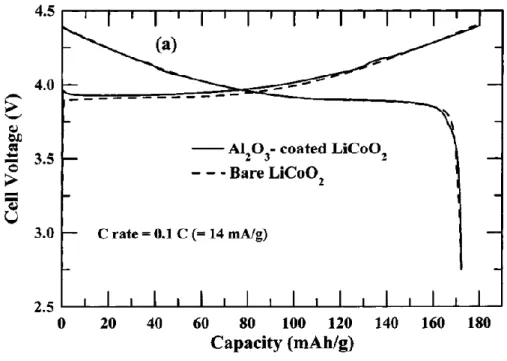
Figure 1-4 The first-cycle voltage profile of bare and coated LiCoO2 when cycled between
28
LiCoO2 and LiNiO2 were the first to be investigated as cathode materials.19,21,52–57 In
particular, LiCoO2 was the cathode material in one of the first commercially successful Li-ion
batteries, and has been used most widely until now. LiCoO2 delivers a high gravimetric
(~600 Wh/kg) and volumetric (~3000 Wh/l) energy density due to its high voltage (~3.9 V) and high density (5 kg/l) (Fig. 1-4). Nevertheless, high cost of cobalt, a limited specific capacity from LiCoO2 (~160 mAh/g) and poor thermal safety have encouraged researchers to search for
the other types of layered Li-TM oxides to replace LiCoO2.20,43
To develop layered cathode materials that outperform LiCoO2 both in performance and
cost, Li(Ni/Mn/Co/Al)O2 have been intensively studied, in which TM layers are occupied
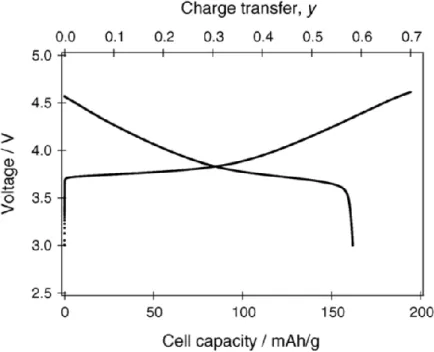
mixed TM ions of Mn, Ni, Co and Al. In particular, LiNi1/3Mn1/3Co1/3O2, LiNi0.5Mn0.5O2, and
LiNi0.8Co0.15Al0.05O2 have been most intensively studied (Fig. 1-5).13,22,58 They deliver high
energy densities (~700 Wh/kg) and specific capacities (~180 mAh/g). Furthermore, they are cheaper than LiCoO2 as well, because they contain less cobalt which is expensive. Thus, the
second generation Li-ion batteries use one of the materials as the cathode material.
Figure 1-5 The first-cycle voltage profile of LiNi1/3Mn1/3Co1/3O2 with a current density of
29
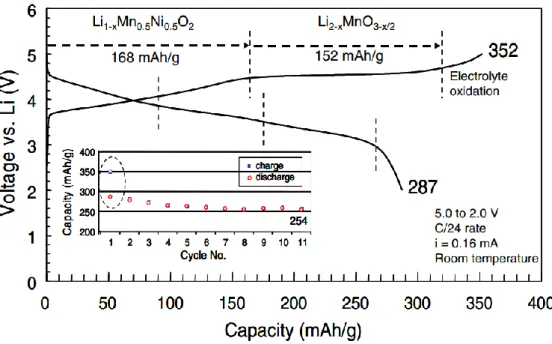
While most of the traditional layered materials are stoichiometric materials, there have been great efforts to achieve very high capacities and energy densities from Li-excess layered materials.40,45,59,60 Here, Li-excess refers to a composition in which the number of Li sites is greater than that of TM sites (x > 1 in LixTM2-xO2). In particular, many high capacity materials
have been designed out of solid-solution compounds (or nano-composite compounds) between Li(Li1/3Mn2/3)O2 and Li(Ni/Mn/Co)O2.40,41,59–61 These materials can cycle more than
250 mAh/g at an average voltage of ~3.6 V, delivering a high energy density (~ 900 Wh/kg) (Fig. 1-6). Nevertheless, their crystal structures evolve during cycling, leading to voltage fading.41,62–64 Such evolution of the voltage profile is undesirable for Li-ion batteries, because the state of charge cannot be determined if a voltage profile evolves during cycling. Therefore, substantial efforts have been made to stabilize the crystal structure of the Li-excess materials.62 Moreover, the rate capability (i.e. power density) of the materials is moderate, which needs improvement.65
30
1.4 Ordering paradigm for the oxide cathodes
As we have discussed, nearly all high energy density cathode materials have been sought from well-ordered close-packed oxides, such as layered Li-TM oxides or spinel-type Li-TM oxides. In these ordered materials, Li sites and pathways (a 2D slab in the layered oxides and a 3D network of tetrahedral sites in the spinels) are separated from the TM sublattice, which provides stability and electron storage capacity.13,30
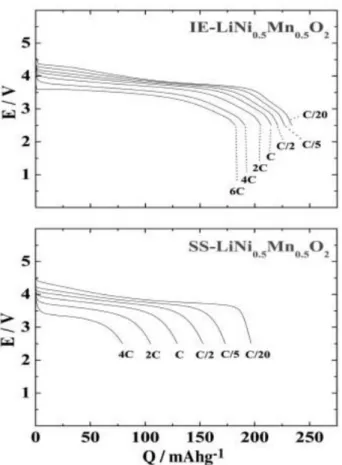
Having well-ordered structures where there is little or no intermixing between the Li and the TM sublattice is generally considered critical to obtain high-capacity cathode materials with good cycle life.7,8 In some cases, improvements in cation ordering have notably improved the power or energy density.13,66–68 Figure 1-7 shows an example of the effect of cation
(dis)ordering to the performance of the ordered oxides.13 In general, LiNi0.5Mn0.5O2 forms into
a slightly cation-mixed layered structure in which ~ 9 % of Li sites are occupied by TM ions (accordingly ~9 % TM sites are occupied by Li ions) when standard high-temperature solid state methods are applied for synthesis. In 2006, Kang et al. demonstrated that removing the cation mixing by ion-exchange dramatically improves the performance of the layered LiNi0.5Mn0.5O2.13 The ion-exchanged layered LiNi0.5Mn0.5O2 has almost a perfectly layered
structure with negligible cation mixing, and shows much higher capacity and better rate capability than a standard LiNi0.5Mn0.5O2 with a partially cation-mixed layered structure.13
Such improvement largely originates from that Li diffusion tends to be faster in a cation-ordered structure than in a (partially or fully) cation-discation-ordered structure.
In general rocksalt-type oxides, both Li and TM ions occupy a cubic close-packed lattice of octahedral sites, and Li diffusion proceeds by hopping from one octahedral site to
31
Figure 1-7 The discharge profile at various C rates for the ion-exchanged (IE)-LiNi0.5Mn0.5O2
(above) and sold state (SS)-LiNi0.5Mn0.5O2 (below). In the test, the cell was charged at C/20 to
4.6 V, then held at 4.6 V for 5 hours and discharged at different rates. 1C corresponds to 280 mA/g.13
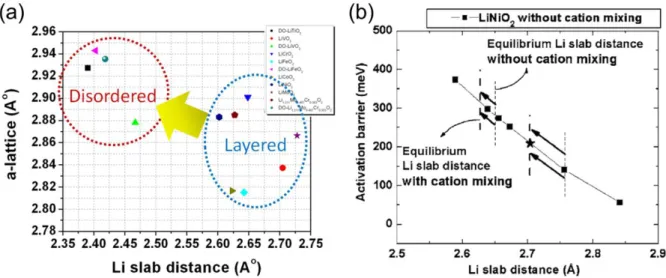
another octahedral site via an intermediate tetrahedral site.51,69 Li in the intermediate tetrahedral site is the activated state in Li diffusion. The activated tetrahedral Li ion shares faces with four octahedral sites: the site previously occupied by the ion itself; the vacancy it will move into; and two sites that can be occupied by Li, TM, or a vacancy. The energy in this site, which reflects the Li migration barrier, is largely determined by electrostatic repulsion between the activated Li+ ion and its face-sharing species, and thus depends on (i) the valence of the face-sharing species and (ii) the available space for relaxation between the activated Li+ ion and the face-sharing species.13,51,68 This space is measured as the Li slab distance in layered structures or more generally as the height of the tetrahedron along which the relaxation
32
Figure 1-8 (a) The octahedral to tetrahedral to octahedral Li diffusion in general rocksalt-type Li-TM oxides (b) The 1-TM channel in stoichiometric Li-TM oxides.70
As electrostatic repulsion on an activated Li+ ion is too strong when there are two face-sharing cations, Li dominantly diffuses with the divacancy mechanism, involving a second vacancy beside the vacancy the migrating Li will move into.13,51,69,70 In rocksalt-type Li-TM oxides, two kinds of diffusion channels support this mechanism: 0-TM channels, involving no face-sharing TM ion, and 1-TM channels, involving one face-sharing TM ion.70–72 Note that in the traditional stoichiometric layered Li-TM oxides such as LiCoO2, Li diffusion takes place
through the 1-TM channels only.
In general, cation disorder (i.e. cation mixing) limits Li diffusion in the layered (rocksalt-type) oxides, inhibiting Li cycling from the layered materials.13,66,68,73 The negative effect of cation mixing on Li diffusion has been understood to originate from the following reasons. First, cation mixing greatly decreases the relaxation space (i.e. Li slab distance or tetrahedron height) for an activated Li+ ion against a face-sharing species upon Li migration, increasing the electrostatic energy in the activated state and thus the Li diffusion barrier (Fig. 1-9).13,70 Moreover, some people have argued that TM ions in Li layers can physically block the Li diffusion paths as well.74
33
Figure 1-9 (a) The decrease in the Li slab distance (tetrahedron height) by cation mixing: the layered structure has much larger Li slab spacing than the cation-disordered structure.70 (b) The calculated activation barrier for Li migration in LiNiO2 with cation mixing (stars) and without
cation mixing (squares).51 The Li slab distances with and without cation mixing are indicated with thick and thin dashes at different Li contents, respectively. The shift on the left is from fully lithiated state and the one on the right is from partially delithiated state.51
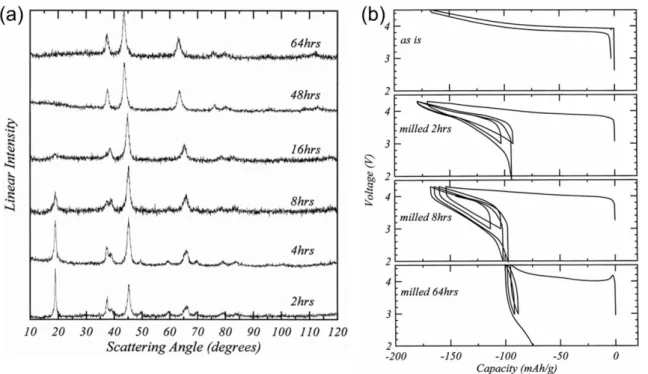
The negative effects of cation disorder have been experimentally demonstrated as well. For example in 1998, Obravac et al. demonstrated that mechanochemical synthesis of cation-disordered LiMO2 (M = Ti, Mn, Co, Ni) is possible with ball milling (Fig. 1-10).75 In their
experiments, increasing the ball-milling time resulted in more severe cation mixing in layered materials such as LiCoO2 and LiNiO2. Then, they demonstrated that the reversible capacity of
layered materials rapidly decreases as their crystal structure changes from a layered rocksalt to disordered rocksalt structure.75 Furthermore, most disordered rocksalt-type Li-TM oxides such as α-LiFeO2 are electrochemically inactive, delivering a limited capacity (Fig. 1-11).75–77 Thus,
only a negligible attention has been given to cation-disordered oxides as cathode materials, based on the experimental observations and the understanding of the negative effects of cation disorder to Li diffusion.
34
Figure 1-10 (a) The X-ray powder diffraction patterns of LiCoO2 powders prepared at high
temperature after subsequent exposure to different milling times. (b) Voltage profiles of cathodes prepared from LiCoO2 samples exposed to different milling times.75
Figure 1-11 (a) Charge-discharge curves of high-temperature α-LiFeO2 and low-temperature
35
1.5 Overview of the thesis
This thesis explores the potential of cation-disordered Li-TM oxides as promising electrode materials for rechargeable Li batteries, enlarging the search space of high-energy density cathode materials to cation-disordered materials.
In the first part, we demonstrate that contrary to the conventional wisdom, cation-disordered materials can be promising electrode materials from the study of novel
Li1.211Mo0.467Cr0.3O2.70 Li1.211Mo0.467Cr0.3O2 forms as a layered rocksalt structure but transforms
almost completely to a disordered rocksalt structure after several cycles. Nevertheless, the reversible capacity of this material is remarkably high, indicating that Li diffusion can be facile in the cation-disordered structure.70 Using ab inito computations, we show that this unexpected behavior is due to percolation of a certain type of active Li diffusion channels (0-TM channels) that are available in disordered Li-excess materials.70,72
In the second part, we apply 0-TM percolation to design a new class of high capacity cation-disordered oxides, Li-excess Ni-Ti-Mo oxides, which deliver both high capacities and high voltage. Combining experiments with ab initio calculations, we investigate their
electrochemical performance, structural changes, and redox mechanism. From the
understandings, strategies to further improve the new materials are presented, providing new guidelines for the design of high-energy density cation-disordered cathode materials for the rechargeable Li batteries.
36
---Part II---
Unlocking the potential of
cation-disordered oxides for
rechargeable lithium batteries
37
2.1 Introduction
Most high-energy density cathode materials for Li-ion batteries have been sought from the well-ordered close-packed oxides, such as layered LiCoO2 and spinel LiMn2O4.8,26,53 In these
ordered materials, Li and TM ions occupy distinct sites such that Li sites and pathways are separated from the TM sublattice which provides stability and electron storage capacity. Having well-ordered structures with negligible mixing between the Li and the TM sublattice is generally considered necessary for obtaining high-capacity cathode materials with good cycle life.13,66 This is largely because Li diffusion tends to be facile in the well-ordered crystal structure, which is critical for achieving high energy and high power densities. As discussed in Part I: Introduction, cation mixing tends to limit Li diffusion because it decreases the Li slab spacing, increasing the Li diffusion barrier.51,68,70 Moreover, randomly distributed TM ions in the cation-disordered structure can physically block Li diffusion paths as well. Therefore, cation-disordered materials are generally disregarded as electrode materials, and have received only a limited attention (Fig. 2-1).
Figure 2-1 Illustration of the layered rocksalt structure and disordered rocksalt structure: cation mixing between Li and TM layers lead to a disordered rocksalt structure, which tends to result in poor cyclability of Li-TM oxides by slowing down Li diffusion.
38
However, in fact there are a few cation-disordered Li-TM oxides with good cycling performance. For example, cation-disordered Li2VO3 can cycle up to 250 mAh/g (Fig. 2-2),78
and recently it has been demonstrated that cation-disordered Li1.3Mn0.4Nb0.3O2 can cycle up to
300 mAh/g as well.79 These results show that Li diffusion can be facile in the cation-disordered structure. By understanding the mechanism how these cation-disordered materials allow for facile Li diffusion, we can design a whole new class of high-capacity cation-disordered materials for rechargeable lithium battery electrodes.
Figure 2-2 The voltage profile of Li2VO3.78
In this part of the thesis, from the study of Li1.211Mo0.467Cr0.3O2 we demonstrate that
cation-disordered materials can be promising electrode materials if they contain enough Li-excess (x > 1.09 in LixTM2-xO2). Li1.211Mo0.467Cr0.3O2 forms into a layered structure, but
transforms to a cation-disordered structure after several charge-discharge cycles. Nevertheless, its reversible capacity is remarkably high, delivering as high as ~265 mAh/g. In this work, we not only demonstrate the high capacity in this material, but also provide a fundamental
39
ab initio calculations. We believe this work unlocks the potential of cation-disordered oxides
for rechargeable lithium batteries.
2.2. Methodology
2.2.1 Experimental methodology
2.2.1.1 Synthesis
To synthesize Li1.211Mo0.467Cr0.3O2 [original target: Li1.233Mo0.467Cr0.3O2], Li2CO3 (Alfa Aesar,
ACS, 99% min), MoO2 (Alfa Aesar, 99%), and Cr3(OH)2(OOCCH3)7 (Alfa Aesar, Cr 24%)
were used as precursors. 5% excess Li2CO3 from the stoichiometric amount required to
synthesize Li1.233Mo0.467Cr0.3O2 was used to compensate for possible Li loss during high
temperature solid state reaction. The precursors were dispersed into acetone and ball-milled for 24 hours, and then dried overnight in an oven. The precursor mixture was pelletized and then fired at 1050°C for 15 hours under argon (Ar) gas, followed by furnace cooling to room
temperature. After firing, the pellets were manually ground into fine powder. From inductively coupled plasma atomic emission spectroscopy (ICP-AES, bomb digestion method), slight Li deficiency (~1.8%) from the target composition was found in the final product
(Li1.211Mo0.467Cr0.3O2). Carbon coating was applied to the Li1.211Mo0.467Cr0.3O2 powder (i) to
prevent transition metal (TM) dissolution (mainly Mo) at high delithiation states (Fig. 2-8), and (ii) to improve the electrochemical properties of Li1.211Mo0.467Cr0.3O2 by decreasing its particle
40
(C12H22O11, EMD, GR ACS), the carbon precursor, was mixed with the Li1.211Mo0.467Cr0.3O2
powder in the weight ratio of 80 (Li1.211Mo0.467Cr0.3O2): 20 (Sucrose) by planetary ball-milling
(Retsch, PM200) for six hours at 300 rpm in Ar-filled jars. Finally, the mixture was annealed at 700°C for three hours under Ar gas to obtain the carbon-coated Li1.211Mo0.467Cr0.3O2 powder.
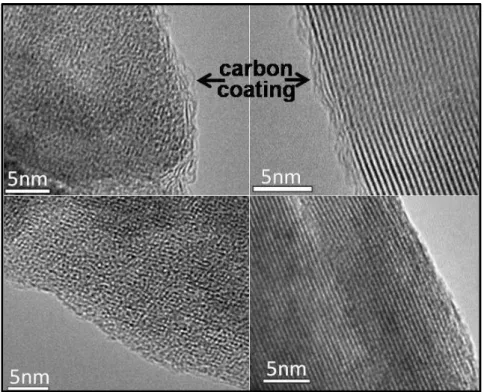
The CHN analysis (combustion method) detected 5.17 wt% of carbon from the carbon-coated Li1.211Mo0.467Cr0.3O2. Figure 2-3 shows the Li1.211Mo0.467Cr0.3O2 particle with and without
carbon coating. As can be seen from the figures, thin layers of amorphous carbon are coated to the Li1.211Mo0.467Cr0.3O2 particle after carbon coating, which are not seen from the pristine
Li1.211Mo0.467Cr0.3O2 particle.
Figure 2-3 High resolution transmission electrons microscopy images in two directions of the carbon-coated Li1.211Mo0.467Cr0.3O2 particle (top), and uncoated Li1.211Mo0.467Cr0.3O2 particle
41
The carbon-coating layers prevent TM dissolution (mainly Mo) from
Li1.211Mo0.467Cr0.3O2 upon cycle. It is known that Mo6+ dissolves into an electrolyte.80 As Mo4+
becomes oxidized to Mo6+ upon charging Li1.211Mo0.467Cr0.3O2, it is necessary to prevent
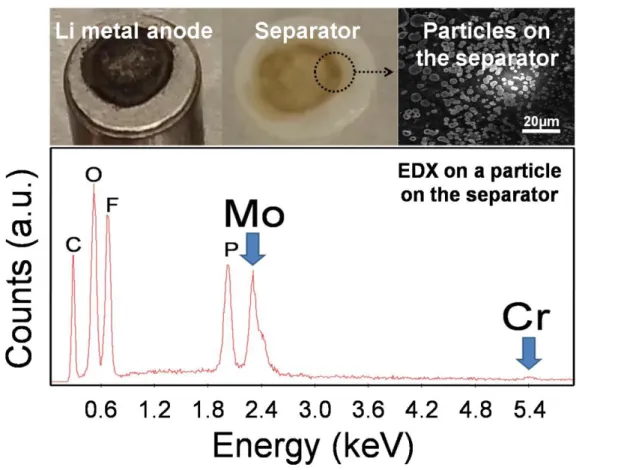
surface from Mo dissolution for stable cycling performance. Figure 2-4 demonstrates how Mo dissolution can be significant if without coating. High energy ball-milled Li1.211Mo0.467Cr0.3O2
was cycled for 100 cycles between 1.5−4.3 V at 164 mA/g at room temperature. After 100 cycles, significant coloration is seen from the Li metal anode and the separators, which are confirmed to be from dissolved Mo compounds based on the energy dispersive X-ray spectroscopy.
Figure 2-4 The two upper left images show a Li metal foil and a separator from a
Li1.211Mo0.467Cr0.3O2 half-cell that was charged/discharged for 100 cycles between 1.5−4.3 V at
164 mA/g at room temperature. The upper right SEM image shows spherical particles on the colored area on the separator (dotted circle). The lower image shows an energy dispersive X-ray spectroscopy (EDS) spectrum of a particle attached to the separator, indicating that the particles from the colored area are composed of Mo and Cr (Mo:Cr = 8.875:1).70
42
However, such Mo dissolution can be retarded with carbon coating.
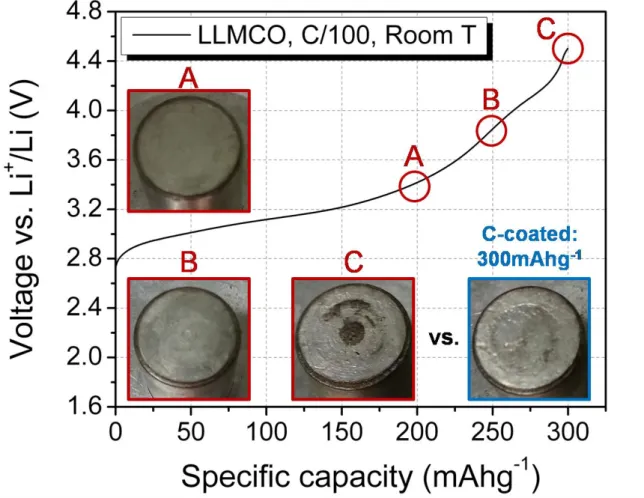
Figure 2-5 shows the Li metal anode of half-cells from uncoated and
carbon-coated Li1.211Mo0.467Cr0.3O2. Without carbon coating, charging to a higher
capacity beyond 250 mAh/g leads to significant Mo dissolution as can be inferred
from the coloration on the Li metal anode. With carbon coating, the coloration
becomes much less, indicating that Mo dissolution is retarded.
Figure 2-5 Li1.211Mo0.467Cr0.3O2 half-cells were disassembled at points A, B, and C on the first
charge voltage profile of Li1.211Mo0.467Cr0.3O2 at 3.2 mA/g. The three inset images with red
boundaries show Li metal anode foils (attached to a current collector rod) from
Li1.211Mo0.467Cr0.3O2 half cells that were disassembled after four days of resting at the first
charge state of A) 200 mAh/g, B) 250 mAh/g, and C) 300 mAh/g. The inset image with a blue boundary shows a Li metal anode foil that was disassembled from a carbon-coated
Li1.211Mo0.467Cr0.3O2 half-cell after four days of resting at the same first charge state of
43
Figure 2-6 The discharge-capacity retention of carbon-coated and uncoated
Li1.211Mo0.467Cr0.3O2 during cycling between 1.5−4.3 V at 16.4 mA/g at room temperature. The
two inset images show Li metal anode foils from uncoated and carbon-coated
Li1.211Mo0.467Cr0.3O2 half-cells after ten cycles. Carbon coating retards transition metal
dissolution, improving the capacity retention of carbon-coated Li1.211Mo0.467Cr0.3O2.70
Preventing Mo dissolution can lead to significant improvement in the
cycle retention of Li1.211Mo0.467Cr0.3O2. Figure 2-6 compares the cycle retention of
Li
1.211Mo
0.467Cr
0.3O
2with and without carbon coating. As can be seen from the
plot, the carbon-coated Li1.211Mo0.467Cr0.3O2 delivers a much higher capacity with
better capacity retention than without carbon coating. The carbon coating process
is further beneficial because during the process the particle size of
Li1.211Mo0.467Cr0.3O2 becomes smaller, improving the reversible capacity by
44
profile of the carbon-coated and uncoated Li
1.211Mo
0.467Cr
0.3O
2when cycled
between 1.5−4.3 V at 32.7 mA/g at room temperature. As can be seen from the
profiles, the reversible capacity is higher for the carbon-coated
Li1.211Mo0.467Cr0.3O2.
This is due to the smaller particle size of the carbon-coated
Li1.211Mo0.467Cr0.3O2than the uncoated
Li1.211Mo0.467Cr0.3O2(Fig. 2-12)
Figure 2-7 The first-cycle voltage profile of the carbon-coated and uncoated
45
2.2.1.2 Electrochemistry
The cathode film was composed of the carbon-coated Li1.211Mo0.467Cr0.3O2 powder (70 wt%),
carbon black (20 wt%) as conductive agent, and polytetrafluoroethylene (PTFE) (10 wt%) as binder. The components were manually mixed for 40 minutes and rolled into a thin film inside an argon-filled glove box. 1M of LiPF6 in 1:1 volume ratio of ethylene carbonate: dimethyl
carbonate (EC:DMC) solution was used as an electrolyte. Celgard 2500 polypropylene separator and Li metal foil were used as the separator and the counter electrode, respectively. The Swagelok cells were assembled inside an argon-filled glove box and tested on a Maccor 2200 at room temperature in galvanostatic mode unless otherwise specified. The loading density of the cathode film was approximately 3.6 mg/cm2. The current density at 1C (= 327.486 mAg-1) was based on the theoretical capacity of Li1.233Mo0.467Cr0.3O2
(= 327.486 mAhg-1). The specific capacity was calculated strictly on the amount of Li1.211Mo0.467Cr0.3O2 (66.318 wt%) in the cathode film.
2.2.1.3 Characterization
The X-ray diffraction (XRD) patterns were collected on a PANalytical multipurpose
diffractometer using Cu Kα radiation in the two-theta range of 5-85°. Kapton film was applied when running XRD on electrode films. Rietveld refinement was done using PANalytical X’pert HighScorePlus software. Scanning electron microscopy (SEM) images were collected on a FEI Phillips XL30 field-emission gun environmental SEM at an accelerating voltage of 15 and 25 kV, respectively. High Resolution Transmission Electron Microscopy (HRTEM)
46
Scanning Transmission Electron Microscopy (STEM) images were recorded with Hitachi HD 2700C 200 kV using 1 Å probe of 28mrad semi-convergence angle and ADF detector with semi-collection angle of 50-28mrad.
2.2.2 Computational methodology
2.2.2.1 Density-functional theory calculations
Structural energies and migration barriers were calculated based on density-functional theory (DFT)81,82 in the generalized-gradient approximation (GGA) using the PBE exchange-correlation functional83 and projector-augmented wave (PAW) pseudopotentials,84,85 as
implemented in the Vienna ab-initio Package (VASP).86,87 A plane-wave cutoff of 520 eV was employed to guarantee numerical convergence in variable-cell calculations. For chromium, a Hubbard-U correction was employed, using the U-value of reference 89 (U= 3.5 eV).88 Gamma centered k-point meshes for the integration of the Brillouin zone were selected to converge energies to 1 meV per formula unit and structural parameters to 10-3 Å . All geometries were fully optimized with atomic forces below 0.01 eV/Å . The climbing-image nudged elastic band (CI-NEB) method was used to compute migration barriers based on five images along the diffusion paths.89–91 All reported migration barriers were converged to 10 meV. The
calculations were conducted for the well-established divacancy diffusion mechanism.51,69 All NEB calculations resulted in diffusion paths that traverse tetrahedral sites, in agreement with the mechanism found in layered oxides.
47
2.2.2.2 Structural model
Structural energies and migration barriers were obtained from structural models containing 72 atoms in the fully lithiated state, i.e., 12 Li2MoO3 formula units and 18 LiCrO2 formula
units, respectively (Fig. 2-8). Cation disorder was imposed by randomly distributing Li and TM ions over all cation sites. For the migration barrier calculations, a divacancy was created in the fully lithiated structure.
Figure 2-8 Structural model of disordered-Li2MoO3: The simulation cell contains 12 formula
units (72 atoms). In the figure, large red balls represent oxygen atoms, and small green and violet balls represent the octahedral sites of lithium and molybdenum, respectively.70
48
2.2.2.3 Percolation simulation
Percolation simulations were conducted following the Monte-Carlo algorithm proposed by Newman and Ziff and employed periodic 8×8×8 supercells of the conventional (4 atom) FCC cell containing 2048 sites and 1000 MC steps per each combination of cation mixing and Li content.92 Percolation was approximated by periodic wrapping in one lattice dimension. Since the wrapping probability is sensitive with respect to the size of the simulation cell, we verified the convergence of the percolation threshold for the limit of fully disordered structures,
corresponding to 100% cation mixing in Figure 2-9a. As evident from Figure 2-9A, the
inflection point of the wrapping probability rapidly converges with the cell size and therefore is a good estimate for the percolation probability even in small simulation cells. Finite size effects are less pronounced for the accessible lithium contents above the percolation threshold, as shown in Figure 2-9b.
Figure 2-9 0-TM wrapping probability (a) and accessible lithium fraction (b) as a function of the Li-excess level for different FCC supercell sizes. Results for fully disordered structures are shown. The legends refer to supercells of the primitive FCC unit cell.70
49
2.3 Experimental results
2.3.1 Characterization of the as-synthesized Li
1.211Mo
0.467Cr
0.3O
2As-synthesized Li1.211Mo0.467Cr0.3O2 has a layered rocksalt structure, which can be inferred
from its XRD pattern in Figure 2-10. In this material, layers of Li and of Li-Mo-Cr are alternating in the oxygen cubic close-packed framework. The XRD refinement on the as-synthesized Li1.211Mo0.467Cr0.3O2 shows no cation mixing between the Li and the Li-Mo-Cr
layers, indicating that this material forms into a well-layered structure.
Figure 2-10 Rietveld refinement on the XRD pattern of pristine Li1.211Mo0.467Cr0.3O2 powder.
The atomic ratio between elements was first set to the ICP result, and then Mo and Cr
occupancy in Li and TM layers were refined. The refinement suggests no transition metals in Li layers at all. Li occupancy was refined after Mo and Cr occupancy had been determined.70
While Li1.211Mo0.467Cr0.3O2 is targeted to be a solid-solution compound between
Li(Li1/3Mo2/3)O2 (i.e. Li2MoO3) and LiCrO2, one can suspect local phase-separation of
Li1.211Mo0.467Cr0.3O2 into domains of Li(Li1/3Mo2/3)O2 and LiCrO2. However, neither in XRD
50
(~14.91 Å) and LiCrO2 (~14.43 Å) are quite different from each other. Thus, if there were such
distinct domains, the XRD signature near 18.4o from LiCrO2 (in blue in Figure 2-11a) would
be visible in the diffraction pattern of Li1.211Mo0.467Cr0.3O2. However, such feature is not
observed in the XRD pattern of Li1.211Mo0.467Cr0.3O2 (black). In addition, the electron
diffraction pattern along ZA [010] of pristine Li1.211Mo0.467Cr0.3O2 in Figure 2-11b shows a
single phase, which further excludes the existence of small LiCrO2 domains (< 5 nm) beyond
the detectability of XRD. Hence, all the evidence points towards a single solid solution.
Figure 2-11 (a) The (003) peak in the XRD pattern on Li1.211Mo0.467Cr0.3O2 [black] and that of
LiCrO2 [blue] (b) The electron diffraction pattern along ZA[010] of Li1.211Mo0.467Cr0.3O2.
The scanning electron microscopy (SEM) images show that the primary particles around 200 nm in diameter are highly agglomerate in the as-synthesized Li1.211Mo0.467Cr0.3O2,
and the primary particle size decreases to around 100 nm after the carbon-coating process (Fig. 2-12). The decrease in the particle size can also be inferred from the change in the XRD
51
Figure 2-12 The broader XRD peaks of the carbon-coated Li1.211Mo0.467Cr0.3O2 powder (lower
left) compared to the sharper XRD peaks of pristine Li1.211Mo0.467Cr0.3O2 powder (upper left)
indicate that the carbon-coated Li1.211Mo0.467Cr0.3O2 particles are smaller than the uncoated
particles. Furthermore, SEM images (right) confirm that the particles of the carbon-coated Li1.211Mo0.467Cr0.3O2 are smaller than those of uncoated one. During the carbon coating process,
sucrose (carbon precursor) and the Li1.211Mo0.467Cr0.3O2 powder were mixed in a planetary
ball-mill for six hours at 300 rpm, resulting in smaller particles after carbon coating.70
2.3.2 The electrochemical properties of Li
1.211Mo
0.467Cr
0.3O
2Figure 2-13 shows the voltage profile of the carbon-coated Li1.211Mo0.467Cr0.3O2 when cycled
between 1.5−4.3 V at the rate of 16.4 mA/g at room temperature. From the profile, we find a very high capacity of ~265 mAh/g, corresponding to cycling ~1 Li per formula unit of
Li1.211Mo0.467Cr0.3O2. Considering that conventional well-layered materials show a capacity of
52
high. The gravimetric energy density of this material is also promising (~660 Wh/kg), which exceeds those of the conventional cathode materials such as LiCoO2 (~590 Wh/kg), LiMn2O4
(~480 Wh/kg), and LiFePO4 (~595 Wh/kg).14,26,57 From the voltage profile, we find that the
first-charge profile is different from those of further cycles. This indicates that the crystal structure of Li1.211Mo0.467Cr0.3O2 changes during the first charge.
Figure 2-13 The voltage profile of the carbon-coated Li1.211Mo0.467Cr0.3O2 when cycled
53
Figure 2-14 The 10-cycle voltage profiles of the carbon-coated Li1.211Mo0.467Cr0.3O2 when
cycled between 1.5−4.3 V at the rate of (a) 4.1 mA/g, (b) 8.2 mA/g, and (c) 16.4 mA/g at room temperature (d) Corresponding specific capacity vs. cycle number plot.70
The rate capability of the carbon-coated Li1.211Mo0.467Cr0.3O2 is also promising. Figure
2-14a, 14b, and 14c shows the 10-cycle voltage profiles of the carbon-coated
Li1.211Mo0.467Cr0.3O2 when cycled between 1.5−4.3 V at the rate of 4.1 mA/g, 8.2 mA/g and
16.2 mA/g, respectively. From the profiles, we find a gentle decrease in the reversible capacity with increasing rates. The carbon-coated Li1.211Mo0.467Cr0.3O2 still shows a high capacity above
200 mAh/g at 4.1 mA/g, indicating that the rate capability of this material is promising. The cycle retention of Li1.211Mo0.467Cr0.3O2 is also promising. During 10 cycles, the average loss of
the discharge capacity per cycle is ~2 mAh/g, which is reasonably good for a new material without any significant engineering (Fig. 2-14d). As the rate further increases, the reversible
54
capacity further decreases (Figs. 2-15 and 2-16). Nevertheless, the carbon-coated
Li1.211Mo0.467Cr0.3O2 can still deliver as much as 135 mAh/g at a very high rate of 1300 mA/g
(4C rate).
Figure 2-15 The voltage profile of the carbon-coated Li1.211Mo0.467Cr0.3O2 when cycled
between 1.5−4.3 V at a rate of C/10, C/2, 1C, 2C, 4C and 10C (1C = 327 mA/g)
Figure 2-16 Capacity retention of the carbon-coated Li1.211Mo0.467Cr0.3O2 when cycled between