HAL Id: hal-02395119
https://hal.archives-ouvertes.fr/hal-02395119
Submitted on 5 Dec 2019
HAL is a multi-disciplinary open access
archive for the deposit and dissemination of
sci-entific research documents, whether they are
pub-lished or not. The documents may come from
teaching and research institutions in France or
abroad, or from public or private research centers.
L’archive ouverte pluridisciplinaire HAL, est
destinée au dépôt et à la diffusion de documents
scientifiques de niveau recherche, publiés ou non,
émanant des établissements d’enseignement et de
recherche français ou étrangers, des laboratoires
publics ou privés.
To cite this version:
Maeva Leitwein, Maud Duranton, Quentin Rougemont, Pierre-Alexandre Gagnaire, Louis Bernatchez.
Using Haplotype Information for Conservation Genomics. Trends in Ecology and Evolution, Elsevier,
2019, �10.1016/j.tree.2019.10.012�. �hal-02395119�
Review
Using Haplotype Information for Conservation
Genomics
Maeva Leitwein,
1,3,*
Maud Duranton,
2,3Quentin Rougemont,
1,3Pierre-Alexandre Gagnaire,
2,4and Louis Bernatchez
1,4The particular combinations of alleles that define haplotypes along individual chromosomes can be determined with increasing ease and accuracy by using current sequencing technolo-gies. Beyond allele frequencies, haplotype data collected in population samples contain infor-mation about the history of allelic associations in gene genealogies, and this is of tremendous potential for conservation genomics. We provide an overview of how haplotype information can be used to assess historical demography, gene flow, selection, and the evolutionary out-comes of hybridization across different timescales relevant to conservation issues. We address technical aspects of applying such approaches to nonmodel species. We conclude that there is much to be gained by integrating haplotype-based analyses in future conservation genomics studies.
The Potential of Haplotypes for Conservation Biology
Societal recognition of global biodiversity and the dramatic erosion caused by human activity is rela-tively recent [1]. The emergence of conservation biology in the early 1980s [2] has given birth to a crisis discipline that aims to propose strategies to curb biodiversity loss [3]. Conservation genetics ap-proaches contribute to these efforts by documenting levels of genetic variation within and among populations to estimate key evolutionary parameters [4]. By contributing to a better assessment of the demography and evolutionary potential of wild populations, this field now plays a major role in species conservation and management [5].
The development of next-generation sequencing (NGS) technologies and the ensuing availability of whole-genome polymorphism data has moved the field from conservation genetics to conserva-tion genomics [6,7]. The increased number of neutral markers has enabled a more accurate estima-tion of effective populaestima-tion size (Ne, seeGlossary) and migration rate (m) [6], two fundamental
pa-rameters in conservation biology. For instance, populations with a small Ne have increased
homozygosity for partially recessive deleterious mutations, and are therefore more susceptible to inbreeding depression [8,9]. In addition, small populations usually accumulate more deleterious mutations when drift prevails over selection [7]. This may synergistically interact with demography to cause extinction through a mutational meltdown process [10]. Similarly, genomic data now pro-vide more robust estimates of migration rates and intergenerational dispersal distances to address genetic connectivity [11,12]. When immigrants effectively transmit their genes following dispersal into a recipient population, the resulting gene flow may either promote or counteract local adaptation [13], increase or mask genetic load [14], erode species boundaries [15], or have potential long-term effects through adaptive or maladaptive incorporation of foreign genetic material [16].
Natural and human-induced gene flow between divergent evolutionary lineages can result in genetic admixture or introgression [17,18]. Such exchanges of foreign genetic material raise several conservation and management questions [19], especially when they occur between wild and domesticated populations [20], or between endangered and nonendangered species [21]. Population genomic studies have been addressing these issues with increasing power over the past decade [5], but did not fully exploit the information contained in linkage disequilibrium (LD) among neighboring markers [22]. Recently, however, some studies started to use microhaplo-types to increase the accuracy of individual assignment, relatedness, and population structure inference [23,24].
1Institut de Biologie Inte´grative et des
Syste`mes (IBIS), Universite´ Laval, Que´bec, Canada
2ISEM, Univ Montpellier, CNRS, IRD,
Montpellier, France 3Co-first authors 4Co-last authors *Correspondence: [email protected]
Highlights
Access to genome-wide genotype data has recently catalyzed new avenues of conservation genomics and biodiversity research. However, the rich information pro-vided by linkage disequilibrium among genotypes at linked loci remains largely underexploited in the context of conservation genomics.
Retrieving haplotype information within populations substantially improves the estimation of numerous parameters of relevance for conservation that pertain to population demography, gene flow, and selection.
Haplotype data also contribute to understanding the consequences of genetic admixture by character-izing the genomic mosaic of local ancestry. This allows dissection of variation in introgression rates across the genome, thus casting light on the evolutionary processes that shape genome-wide ancestry.
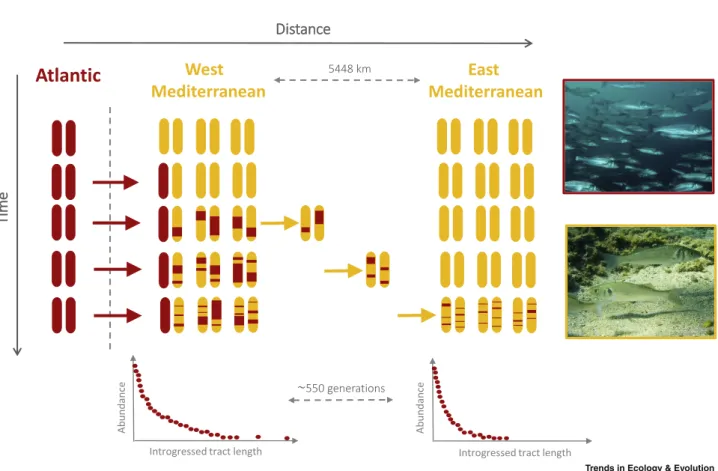
On a broader genomic scale, analyzing the particular combinations of alleles that define haplotypes along individual chromosomes represents an important, but untapped, source of information to deci-pher the complex interplay of evolutionary forces shaping genetic variation across the genome. The signal classically obtained from allele frequencies ignores LD information (we term this the ’ver-tical signal’ to reference the way in which allele frequencies are read in sequence alignments). By contrast, the signal contained in haplotype data captures the information of LD among neighboring sites along the genome (termed the ’horizontal signal’ to illustrate how haplotypes appear in sequence alignments), which provides a better understanding of the demographic and selective pro-cesses that influence genetic diversity and population structure [19]. For example, the use of the hor-izontal signal contained in admixture tracts allowed Duranton et al. [25] to estimate dispersal distance in a Mediterranean population of the European sea bass (Dicentrarchus labrax) [25] (Figure 1), which could be useful for delineating Marine Protected Areas (MPAs).
Haplotype data are inherently related to the rate of recombination and its variation across the genome, a major modulator of selection efficiency [26]. For instance, tight linkage is expected to amplify the genomic footprint of linked selection [27] owing to combined effects of background selection [8] and selective sweeps [28]. As a result, linked selection tends to prevail in low-recombining regions, which reduces nucle-otide diversity below the genome-wide background level through local reduction in Ne[4]. In the same
vein, selection acting on linked mutations affects the outcome of genetic admixture [29,30]. As a conse-quence, haplotype data allow a better understanding of the evolutionary mechanisms that shape the genomic mosaic of local ancestry tracts following admixture.
With the continuing development of sequencing technologies (i.e., linked-read and long-read sequencing) and analytical methods (i.e., haplotype reconstruction approaches), haplotype informa-tion is becoming accessible for nonmodel organisms, thus opening new opportunities for conserva-tion genomic studies (Box 1). We review here how this horizontal signal contained in genomic varia-tion has the potential to promote future advances in different contexts relevant to conservavaria-tion genomics, ranging from genetic variation within single populations to genetically interacting popu-lations or species.
Spatiotemporal Inference in Metapopulations
Using haplotype information can improve the inference of population demographic parameters including Neand m. Currently, the most widely used methods to infer demographic history of a
pop-ulation from phased whole-genome haplotype data rely on the sequential Markovian coalescent (SMC) approximation [41]. SMC approaches, that are typically implemented using a hidden Markov model, have provided invaluable insights into changes in population size through time in various taxonomic groups. For instance, using phased genome sequences, Yang et al. [42] provided evidence for continuous decline in the critically endangered population of ironwood tree (Ostrya rehderiana), accompanied by an increased number of deleterious mutations. However, some SMC-based methods make several assumptions, including the absence of population structure, migration, or admixture, which may bias inferences [43,44]. To circumvent those limitations, the most recent exten-sions of SMC-based methods, including the multiple sequential Markovian coalescent (MSMC), have the potential to handle larger sample sizes [30,41,42] as well as more complex demographic models (e.g., more than one population, asymmetric migration rates, variable Nealong the genome, etc.)
[26], without necessarily needing phased data [45].
Between-Population Demographic Inferences Using IBD and IBS Tracts
Long identity-by-descent (IBD) tracts (Box 2) can be exploited to quantify effective population size and migration rates. IBD segments incorporate LD information stemming from recently shared ancestry (Box 2). Long IBD segments can inform us about the demographic history occurring after the time of the most recent common ancestor (TMRCA) [46–48]. Consequently, recent changes in Neor migration rates are expected to affect levels of shared long IBD segments [49]. A high number
of long IBD segments indicates many recent coalescent events (recent TMRCAs) and thus a small
Glossary
Adaptive introgression: intro-gression of a beneficial allele re-sulting in increased fitness of in-dividuals carrying the
introgressed allele. Admixture: mixing of genetic material originating from differ-entiated populations. Ancestry tract: haplotype composed of genetic variants originating from the same line-age. Introgressed tracts refer to ancestry tracts originating from a foreign lineage.
Background selection: reduction of neutral diversity because of linkage to deleterious mutations that are eliminated by purifying selection.
Dispersal: the movement of gametes from emission to fertil-ization sites and the movement of individuals between birth sites and first breeding sites (natal dispersal). Most genetic ap-proaches indirectly quantify effective dispersal or migration rates, in other words successful gene flow following dispersal. Effective population size (Ne): the
number of individuals of an ideal population exhibiting the same level of genetic drift as the studied population, which provides an approximation of the rate of ge-netic drift for that population. Haplotype: a particular combina-tion of genetic variants at linked loci on the same chromosome. Identity-by-descent (IBD) tract: a segment of DNA shared between two or more individuals because of inheritance from a shared common ancestor.
Identity-by-state (IBS) tract: a segment of DNA shared between two or more individuals, which is identical in composition without necessarily implying shared ancestry.
Introgression: incorporation of genetic material from one popu-lation into another through the process of repeated
backcrossing.
Linkage disequilibrium (LD): nonrandom association of alleles at two or more loci within a population.
Linked selection: indirect effect of selection that reduces the di-versity of neutral variants because of their linkage to either nega-tively or posinega-tively selected
recent Ne, whereas the opposite indicates a large Ne. These properties allow better estimations of
recent changes in population size [50] while accounting simultaneously for group ancestry [51] ( Fig-ure 2for an example). Furthermore, IBD methods can also fit complex demographic histories, and are thus more accurate for very recent histories (as recent as four to 10 generations ago), which makes them highly valuable for conservation genetics. For instance, recent migration among small-sized demes is expected to increase IBD sharing between demes but to decrease it within demes. In hu-mans, rates of IBD sharing decay with increasing geographic distance between European popula-tions, where Europeans from neighboring populations share from two to 12 common ancestors in the past 1500 years [52]. Finally, Palamara et al. [49] developed a model for inferring population size change up to 10 generations ago, and they extended their framework to accommodate multiple demes and infer recent fine-scale migration rates [53]. To date, these methods have been mostly used in human genetics studies and with a few other species such as flycatchers (Ficedula spp.) [54]. These methods can provide valuable information in a conservation genomics context via a better under-standing of the recent history of population size and genetic connectivity (gene flow) among popu-lations, with the potential to focus on particular time-periods. Ultimately, such information could help to understand which factors are the most threatening to endangered populations.
Another metric of interest is the intergenerational dispersal distance (i.e., the variance in parent– offspring distances) which can be inferred jointly with the effective population density using the slope of an isolation-by-distance model [63]. To overcome the issue of separating density and dispersal, Ringbauer et al. [64] recently developed an inference framework based on Barton et al. [65] that de-scribes the expected number of IBD segments of a given length in a given pair of samples as a func-tion of their distance. Using this method, the authors [64] were able to estimate a dispersal rate of approximately 50–100 km/O(generations) in European human populations. The estimated dispersal parameter provided by this approach is of direct interest for conservation purposes64] because it dis-sociates recent dispersal distances from past effective population density. Finally, unlike IBD seg-ments, identity-by-state (IBS) tracts can be directly observed without the need to infer historical ancestry (Box 2). Therefore, IBS tracts can be easily used to infer demographic parameters. For instance, the composite likelihood framework developed by Harris and Nielsen [60] uses IBS tracts to infer temporal changes in Ne, as well as divergence time and admixture.
Within-Population Demography and Inbreeding Using Runs Of Homozygosity
A run of homozygosity (ROH) corresponds to an IBD segment within a single individual that descends from shared parental ancestry (i.e., when parents carry identical sequences that coalesce to one recently shared ancestor). ROH analysis can inform us about levels of population size reduction, inbreeding, or natural selection acting on the genome. Knowledge of the distribution of both ROH number and length is informative with regards to Ne, with expectations identical to those for IBD
seg-ments [50,66,67]. For instance, the abundance of ROH in different length classes was used to quan-titatively compare Neamong four species of flycatcher (Ficedula spp.) in different historical
time-pe-riods [54] (Figure 2). ROH may also inform conservation geneticists about inbreeding, which can decrease fitness because of unmasking of partially recessive deleterious alleles [9]. For instance, inbreeding estimates were recently obtained from ROH in an endangered population of gray wolf (Canis lupus) [68]. In particular, the authors were able to finely characterize ROH on nearly completely homozygous chromosomes, and they showed that the majority of ROH stem from common ancestors that were shared less than 10 generations ago. A particularly important feature of IBD and ROH is that they can be inferred without haplotype phasing (although better estimates of IBD block will be obtained if accurate phasing is available) making these approaches particularly attractive for nonmodel species in a conservation context [31].
Interactions between Differentiated Genomes
Over the years, many different analytical approaches have been developed to estimate the timing and magnitude of gene flow [69,70] or admixture proportions in wild individuals (e.g., [71]). Neverthe-less, new methods considering linkage information, in addition to allele frequencies at independent loci, have only recently started to emerge. Despite their potentially widespread benefits, these
mutations. Both background se-lection and selective sweeps contribute to linked selection. Maladaptive introgression: intro-gression of a deleterious allele resulting in decreased fitness of individuals carrying the in-trogressed alleles. Microhaplotype: a particular allelic combination of two or more physically linked variants within a small genomic region, usually visible at the scale of sequence reads generated with next-gen-eration sequencers.
Migration rate (m): the proportion of migrants entering a given population every generation. Run of homozygosity (ROH): a long homozygous tract inherited from identical parental haplotypes.
Selective sweep: the rapid in-crease in the frequency of neutral alleles because of their linkage to a positively selected variant.
methods have been mostly used to study human populations. Hybridization between species or divergent populations generally leads to the introgression of migrant chromosomes within a recip-ient genetic background. Such migrant tracts will subsequently be shortened at each generation of backcrossing by recombination, and long migrant tracts are therefore expected to have introgressed more recently than short tracts [72]. Admixed individual genomes can be represented as a mosaic of local ancestry tracts originating from two (or more) differentiated populations or species [73], and these can be dissected using linkage information [74]. Many different methods have been developed to infer the ancestry of local tracts along individual genomes using different types of data (Box 3). Once revealed, this mosaic of introgressed tracts carries much information pertaining to the timing, magnitude, and variation of gene flow along the genome [74]. Based on this principle, Leitwein et al. [86] introduced a metric that captures the unevenness of ancestry proportions between chromosome homologs, the chromosomal ancestry imbalance (CAI) metric, which can be used to distinguish be-tween early- and late-generation hybrids. This metric revealed a multiple-way admixture (i.e., admix-ture among more than two populations) between wild populations of brown trout (Salmo trutta) and two domesticated stocked strains, as well as the temporal dynamics of hybridization relative to each domestic strain [86].
Under simplifying neutral assumptions, introgressed tract lengths should follow an exponential dis-tribution [87] which would allow the timing of admixture events to be inferred [62,74,86] and
Trends in Ecology & Evolution
Figure 1. Schematic Representation of the Diffusion–Recombination Process over Time and Space for Atlantic Tracts (Red) Introgressed within the Mediterranean Genetic Background (Yellow).
Two Mediterranean populations located at different distances from the contact zone are represented, the western and eastern populations. Comparing the distributions of introgressed Atlantic tracts between the eastern and western Mediterranean populations allows the average per generation dispersal distance within the Mediterranean lineage to be estimated ([25] for more details).
introgression rates to be determined [72]. In addition, comparing the length of admixture tracts in-trogressed within populations at different distances from a contact zone allows us to estimate dispersal distances within the introgressed populations [25]. More recently, novel approaches have been developed to infer admixture parameters using models that consider complex admixture sce-narios with multiple source populations and admixture pulses [88,89], while performing model selec-tion [90]. They may also incorporate continuous gene flow [91] to extend models of instantaneous admixture pulses. All these methods have been tested using simulated data, and have provided new insights on the history of admixture in human populations, but have still not been used in a
Box 1. Haplotype Phasing
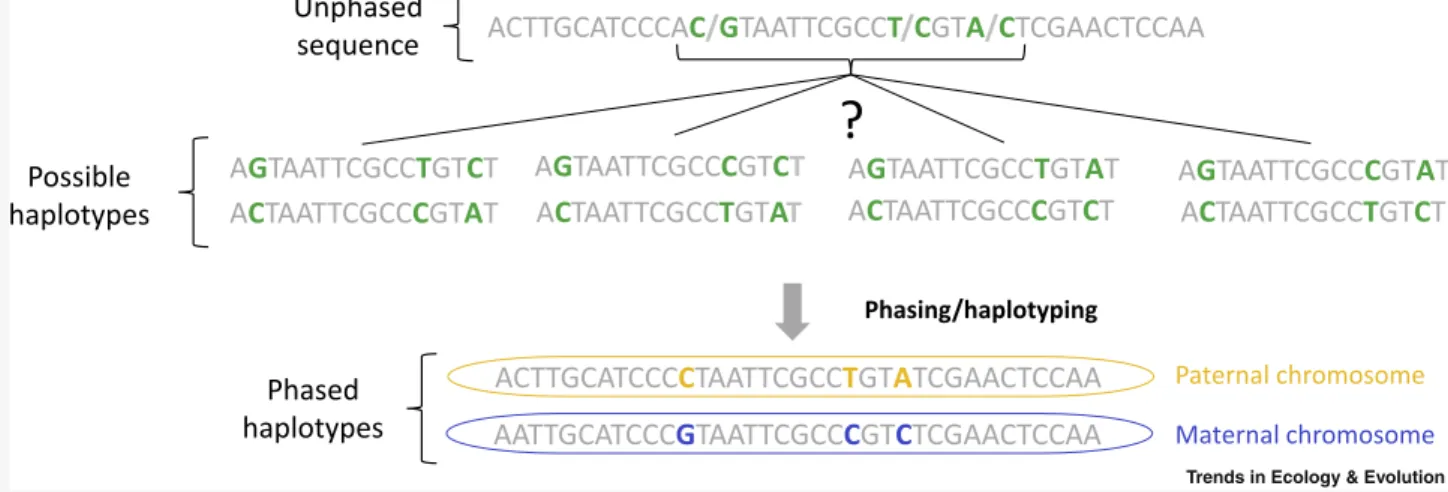
In diploid species, every individual carries one autosomal chromosome copy inherited from its mother and one from its father, each comprising partic-ular combinations of genetic variants. Classically, when diploid individuals are genotyped, differences between the two parental haplotypes appear as heterozygous sites among which linkage information is lost because sequence reads are usually too short to span pairs of contiguous heterozygote po-sitions (Figure I). Haplotype phasing allows this information to be retrieved by using two broad categories of phasing methods.
(i) Indirect approaches [31,32] can use short-read NGS data from related or unrelated individuals. If individuals are related and a pedigree is available, Mendelian transmission rules can be used to perform phasing-by-transmission. For example, in a mother–father–child trio, if the mother and child are heterozygous (A/a) and the father is homozygous (a/a), the derived variant (A) is necessarily on the maternal haplotype. Applying this rationale to all heterozygous sites in the genome of the child allows chromosome-sized haplotypes to be reconstructed. Different software can be used to perform phasing-by-transmission, such as Merlin [33], GATK [34], and Hapi [35]. If individuals are not related, observed frequencies and associations among alleles within a population can be used to perform statistical phasing to estimate the probability of every possible haplotype. The most commonly used software are Eagle [36], Beagle [37], and ShapeIt [38].
(ii) Direct approaches [39] are based on whole-genome sequencing of a single individual using long contiguous DNA fragments. One option is to group long DNA fragments into pools within which genomic regions are uniquely represented. Each resulting pool is then converted to a uniquely iden-tified shotgun-sequencing library. In each pool, short reads mapping to the same genomic region thus belong to the same haplotype, allowing phase reconstruction. Liked-reads technologies such as chromium genome sequencing (10X Genomics) have been developed based on this prin-ciple. Alternatively, third-generation sequencing technologies such as PacBio and Oxford Nanopore allow us to directly access the phase informa-tion by sequencing long reads of several tens of kilobases.
Both methods present advantages and disadvantages. Statistical phasing is the most straightforward and least expensive method but requires large sample size and is less accurate because low-frequency SNPs may not be phased. Phasing-by-transmission approaches are more accurate but are also more expensive because they require closely related individuals, which may be a major problem in wild populations. Direct approaches are the most accurate methods but are also the most expensive. Recently it has been shown that combining both approaches improves the accuracy of the inferred haplotype structure [40].
Trends in Ecology & Evolution
Phasing/haplotyping
Figure I. Schematic Representation of the Information Obtained through Haplotype Phasing.
One sequence is represented with invariable positions in gray and three SNPs in green. The different possible allelic associations between these three SNPs form four different possible haplotypes. Phasing-by-transmission allows the true parental allelic associations to be identified by determining whether each variant was paternally (blue) or maternally (yellow) inherited.
conservation context. The information contained in the mosaic of ancestry tracts can also be summa-rized by the number of ancestry tract junctions [92,93]. As recombination decreases the length of in-trogressed tracts over generations, it increases their number and thus the number of junctions sepa-rating tracts of contiguous ancestry [92]. Therefore, studying the accumulation of junctions can help to elucidate the processes and timeframes of admixture events, as confirmed by simulation studies [92,93].
The downside of all previously presented methods is that they rely heavily on the correct identification of ancestry tracts along the genome (Box 3). Because introgression increases the level of LD within the
Box 2. Identity-by-Descent (IBD) and Identity-by-State (IBS)
Haplotype similarities between individuals (or between homologous sequences within a diploid individual) can result from sharing a common ancestor, where allelic combinations remain unbroken by recombination. Such segments show IBD (Figure I). The length distribution of IBD blocks reflects the age of shared ancestry because short blocks will have undergone, on average, more recombination events and will therefore represent longer time to the most recent common ancestor (TMRCA). By contrast, longer IBD blocks will be indicative of a more recent TMRCA.
A common difficulty with the analysis of pairwise IBD (other than ROHs) is that ancestry inferences are necessary to delineate them. Currently available IBD detection methods (e.g., [31,55–57]) are more accurate for identi-fying long tracts [length >2 centimorgan (cM)] because intermediate tracts (1–2 cM) can result from the confla-tions of shorter tracts [58]. Moreover, nearly all methods developed to identify IBD were optimized using hu-man datasets or simulations mimicking huhu-man genome properties and demographic history. The appropriateness of these methods in species exhibiting highly different demographies has not yet been tested, and more simulation studies may be necessary before they can be applied more broadly.
Haplotypes defined as IBS are identical sequences delimited by two polymorphic sites. They do not require a shared ancestry and, consequently, IBS does not necessarily imply IBD. Some authors (e.g., [59]) also consider that IBD segments can bear new mutations, and therefore do not always imply IBS. The major difference be-tween IBD and IBS is related to the TMRCA: IBD is mostly used to infer ’recent’ demography, whereas IBS often refers to both long and short segments, and therefore may provide information on longer timescales [60]. IBS tracts can be a good alternative to IBD tracts [60] because they are directly observed from the data. However, IBS are also influenced by sequencing and phasing errors. Although IBS tracts have not been widely used in nonmodel species (but see [61] and [62]), they can be analyzed with methods that incorporate linkage informa-tion and also accommodate complex demographic models of split, mixture, and populainforma-tion size change.
Figure I. Identity-by-Descent (IBD) (Left) and Identity-by-State (IBS) (Right) Segments.
IBD segments are displayed in the case of a half-sibling. IBS does not necessarily imply a shared common ancestor and can be inherited by any individuals. The yellow and green colors represent ancestry tracts broken by recombination over time. Abbreviation: MRCA, most recent common ancestor.
introgressed population, several methods focusing on LD patterns have been proposed [94]. A new LD statistic that weights SNPs according to their level of differentiation between two admixing pop-ulations was first used to study admixture between sub-Saharan African and West Eurasian human populations [95], and was subsequently improved in following studies [96–98]. This approach was recently modified to consider LD originating from the source population while modeling multiple waves of admixture events [99] and continuous gene flow [100]. This type of approach was used to
Trends in Ecology & Evolution
Proportion of genome in ROH
Generations back
Figure 2. The use of Highly Homozygous Identity-by-Descent (IBD) Segments (Runs Of Homozygosity, ROH) To Study the Demography of a Nonmodel Species, the Collared Flycatcher (Ficedula spp.).
(Upper panel) Distribution of the genome proportion in ROH for two classes of TMRCA (time to the most recent common ancestor). The greater abundance of ROH in a given class indicates a small effective population size (Ne) during the period considered. This information was used to quantitatively compare Ne among six
populations from four species of flycatcher (Ficedula spp.) in different historical time-periods. Each color corresponds to a different species: orange (collared flycatchers); green (pied flycatchers); gray (Atlas flycatchers); and light blue (semicollared flycatchers). (Bottom right) Change in recent Ne(black line) and its 95% confidence
interval (broken line) inferred from pairwise IBD segments in the Baltic collared flycatcher. The analysis of pairwise IBD revealed that the Baltic population of the collared flycatcher was founded <60 generations ago and displayed the smallest Neof all populations. Adapted, with permission, from Kardos et al. [54].
study admixture between the gray wolf and domestic dog (C. lupus familiaris), which allowed more efficient conservation practices to be proposed that do not solely rely on external phenotypes to identify hybrids [20]. Methods based on the length distribution of IBS segments can also be used to study admixture [60]. For example, these have been used to study how polar bears (Ursus maritimus) diverged from brown bears (Ursus arctos) and adapted to life in the high Arctic. They re-vealed that several ancient hybridization events have most likely occurred between the two species [61].
Novel methods have also been developed to perform local ancestry inference while estimating the timing of a single [84] or several admixture pulses [101], without prior knowledge on the genetic struc-ture of admixstruc-ture groups [97]. One main advantage of these methods is that phased data are not needed, and they are also appropriate for low-coverage or pool-sequencing data [84,101]. These methods were tested on simulated data and returned estimates consistent with previous studies on the admixture history of Drosophila melanogaster populations [84,101].
Selective Outcomes of Hybridization
Hybridization between differentiated populations or species often results in heterogeneous patterns of local ancestry where genomic regions show increased or decreased frequencies of introgressed ancestry [29,30,74,102]. Such patterns might be modulated by neutral, positive, or negative selective forces [102]. To understand which forces are involved, it is important to consider local variation in the recombination rate that modulates genome-wide ancestry profiles through different types of interac-tions between selection and recombination [103].
Furthermore, introgressed haplotypes are expected to be shortened faster in high compared with low-recombining regions [102]. Because the level of LD between introgressed variants modulates the efficiency of selection acting on them [87], the number of generations since hybridization is also an important factor to consider. Indeed, selective effects interfere at the scale of large tracts in first hybrid generations. By contrast, after hundreds of generations, introgressed haplotypes are sufficiently shortened by recombination that selective effects can start to operate at a local (i.e., locus) scale [60,86,87,102].
Selective Effects at Large Tract Scales
Relatively recent hybridization events (i.e., roughly up to 12 generations ago) will generally result in the occurrence of long foreign haplotypes. Consequently, both favorable and detrimental fitness ef-fects will act at the scale of long ancestry tracts. In this situation, potential positive efef-fects such as het-erosis (i.e., hybrid vigor) [104,105] are expected to occur through local associative overdominance, masking the expression of partially recessive deleterious alleles (Figure 3) [106,107]. This is particu-larly expected to predominate when a small population exhibiting high genetic load is introgressed by a foreign nonloaded population [30,108]. Moreover, the accumulation of weakly deleterious alleles in small populations could translate into a strong genetic load particularly in isolated, inbred popu-lations [6,109]. Negative effects on fitness because of outbreeding depression [110] are also expected in situations of genetic incompatibilities between alleles from foreign and recipient populations (e.g.,
Box 3. Local Ancestry Inference
Local ancestry inference is used to characterize mosaic ancestries resulting from admixture and the introgression of foreign alleles within recipient pop-ulations. Different local ancestry inference methods have been developed that rely on different types of data (phased or unphased) and techniques ([75,76]). The wide majority of these are based on hidden Markov models (HMMs) where hidden states correspond to the different possible ancestries. The aim is to estimate, for every variable position along the genome, the probability that a variant originates from a particular ancestral population, thus allowing the reconstruction of a mosaic of continuous ancestry blocks along the genome. However, the number of populations to be considered, and preliminary knowledge of admixture parameters and linkage information, depends on the method used. Recently, new methods have been proposed that can simultaneously estimate local ancestry and infer admixture parameters [84,85]. A nonexhaustive list of the most commonly used methods and their main characteristics is presented inTable I.
Software Technique Data for admixed individuals/ reference individuals
Type of data Number
of source populations Accounting for background LD in ancestral population Biological parameters needed Inferred parameters Ploidy SABER (Tang et al. [73]) MHMM (Markov-hidden Markov model) Phased/ phased High-density SNPs panel + genetic distances
R2 Yes None None Diploid
HAPMIX (Price et al. [77]) HMM Unphased/ phased High-density SNPs panel + genetic distances 2 Yes Admixture time and genome-wide admixture proportions None Diploid PCAdmix (Bryc et al. [78]) Principal component analysis + HMM Unphased/ unphased High-density SNPs panel + genetic distances R2 No Admixture time None Diploid ChromoPainter (Lawsonet al. [79]) HMM Phased/ phased High-density SNPs panel + genetic distances
R2 Yes None None Diploid
LAMP-LD/ LAMP-HAP (Baranet al. [80]) HMM (window-based framework) Unphased/ unphased High-density SNPs panel + physical positions R2 Yes (and Mendelian segregation in family trios)
None None Diploid
RFMix (Maples et al. [81]) Conditional random field (CRF) Phased/phased (phasing error correction) High-density SNPs panel + genetic distances R2 No Admixture time None Diploid
ELAI (Guan [82]) Two-layer HMM Unphased/ unphased (also works with phased reference) High-density SNPs panel + genetic distances R2 Yes Admixture time None diploid Ancestry_HMM (Corbett-Detig and Nielsen [84]) HMM Unphased/ unphased Read pileup data 2 No Global ancestry proportion and chromosome number Admixture time Arbitrary ploidy Loter (Dias-Alveset al. [83]) Analytical resolution Phased/phased (phasing error correction for two source populations) High-density SNPs panel + physical positions
R2 No None None Diploid
MOSAIC (Salter-Townshend and Myers [85]) HMM Phased/ phased (phasing error correction) High-density SNPs panel + genetic distances
R2 Yes None Admixture
time and proportion, andFSTa
Diploid
Bateson–Dobzhansky–Muller incompatibilities). These might also be revealed by admixture between diverged populations (Figure 3) or species that differ in their genomic architectures (e.g., the pres-ence/absence of large inversions) [29,111].
Localized Selective Effects
In older hybrid generations, selective effects are more likely to act at the locus scale [87,101]. Maladaptive fitness effects of introgressed alleles could thus emerge only after a long time following hybridization events, when deleterious alleles become dissociated (through recombination events) from each other and from potentially beneficial alleles at other loci. In particular, this is expected when admixture occurs among populations of small Ne[109]. This process is expected to be accompanied by a progressive
decrease in associative overdominance effects through time. For instance, it was proposed that the occur-rence of several diseases in modern humans was a result of ancient introgression events with Neanderthals [112,113]. Conversely, adaptive introgression has also been documented in modern human populations.
Trends in Ecology & Evolution
Time
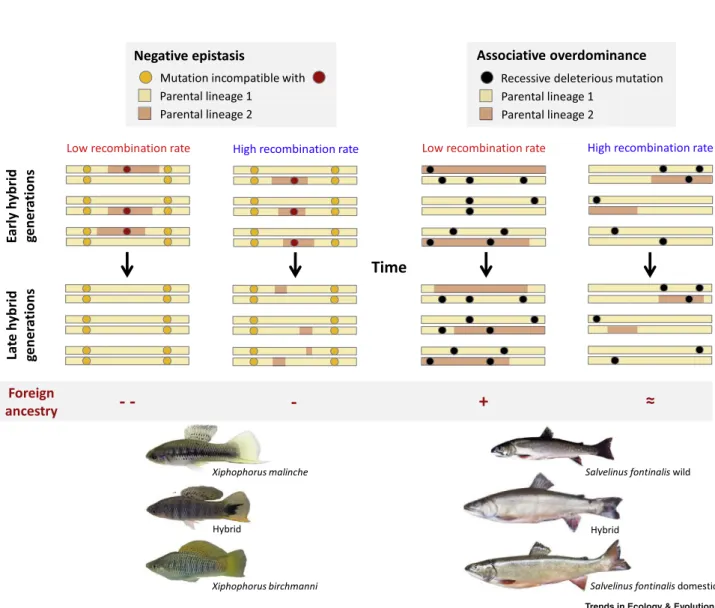
Figure 3. Predicted Relationships between the Relative Abundances of Introgressed Ancestry Tracts and Local Recombination Rate Intensity.
(Left) Predicted relationships in the presence of negative epistasis between two swordtail fish species (Xiphophorus spp.). Modified from Schumer et al. [29]. (Right) Predicted relationships, in the presence of associative overdominance caused by the masking of partially recessive slightly deleterious mutations, between wild and domestic brook charr populations (Salvelinus fontinalis). Modified, with permission, from Leitwein et al. [116] (photo credit: Philippine Gossieaux).
The introgression of Neanderthal and Denisovan DNA has apparently conferred selective advantages to modern humans, for example skin pigmentation, immune response to pathogens, and adaptation to alti-tude [87]. However, the occurrence of adaptive or maladaptive introgression has almost never been inves-tigated in nonmodel species undergoing natural or anthropogenic hybridization (i.e., genetic rescue [114]) which would be of interest for conservation (but see [115]). In brook charr (Salvelinus fontinalis), for example, short-term positive effects of introgression in stocked populations have been documented [116]. This result, however, does not necessarily indicate long-term positive effects because hybridization with the domestic strain used for supplementation is recent, and thus the effects of potentially maladap-tative alleles of domestic origin could be revealed later after the dissipation of associative overdominance. This highlights the importance of considering the temporal dynamics of introgression in a conservation context. In summary, selective pressures, either negative or positive, can modulate variation in introgres-sion rates across the genome, and this, as a function of many interacting parameters, including recombi-nation rate or variation in effective population size.
Concluding Remarks
Although NGS methods allow the generation of huge amount of genomic data relatively quickly and cheaply, genomic variation in species other than humans is still largely analyzed on the basis of indepen-dent SNPs (except for micro-haplotype studies), without tapping into the substantial source of information contained in patterns of LD variation across the genome (see Outstanding Questions). Nevertheless, the recent studies and new analytical developments reviewed above clearly show that this represents a missed opportunity toward improving the use of genomics to guide our conservation decisions and management strategies. At a within-population level, much can be learned from haplotype information, which provides a powerful means to perform demographic inference. At the between-population level, haplotype informa-tion provides an in-depth picture of the magnitude of both contemporary and historical gene flow be-tween populations by retrieving the mosaic of ancestry tracts [29,62].
Clearly, the outcomes of both empirical and simulation studies performed at the haplotype level highlight the importance of considering time since the onset of hybridization events in a conservation context. In particular, a frequently unappreciated outcome of hybridization events is that the directionality of selection acting on a given gene may vary over time as a function of the decreasing size of linkage blocks. As a conse-quence, positive effects following introgression can occur during the first hybrid generations, driven by the masking of partially recessive deleterious mutations (i.e., through associative overdominance), increasing the fraction of introgressed local foreign ancestry. Later, these potentially deleterious alleles might reveal their individual effects with the diminishing local fraction of foreign ancestry and the shortening of linkage blocks [109]. Therefore, to establish appropriate conservation strategies that would take the ’hybridization problem’ into account, it appears crucial to document the temporal dynamics of introgressive hybridization [6,86,109,117]. It is also important to take into consideration variations of introgression and recombination rate along the genome because differential selective forces might also operate along the genome (i.e., favorable or unfavorable to the introduced alleles [116]). To conclude, our review is an attempt to encourage consideration of the great potential of LD information to improve our knowledge of the demographic history (both past and recent) of populations and to understand why admixture and/or introgression rate fluctuate along the genome [29,30,102,118]. Clearly, there is much to be gained by integrating haplotype-based an-alyses in future studies pertaining to conservation genomics (see Outstanding questions).
Acknowledgments
We thank Andrea Stephans, Marty Kardos, and an anonymous reviewer for their constructive com-ments that greatly improved this manuscript.
References
1.Smith, T.B. and Bernatchez, L. (2008) Evolutionary change in human-altered environments. Mol. Ecol. 17, 1–8
2.Soule´, M.E. (1985) What is conservation biology? BioScience 35, 727–734
3.Mace, G.M. et al. (2018) Aiming higher to bend the curve of biodiversity loss. Nat. Sustain. 1, 448
4.Charlesworth, B. and Charlesworth, D. (2017) Population genetics from 1966 to 2016. Heredity 118, 2–9
Outstanding Questions
Will the horizontal signal contained in genome-wide genotype data (i.e., haplotype structure) broaden the amount of information useful for conservation compared with the vertical information of allele frequencies?
Will haplotype studies help to bet-ter address conservation and man-agement issues such as population structure, inbreeding, genetic con-nectivity, and the consequences of anthropogenic hybridization? Can conservation and manage-ment strategies benefit from improved estimates of contempo-rary population sizes and dispersal distances through the use of haplo-type information?
What additional understanding of the temporal dynamics and evolu-tionary consequences of introgres-sive hybridization can we gain from local ancestry inference versus conventional admixture analyses? To what extent does the length of admixture tracts interplay with the different selective mechanisms occurring, and how does this affect the efficiency of genetic rescue?
5.Allendorf, F.W. (2017) Genetics and the conservation of natural populations: allozymes to genomes. Mol. Ecol. 26, 420–430
6.Allendorf, F.W. et al. (2010) Genomics and the future of conservation genetics. Nat. Rev. Genet. 11, 697–709
7.Funk, W.C. et al. (2012) Harnessing genomics for delineating conservation units. Trends Ecol. Evol. 27, 489–496
8.Charlesworth, B. (2009) Effective population size and patterns of molecular evolution and variation. Nat. Rev. Genet. 10, 195–205
9.Charlesworth, D. and Willis, J.H. (2009) The genetics of inbreeding depression. Nat. Rev. Genet. 10, 783–796
10.Lynch, M. et al. (1995) Mutational meltdowns in sexual populations. Evolution 49, 1067–1080
11.Gagnaire, P.-A. et al. (2015) Using neutral, selected, and hitchhiker loci to assess connectivity of marine populations in the genomic era. Evol. Appl. 8, 769–786
12.Cayuela, H. et al. (2018) Demographic and genetic approaches to study dispersal in wild animal populations: a methodological review. Mol. Ecol. 27, 3976–4010
13.Lenormand, T. (2002) Gene flow and the limits to natural selection. Trends Ecol. Evol. 17, 183–189
14.Whitlock, M.C. et al. (2000) Local drift load and the heterosis of interconnected populations. Heredity 84, 452–457
15.Seehausen, O. et al. (2008) Speciation reversal and biodiversity dynamics with hybridization in changing environments. Mol. Ecol. 17, 30–44
16.Hedrick, P.W. (2013) Adaptive introgression in animals: examples and comparison to new mutation and standing variation as sources of adaptive variation. Mol. Ecol. 22, 4606–4618
17.Payseur, B.A. and Rieseberg, L.H. (2016) A genomic perspective on hybridization and speciation. Mol. Ecol. 25, 2337–2360
18.Grabenstein, K.C. and Taylor, S.A. (2018) Breaking barriers: causes, consequences, and experimental utility of human-mediated hybridization. Trends Ecol. Evol. 33, 198–212
19.Allendorf, F.W. et al. (2001) The problems with hybrids: setting conservation guidelines. Trends Ecol. Evol. 16, 613–622
20.Galaverni, M. et al. (2017) Disentangling timing of admixture, patterns of introgression, and phenotypic indicators in a hybridizing wolf population. Mol. Biol. Evol. 34, 2324–2339
21.Wayne, R.K. and Shaffer, H.B. (2016) Hybridization and endangered species protection in the molecular era. Mol. Ecol. 25, 2680–2689
22.Nordborg, M. and Tavare´, S. (2002) Linkage disequilibrium: what history has to tell us. Trends Genet. 18, 83–90
23.Baetscher, D.S. et al. (2018) Microhaplotypes provide increased power from short-read DNA sequences for relationship inference. Mol. Ecol. Resour. 18, 296–305
24.McKinney, G.J. et al. (2017) Managing mixed-stock fisheries: genotyping multi-SNP haplotypes increases power for genetic stock identification. Can. J. Fish. Aquat. Sci. 74, 429–434
25.Duranton, M. et al. (2019) The spatial scale of dispersal revealed by admixture tracts. Evol. Appl. 12, 1743–1756
26.Stapley, J. et al. (2017) Recombination: the good, the bad and the variable. Philos. Trans. R. Soc. B Biol. Sci. 372, 20170279
27.Corbett-Detig, R.B. et al. (2015) Natural selection constrains neutral diversity across a wide range of species. PLoS Biol. 13, e1002112
28.Maynard, J. and Haigh, J. (2007) The hitch-hiking effect of a favourable gene. Genet. Res. 89, 391–403
29.Schumer, M. et al. (2018) Natural selection interacts with recombination to shape the evolution of hybrid genomes. Science 360, 656–660
30.Kim, B.Y. et al. (2018) Deleterious variation shapes the genomic landscape of introgression. PLoS Genet. 14, e1007741
31.Browning, S.R. and Browning, B.L. (2011) Haplotype phasing: existing methods and new developments. Nat. Rev. Genet. 12, 703–714
32.Rhee, J.-K. et al. (2016) Survey of computational haplotype determination methods for single individual. Genes Genomics 38, 1–12
33.Abecasis, G.R. et al. (2002) Merlin – rapid analysis of dense genetic maps using sparse gene flow trees. Nat. Genet. 30, 97
34.McKenna, A. et al. (2010) The genome analysis toolkit: a MapReduce framework for analyzing next-generation DNA sequencing data. Genome Res. 20, 1297–1303
35.Williams, A.L. et al. (2010) Rapid haplotype inference for nuclear families. Genome Biol. 11, R108
36.Loh, P.-R. et al. (2016) Fast and accurate long-range phasing in a UK Biobank cohort. Nat. Genet. 48, 811–816
37.Browning, S.R. and Browning, B.L. (2010) High-resolution detection of identity by descent in unrelated individuals. Am. J. Hum. Genet. 86, 526–539
38.O’Connell, J. et al. (2016) Haplotype estimation for biobank-scale data sets. Nat. Genet. 48, 817–820
39.Snyder, M.W. et al. (2015) Haplotype-resolved genome sequencing: experimental methods and applications. Nat. Rev. Genet. 16, 344–358
40.Garg, S. et al. (2016) Read-based phasing of related individuals. Bioinformatics 32, i234–i242
41.McVean, G.A.T. and Cardin, N.J. (2005)
Approximating the coalescent with recombination. Philos. Trans. R. Soc. B Biol. Sci. 360, 1387–1393
42.Yang, Y. et al. (2018) Genomic effects of population collapse in a critically endangered ironwood tree Ostrya rehderiana. Nat. Commun. 9, 5449
43.Mazet, O. et al. (2015) Demographic inference using genetic data from a single individual: separating population size variation from population structure. Theor. Popul. Biol. 104, 46–58
44.Mazet, O. et al. (2016) On the importance of being structured: instantaneous coalescence rates and human evolution – lessons for ancestral population size inference? Heredity 116, 362–371
45.Terhorst, J. et al. (2017) Robust and scalable inference of population history from hundreds of unphased whole genomes. Nat. Genet. 49, 303–309
46.Schiffels, S. and Durbin, R. (2014) Inferring human population size and separation history from multiple genome sequences. Nat. Genet. 46, 919–925
47.Sheehan, S. et al. (2013) Estimating variable effective population sizes from multiple genomes: a sequentially Markov conditional sampling distribution approach. Genetics 194, 647–662
48.Steinru¨cken, M. et al. (2015) Inference of complex population histories using whole-genome sequences from multiple populations. Proc. Natl. Acad. Sci. U.S.A. 116, 17115–17120
49.Palamara, P.F. et al. (2012) Length distributions of identity by descent reveal fine-scale demographic history. Am. J. Hum. Genet. 91, 809–822
50.Browning, S.R. and Browning, B.L. (2015) Accurate non-parametric estimation of recent effective population size from segments of identity by descent. Am. J. Hum. Genet. 97, 404–418
51.Browning, S.R. et al. (2018) Ancestry-specific recent effective population size in the Americas. PLoS Genet. 14, e1007385
52.Ralph, P. and Coop, G. (2013) The geography of recent genetic ancestry across Europe. PLoS Biol. 11, e1001555
53.Palamara, P.F. and Pe’er, I. (2013) Inference of historical migration rates via haplotype sharing. Bioinformatics 29, i180–i188
54.Kardos, M. et al. (2017) Inferring individual inbreeding and demographic history from segments of identity by descent in Ficedula flycatcher genome sequences. Genetics 205, 1319– 1334
55.Gusev, A. et al. (2009) Whole population, genome-wide mapping of hidden relatedness. Genome Res. 19, 318–326
56.Browning, B.L. and Browning, S.R. (2013) Detecting identity by descent and estimating genotype error rates in sequence data. Am. J. Hum. Genet. 93, 840–851
57.Tataru, P. et al. (2014) diCal-IBD: demography-aware inference of identity-by-descent tracts in unrelated individuals. Bioinformatics 30, 3430–3431
58.Chiang, C.W.K. et al. (2016) Conflation of short identity-by-descent segments bias their inferred length distribution. G3 6, 1287–1296
59.Beichman, A.C. et al. (2018) Using genomic data to infer historic population dynamics of nonmodel organisms. Annu. Rev. Ecol. Evol. Syst. 49, 433–456
60.Harris, K. and Nielsen, R. (2013) Inferring demographic history from a spectrum of shared haplotype lengths. PLoS Genet. 9, e1003521
61.Liu, S. et al. (2014) Population genomics reveal recent speciation and rapid evolutionary adaptation in polar bears. Cell 157, 785–794
62.Duranton, M. et al. (2018) The origin and remolding of genomic islands of differentiation in the European sea bass. Nat. Commun. 9, 2518
63.Rousset, F. (1997) Genetic differentiation and estimation of gene flow from F-statistics under isolation by distance. Genetics 145, 1219–1228
64.Ringbauer, H. et al. (2017) Inferring recent demography from isolation by distance of long shared sequence blocks. Genetics 205, 1335–1351
65.Barton, N.H. et al. (2013) Modelling evolution in a spatial continuum. J. Stat. Mech. Theory Exp. 2013, P01002
66.MacLeod, I.M. et al. (2013) Inferring demography from runs of homozygosity in whole-genome sequence, with correction for sequence errors. Mol. Biol. Evol. 30, 2209–2223
67.Kirin, M. et al. (2010) Genomic runs of homozygosity record population history and consanguinity. PLoS ONE 5, e13996
68.Kardos, M. et al. (2018) Genomic consequences of intensive inbreeding in an isolated wolf population. Nat. Ecol. Evol. 2, 124
69.Csille´ry, K. et al. (2010) Approximate Bayesian computation (ABC) in practice. Trends Ecol. Evol. 25, 410–418
70.Pickrell, J.K. and Pritchard, J.K. (2012) Inference of population splits and mixtures from genome-wide allele frequency data. PLoS Genet. 8, e1002967
71.Pritchard, J.K. et al. (2000) Inference of population structure using multilocus genotype data. Genetics 155, 945–959
72.Pool, J.E. and Nielsen, R. (2009) Inference of historical changes in migration rate from the lengths of migrant tracts. Genetics 181, 711–719
73.Tang, H. et al. (2006) Reconstructing genetic ancestry blocks in admixed individuals. Am. J. Hum. Genet. 79, 1–12
74.Liang, M. and Nielsen, R. (2014) The lengths of admixture tracts. Genetics 197, 953–967
75. Geza, E. et al. (2018) A comprehensive survey of models for dissecting local ancestry deconvolution in human genome. Brief. Bioinform. Published online June 29, 2018.https://doi.org/10.1093/bib/ bby044
76.Kai Yuan, Y.Z. and Kai Yuan, Y.Z. (2017) Models, methods and tools for ancestry inference and admixture analysis. Quant. Biol. 5, 236–250
77.Price, A.L. et al. (2009) Sensitive detection of chromosomal segments of distinct ancestry in admixed populations. PLoS Genet. 5, e1000519
78.Bryc, K. et al. (2010) Genome-wide patterns of population structure and admixture in West Africans and African Americans. Proc. Natl. Acad. Sci. U. S. A. 107, 786–791
79.Lawson, D.J. et al. (2012) Inference of population structure using dense haplotype data. PLoS Genet. 8, e1002453
80.Baran, Y. et al. (2012) Fast and accurate inference of local ancestry in Latino populations. Bioinformatics 28, 1359–1367
81.Maples, B.K. et al. (2013) RFMix: a discriminative modeling approach for rapid and robust local-ancestry inference. Am. J. Hum. Genet. 93, 278–288
82.Guan, Y. (2014) Detecting structure of haplotypes and local ancestry. Genetics 196, 625
83.Dias-Alves, T. et al. (2018) Loter: a software package to infer local ancestry for a wide range of species. Mol. Biol. Evol. 35, 2318–2326
84.Corbett-Detig, R. and Nielsen, R. (2017) A hidden Markov model approach for simultaneously estimating local ancestry and admixture time using next generation sequence data in samples of arbitrary ploidy. PLoS Genet. 13, e1006529
85.Salter-Townshend, M. and Myers, S. (2019) Fine-scale inference of ancestry segments without prior knowledge of admixing groups. Genetics 212, 869–889
86.Leitwein, M. et al. (2018) Genomic consequences of a recent three-way admixture in supplemented wild brown trout populations revealed by local ancestry tracts. Mol. Ecol. 27, 3466–3483
87.Racimo, F. et al. (2015) Evidence for archaic adaptive introgression in humans. Nat. Rev. Genet. 16, 359–371
88.Gravel, S. et al. (2013) Reconstructing Native American nigrations from whole-genome and whole-exome data. PLoS Genet. 9, e1004023
89.Pugach, I. et al. (2016) The complex admixture history and recent southern origins of Siberian populations. Mol. Biol. Evol. 33, 1777–1795
90.Ni, X. et al. (2018) Inference of multiple-wave admixtures by length distribution of ancestral tracks. Heredity 121, 52–63
91.Ni, X. et al. (2019) MultiWaver 2.0: modeling discrete and continuous gene flow to reconstruct complex population admixtures. Eur. J. Hum. Genet. 27, 133–139
92.Thijs, Janzen et al. (2018) The breakdown of genomic ancestry blocks in hybrid lineages given a finite number of recombination sites. Evolution 72, 735–750
93.Hvala, J.A. et al. (2018) Signatures of hybridization and speciation in genomic patterns of ancestry. Evolution 72, 1540–1552
94.Sankararaman, S. et al. (2012) The date of interbreeding between Neandertals and modern humans. PLoS Genet. 8, e1002947
95.Moorjani, P. et al. (2011) The history of African gene flow into Southern Europeans, Levantines, and Jews. PLoS Genet. 7, e1001373
96.Patterson, N. et al. (2012) Ancient admixture in human history. Genetics 192, 1065–1093
97.Loh, P.-R. et al. (2013) Inferring admixture histories of human populations using linkage disequilibrium. Genetics 193, 1233–1254
98.Pru¨fer, K. et al. (2014) The complete genome sequence of a Neanderthal from the Altai Mountains. Nature 505, 43–49
99.Zhou, Y. et al. (2017) Inference of multiple-wave population admixture by modeling decay of linkage disequilibrium with polynomial functions. Heredity 118, 503–510
100.Zhou, Y. et al. (2017) Modeling continuous admixture using admixture-induced linkage disequilibrium. Sci. Rep. 7, 43054
101.Medina, P. et al. (2018) Estimating the timing of multiple admixture pulses during local ancestry inference. Genetics 210, 1089–1107
102.Martin, S. and Jiggins, C.D. (2017) Interpreting the genomic landscape of introgression. Curr. Opin. Genet. Dev. 47, 69–74
103.Schumer, M. et al. (2014) How common is homoploid hybrid speciation? Evolution 68, 1553– 1560
104.Drake, J.M. (2006) Heterosis, the catapult effect and establishment success of a colonizing bird. Biol. Lett. 2, 304–307
105.Facon, B. et al. (2005) Hybridization and invasiveness in the freshwater snail Melanoides tuberculata: hybrid vigour is more important than increase in genetic variance. J. Evol. Biol. 18, 524–535
106.Chen, Z.J. (2010) Molecular mechanisms of polyploidy and hybrid vigor. Trends Plant Sci. 15, 57–71
107.Lippman, Z.B. and Zamir, D. (2007)
Heterosis: revisiting the magic. Trends Genet. 23, 60–66
108.Laikre, L. et al. (2010) Compromising genetic diversity in the wild: unmonitored large-scale release of plants and animals. Trends Ecol. Evol. 25, 520–529
109.Harris, K. and Nielsen, R. (2016) The genetic cost of Neanderthal introgression. Genetics 203, 881–891
110.Barton, N. and Hewitt, G.M. (1985) Analysis of hybrid zones. Annu. Rev. Ecol. Syst. 16, 113–148
111.Dion-Coˆte´, A.-M. et al. (2015) Reproductive isolation in a nascent species pair is associated with aneuploidy in hybrid offspring. Proc. R. Soc. B Biol. Sci. 282, 20142862
112.Simonti, C.N. et al. (2016) The phenotypic legacy of admixture between modern humans and Neandertals. Science 351, 737–741
113.Dannemann, M. et al. (2017) Functional implications of Neandertal introgression in modern humans. Genome Biol 18, 61
114.Harris, K. et al. (2019) Genetic rescue and the maintenance of native ancestry. Conserv. Genet. 20, 59–64
115. Simon, A. et al. (2019) Replicated anthropogenic hybridisations reveal parallel patterns of admixture in marine mussels. Evol. Appl. Published online October 17, 2019.https://doi.org/10.1111/eva.12879
116.Leitwein, M. et al. (2019) The role of recombination on genome-wide patterns of local ancestry exemplified by supplemented Brook Charr populations. Mol. Ecol. 28, 4755–4769
117.Aitken, S.N. and Whitlock, M.C. (2013) Assisted gene flow to facilitate local adaptation to climate change. Annu. Rev. Ecol. Evol. Syst. 44, 367–388
118.Martin, S.H. et al. (2019) Recombination rate variation shapes barriers to introgression across butterfly genomes. PLoS Biol. 17, e2006288