HAL Id: hal-01847867
https://hal.umontpellier.fr/hal-01847867
Submitted on 24 Jul 2018
HAL is a multi-disciplinary open access
archive for the deposit and dissemination of
sci-entific research documents, whether they are
pub-lished or not. The documents may come from
teaching and research institutions in France or
abroad, or from public or private research centers.
L’archive ouverte pluridisciplinaire HAL, est
destinée au dépôt et à la diffusion de documents
scientifiques de niveau recherche, publiés ou non,
émanant des établissements d’enseignement et de
recherche français ou étrangers, des laboratoires
publics ou privés.
Anais Appelgren, Verena Saladin, Heinz Richner, Blandine Doligez, Karen
Mccoy
To cite this version:
Anais Appelgren, Verena Saladin, Heinz Richner, Blandine Doligez, Karen Mccoy. Gene flow and
adaptive potential in a generalist ectoparasite. BMC Evolutionary Biology, BioMed Central, 2018, 18,
pp.99. �10.1186/s12862-018-1205-2�. �hal-01847867�
R E S E A R C H A R T I C L E
Open Access
Gene flow and adaptive potential in a
generalist ectoparasite
Anaïs S. C. Appelgren
1,2,3,4*, Verena Saladin
1, Heinz Richner
1†, Blandine Doligez
2,3,5†and Karen D. McCoy
4†Abstract
Background: In host-parasite systems, relative dispersal rates condition genetic novelty within populations and thus their adaptive potential. Knowledge of host and parasite dispersal rates can therefore help us to understand current interaction patterns in wild populations and why these patterns shift over time and space. For generalist parasites however, estimates of dispersal rates depend on both host range and the considered spatial scale. Here, we assess the relative contribution of these factors by studying the population genetic structure of a common avian ectoparasite, the hen flea Ceratophyllus gallinae, exploiting two hosts that are sympatric in our study population, the great tit Parus major and the collared flycatcher Ficedula albicollis. Previous experimental studies have indicated that the hen flea is both locally maladapted to great tit populations and composed of subpopulations specialized on the two host species, suggesting limited parasite dispersal in space and among hosts, and a potential interaction between these two structuring factors. Results: C. gallinae fleas were sampled from old nests of the two passerine species in three replicate wood patches and were genotyped at microsatellite markers to assess population genetic structure at different scales (among individuals within a nest, among nests and between host species within a patch and among patches). As expected, significant structure was found at all spatial scales and between host species, supporting the hypothesis of limited dispersal in this parasite. Clustering analyses and estimates of relatedness further suggested that inbreeding regularly occurs within nests. Patterns of isolation by distance within wood patches indicated that flea dispersal likely occurs in a stepwise manner among neighboring nests. From these data, we estimated that gene flow in the hen flea is approximately half that previously described for its great tit hosts.
Conclusion: Our results fall in line with predictions based on observed patterns of adaptation in this host-parasite system, suggesting that parasite dispersal is limited and impacts its adaptive potential with respect to its hosts. More generally, this study sheds light on the complex interaction between parasite gene flow, local adaptation and host specialization within a single host-parasite system.
Keywords: Multi-host system, Habitat fragmentation, Dispersal, Local adaptation, Ecological specialization, Spatial scale, Population genetics, Ficedula albicollis, Parus major, Ceratophyllus gallinae
Background
Long-term interactions between hosts and parasites can shape the evolution of their life history traits, their behavior and their physiology, and can alter the way they interact with other organisms in the environment [1].
Because parasites often show higher reproductive rates than their hosts, they are frequently considered to have a higher evolutionary potential and therefore an advantage in the evolutionary arms race [2, 3]. However, this assumption is not always verified, because parasites often have low independent dispersal capacities and can be subjected to strong population bottlenecks [4] reducing their adaptive potential by lowering genetic diversity within populations. In this sense, relative host-parasite dispersal rates among populations should be a key determin-ant of relative genetic diversity, and thus adaptive potential, and therefore should condition coevolutionary outcomes [2]. Indeed, evolutionary models predict that the more
* Correspondence:[email protected]
†Heinz Richner, Blandine Doligez and Karen D. McCoy contributed equally to
this work.
1Evolutionary Ecology Laboratory, Institute of Ecology and Evolution,
University of Bern, Baltzerstrasse 6, Bern, Switzerland
2CNRS; Université de Lyon, F-69000, Lyon; Université Lyon 1; Department of
Biometry and Evolutionary Biology, LBBE UMR 5558, Bâtiment Gregor Mendel, 43 boulevard du 11 novembre 1918, F-69622, Villeurbanne, France Full list of author information is available at the end of the article
© The Author(s). 2018 Open Access This article is distributed under the terms of the Creative Commons Attribution 4.0 International License (http://creativecommons.org/licenses/by/4.0/), which permits unrestricted use, distribution, and reproduction in any medium, provided you give appropriate credit to the original author(s) and the source, provide a link to the Creative Commons license, and indicate if changes were made. The Creative Commons Public Domain Dedication waiver (http://creativecommons.org/publicdomain/zero/1.0/) applies to the data made available in this article, unless otherwise stated.
dispersive species should benefit from genetic novelty at the local scale, and therefore lead in the arms race [2,3,5], so long as dispersal is random with respect to genotype and does not completely homogenize populations [6].
The host range of a parasite is also an important deter-minant of coevolutionary outcomes. Indeed, a parasite which infests a broad range of hosts will be subject to diffuse selective pressures from each host type compared to a more specialist parasite, resulting in a lower probability of fixing beneficial alleles for generalists compared to specialists [5,7,8]. Host range can also influence parasite dispersal by altering parasite habitat range and host-linked dispersal probabilities. Host range can therefore influence host-parasite coevolution directly through selection, and indirectly through its consequences on dispersal. However, the definition of a parasite’s host range strongly depends on the spatial scale considered. Indeed, parasite species considered as generalists at the scale of their overall distribution can sometimes be composed of distinct local populations specialized on different hosts [9–14]. Population-based studies are therefore essential for char-acterizing host range and spatial population structure at fine spatial scales [15]. Although a strong link is to be expected between host specialization and local adaptation, studies focusing on biological systems experiencing these two phenomena at the same time have received little attention.
The present study aimed at characterizing the population structure of a “generalist” ectoparasite at different spatial scales, and among different host species, in order to exam-ine the link between dispersal, patterns of local adaptation and host specialization. We focused on a common bird ectoparasite, the hen flea Ceratophyllus gallinae, infesting hole-nesting passerine species [16]. This nest-based parasite can negatively impact the reproductive success of its host by decreasing nestling survival and growth and by increasing the costs of reproduction [17–19]. Members of the Paridae family are considered as the main hosts for this parasite based on prevalence and inten-sity records, but other families are also commonly infested, in particular the Muscicapidae family [16]. An experimen-tal test of local adaptation of hen fleas to great tit hosts (Parus major, Paridae) in a fragmented habitat composed of distinct wood patches on Gotland (Sweden), suggested that hen fleas are locally maladapted to their hosts, i.e. local fleas have higher fitness when exploiting non-local compared to local tit hosts [20]. This observation could be explained by lower relative dispersal of fleas among patches compared to great tits. A reciprocal transfer of hen fleas between nests of great tits and an alternative host, the collared flycatcher (Ficedula albicollis, Muscicapi-dae), also suggested the presence of distinct flea populations associated with each host species in some localities [21]. This observation could be due to reduced flea gene flow
between host species within the same patch and/or strong selection for host adaptation. Here, we used a population genetic approach to characterize flea population structure over space and host species, and thereby assess whether the previously observed patterns (local maladaptation and local host specialization of fleas) are associated with expected patterns of relative host-parasite gene flow.
Methods
Sampling
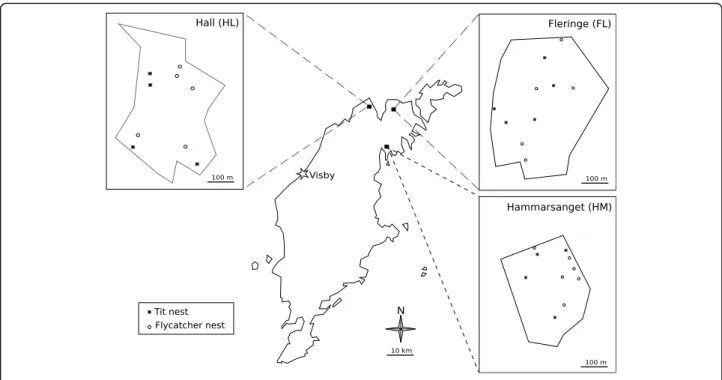
In March 2013, we sampled old nests of great tits and collared flycatchers in three wood patches (Fleringe (FL), Hall (HL) and Hammarsänget (HM)) on the northern part of the Swedish island of Gotland (Fig. 1). Wooden nest boxes were erected in these patches in 2004. From 2004 to 2007, great tit and flycatcher nests were monitored in these patches without manipulating flea populations, except by the removal of old nests from nest boxes at the end of the season. Starting in 2007, these patches were no longer monitored, allowing fleas to establish natural population dynamics prior to our sampling. Old nests were collected in separate hermetic plastic bags and sorted by bird species based on the material used to build the nest. Collared flycatcher nests are mainly composed of dry grasses and leaves, whereas great tits nests contain moss and fur. Some risk of confusion between nests of great tits and blue tits (Parus caeruleus), a closely related species with similar ecology, was possible in our sample. As blue tits are about half as abundant as great tits in our patches and frequently use feathers as nest material in addition to fur, few blue tit nests were likely included among the sampled nests. However, to remain conservative, we only make the distinction between “flycatcher nests” (collared flycatchers) and“tit” nests in our study.
Live adult fleas were collected from each sampled nest using an insect aspirator and were stored in 95% alcohol. A total of 67 nests were collected in the three patches, with an overall prevalence of hen fleas of 47% in tit nests, and 49% in flycatcher nests. Among the 35 sampled nests with a high enough number of fleas (> 20), 29 nests were selected at random for genotyping, with a balance between patches and host species (for Hall: 4 tit and 5 flycatcher nests, for Fleringe: 5 tit and 5 flycatcher nests, for Hammarsänget: 4 tit and 6 flycatcher nests). We genotyped 19 to 22 fleas from each selected nest. Fleas sampled within a nest are considered as an infrapopulation.
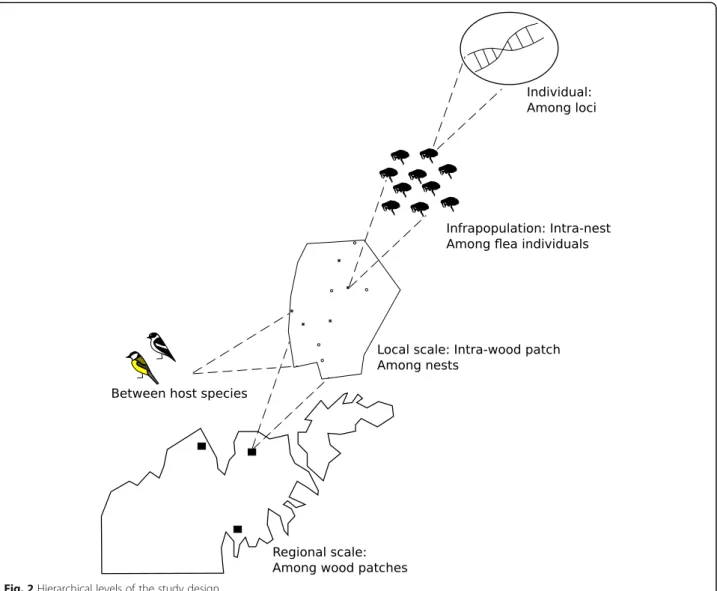
Maps summarizing the sampling locations and methods (Figs. 1 and 2) were produced using the vector drawing software Inkscape 0.91.
Deoxyribonucleic acid extraction, microsatellite markers and genotyping
We individually extracted DNA from fleas in 300 μL
Lysis Solution (Promega AG, Dübendorf, Switzerland),
56 μL of 0.5 M Ethylenediaminetetraacetic acid
(EDTA; Fluka, Sigma-Aldrich, Buchs, Switzerland) and
10 μL of Proteinase K (Promega AG, Dübendorf,
Switzerland). We then performed DNA purification using magnetic beads (MagneSil Blue, Promega AG, Dübendorf, Switzerland), following the manufacturer’s protocol.
Polymerase Chain Reactions were performed in a 10μL volume, containing 2 μL of the DNA extract, 5 μL of QIAGEN Multiplex PCR Master Mix (QIAGEN AG,
Hombrechtikon, Switzerland), 1 μL of fluorescent
primer mix (2 to 6 μM), and 2 μL of molecular grade
water. DNA amplifications were carried out using a Geneamp 9700 Thermocycler (Applied Biosystems, Rotkreuz, Switzerland). PCR conditions were the same for all targeted markers: initial denaturation at 95 °C for 15 min, followed by 35 cycles of 30s at 94 °C for denaturation, 90s at 57 °C for primer annealing and 60s at 72 °C for elongation and ending with a final elongation step of 72 °C for 10 min.
We targeted 13 of the 23 markers previously described by Binz et al. [22] for C. gallinae genotyping, focusing on the most reliable (i.e. good amplification success, low null alleles): Cga2, Cga3As, Cga6, Cga9, Cga11, Cga14, Cga26, Cga28, Cga31, Cga32, Cga42, Cga45 and Cga46. We assessed allele lengths using the genetic analyzer ABI 3100 (Applied Biosystems) and the software Genemapper v3.7 (Applied Biosystems).
Assessment of marker quality
In order to verify marker independence, we tested for linkage disequilibrium among the 13 markers over all infrapopulations using the software Genepop v. 4.3 [23] with default values for dememorization, batches and iteration numbers. We assessed for the occurrence of null alleles, stuttering and allele dropout for each locus using the software Micro-Checker v.2.2.3 [24]. Genetic diversity and allelic richness were assessed with the software FSTAT v.2.9.3.2. [25]. To determine whether markers con-formed to proportions expected under Hardy-Weinberg equilibrium, and to assess if all markers gave coherent information, i.e. conformed to neutrality, we also quantified Fis and Fstfor each locus over all populations using Weir
and Cockerham’s unbiased estimator f and θ, respectively [26], and calculated the standard error of these estimates by jackknifing over infrapopulations using FSTAT v.2.9.3.2.
Analysis of genetic structure at different spatial scales and between host species
We tested for flea population genetic differentiation within and among wood patches and investigated the relative genetic structure at the different spatial levels of the system (Fig.2).
Among patches
We characterized Fst at the among patch level using
Weir and Cockerham’s unbiased estimator θ [26] and
calculated its standard error by jacknifing over patches
using FSTAT v.2.9.3.2. Significance was assessed using 10,000 permutations. Because most loci showed high polymorphism, the maximum estimate of differentiation is lower than 1. We therefore also calculated the Fst maxas
suggested by Hedrick and Goodnight [27], using the pro-grams RecodeData [28] and FSTAT v.2.9.3.2. Standardized differentiation was then calculated as Fst standardized= Fst obs/
Fst max[28]. Population structure at the among patch scale
was also graphically explored using a DAPC (Discriminant Analysis of Principal Components) implemented in the package adegenet 1.4–2 [29] for the software R v.3.0.2 [30]. This analysis combines an initial principal component ana-lysis (PCA, considering among-individual variation) with a discriminant analysis (DA, considering among-group vari-ation). Based on cumulative variance and eigenvalues, we retained 100 principal components for the PCA, and two discriminant functions for the DA. Finally,
the relative contribution of different hierarchical
spatial scales (from the among patch scale to the intra-individual level, Fig. 2) in explaining observed genetic variation was investigated using an analysis of molecular variance (AMOVA) computed by GenAlEx v.6.5 [31, 32] with 9999 permutations.
Within patches and between host species
We examined the population genetic structure of fleas within each of the three patches, both among nests and between host species. First, for each patch, we calculated Fstand Fst max among nests as described above. Second,
we tested for genetic differentiation between hosts in each patch using AMOVAs to decompose molecular variance from the host species category to the intra-individual level. Third, we investigated clustering among nests within each patch using DAPC as described above (with 50 components and 2 discriminant functions). Fourth, in order to test if the nest level was the most relevant minimal hierarchical scale
for our study and to identify potential genetic groups shared by different nests, we also carried out a clustering analysis for each patch using the software STRUCTURE v.2.3.4 [33, 34]. We set the possible number of clusters (k) from 1 to 20 (assuming a maximum of two subpopulations within each nest), the burn-in period to 500,000 iterations, and the number of Markov chain Monte Carlo iterations to 1,000,000. Prior information about infrapopulation iden-tity was included in the analysis. The optimal number of clusters (k) for each patch was assessed with STRUCTURE
HARVESTER v 0.6.94 [35] using the Evanno’s Delta k
value [36]. Fifth, in order to explore whether gene flow occurred among neighboring nest boxes, we tested for isolation by distance using a linearized estimate of genetic distance (Fst/(1-Fst)) and the natural logarithm of the
geographic distance between nests (in meters) using Mantel tests (10,000 permutations; program Genepop v. 4.3). Where host-associated differentiation among flea populations was found, this test was carried out separately for each host species. Finally, we used Teriokhin’s generalized binomial procedure implemented in the soft-ware Multitest v1.2 [37,38] to combine independent tests. As there were only 3 tests to combine, the entire set of p-values was used rather than just half [39]. For three independent tests, the optimal threshold value of signifi-cance is < 0.3689.
Within nests
In this last analytical step, we examined the population genetic structure at the infrapopulation level (within nests). We tested for a departure from panmixia within nests by calculating the Fis(f) for each patch with FSTAT v.2.9.3.2.
We also calculated mean relatedness within each nest with Queller and Goodnight’s coefficient [40] using GenAlEx v.6.5. The standard error and significance of the estimators were assessed based on 9999 permutations. We also used the results of the previous clustering analysis at the patch level (performed with STRUCTURE v.2.3.4) to assess whether sub-structure occurred within infrapopulations. Results
Assessment of marker quality
Significant linkage disequilibrium was observed between two marker pairs: Cga31 and Cga46 (one nest in Fleringe), and Cga31 and Cga32 (one nest in Fleringe, two in Hall and one in Hammarsänget). This result could be due in theory to consanguinity within some nests, but this explanation was not supported by the observed values of Fisand relatedness within infrapopulations (see within-nest
section) and suggests that the markers may be physically linked. We therefore removed marker Cga31 from the marker set.
Genetic diversity and allelic richness were variable among markers, ranging from 0.42 to 0.88 on average for
genetic diversity, and from 5 to 32 over all populations for allelic richness, but did not vary much among nests or patches (see Tables S1 and S2 in Additional file 1). Fis
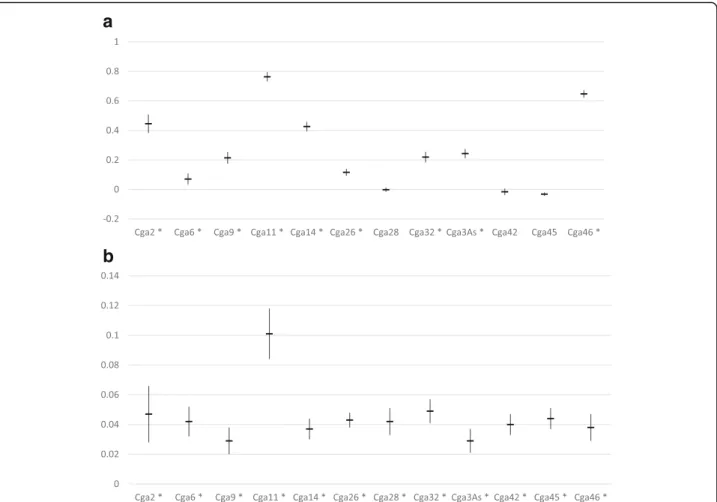
estimates were also variable among markers, but most estimates were significantly different from zero (Fig.3a). In contrast, all markers gave similar estimates of Fst
(Fig.3b), except for the marker Cga11, which tended to overestimate differentiation. Markers Cga 11, Cga 46, Cga3As and Cga14 showed some evidence for null alleles, which may have altered Fisestimates at these markers. No
allele dropout or stuttering was suggested based on patterns of allele frequencies and allele sizes. To maintain reasonable power, the whole set of 12 markers was retained for subse-quent analyses, but the potential influence of null alleles was controlled by running every analysis again without the four markers concerned (i.e. on a set of 8 markers). Results did not differ with or without these markers, except for the estimation of global Fis, which was lower with the set of
8 compared to 12 markers, as expected. However, the infrapopulation estimates of Fis remained significantly
higher than zero even with the reduced marker set (for 12 markers: f ± SE for 12 and 8 markers respectively: 0.239 ± 0.074 and 0.104 ± 0.046, p = 0.0001 in both cases). Deviations from Hardy-Weinberg proportions therefore originated from biological factors rather than technical issues (see below).
Among patches
Overall structure considering nests from all patches was significantly greater than zero (Fst (θ) ± SE =0.044 ±
0.006, p = 0.0001). Given that the maximum Fst maxvalue
calculable with this dataset is 0.265 instead of 1, the actual value of differentiation is Fst standardized= 0.166. At this large
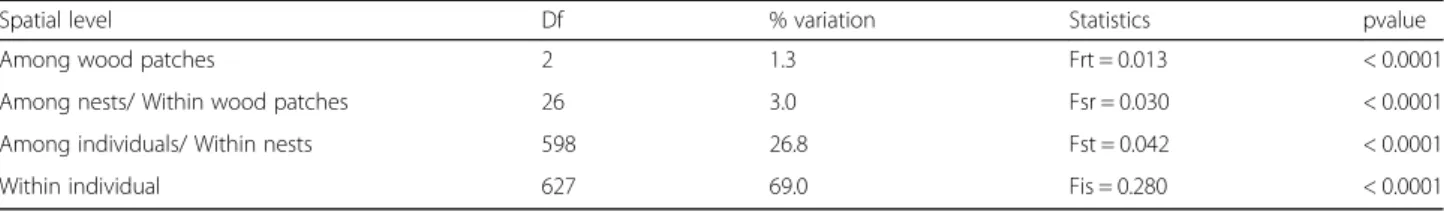
scale, differentiation was mostly driven by spatial compo-nents, and the DAPC separated infrapopulations into three groups corresponding to the three patches (Fig.4). How-ever, patches do not appear totally differentiated, as the three groups overlap on the two main axes. AMOVA ana-lyses supported these findings. Although most molecular variation was attributed to the intra-individual (inter-loci) and intra-nest (inter-individuals) levels, the inter-nest and inter- patch levels explained low, but significant propor-tions of the variation, i.e. 3 and 1.3% respectively (Table1).
Within patches
Within each wood patch, overall among-nest differenti-ation was significantly differently from zero (Fst (θ) ±
standard error: Fleringe: 0.035 ± 0.006, Hall: 0.021 ± 0.004, Hammarsänget: 0.044 ± 0.006; all p-values< 0.0001). Once standardized for polymorphism, these values of Fst were
Fst standardized= 0.138, 0.085 and 0.166 for Fleringe, Hall
and Hammarsänget, respectively.
The DAPC analysis revealed no obvious pattern of population structure in relation to host type (Fig.5). The
Fig. 4 Discriminant analysis of principal components representing among-nest genetic structure at the among patch scale. Proportion of among group variation is 47.0% on the horizontal and 29.7% on the vertical axis
a
b
Fig. 3 a Fis(f ± SE) and (B) Fst(θ ± SE) for each locus, over all infrapopulations. A star (*) next to the locus label indicates cases where p < 0.05, all markers gave a significant estimate in (b)
Table 1 Decomposition of genetic variation from among patch to intra-individual scales, ignoring host-associated structure
Spatial level Df % variation Statistics pvalue Among wood patches 2 1.3 Frt = 0.013 < 0.0001 Among nests/ Within wood patches 26 3.0 Fsr = 0.030 < 0.0001 Among individuals/ Within nests 598 26.8 Fst = 0.042 < 0.0001 Within individual 627 69.0 Fis = 0.280 < 0.0001
a
b
c
Fig. 5 Discriminant analysis of principal components representing among-nest genetic structure within patches. a Fleringe: Proportion of between group variation is 41.2% on the horizontal and 26.1% on the vertical axis. b Hall: Proportion of between group variation is 35.5% on the horizontal and 20.4% on the vertical axis. c Hammarsänget: Proportion of between group variation is 38.6% on the horizontal and 34.8% on the vertical axis
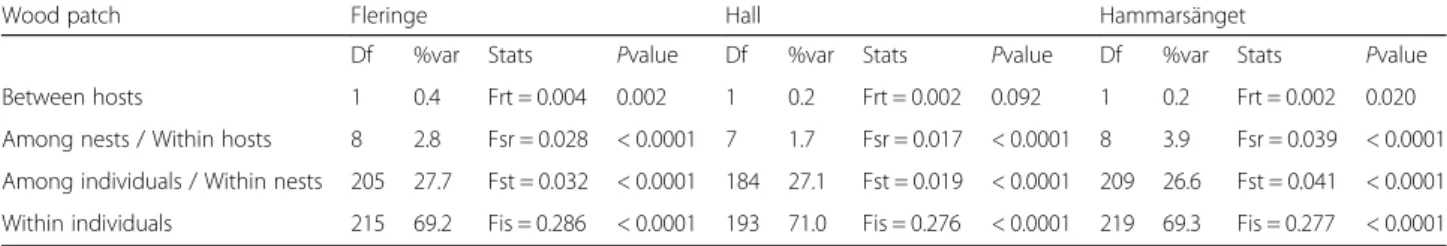
decomposition of total genetic variation within each patch revealed low but significant differentiation be-tween host-associated flea populations in two of the three patches at a threshold of 5% (Fleringe and
Hammarsänget, but not in Hall: Table 2). However,
based on the threshold value expected for k = 3 tests calculated by the generalized binomial procedure (P≤ 0.3689), the overall pattern of between-host differ-entiation was significant.
Evanno’s Delta k method suggested an optimal num-ber of clusters of k = 17, 2 and 5 for Fleringe, Hall and Hammarsänget respectively. We also compared the pat-terns of assignment to clusters corresponding to the second highest Delta k value (Fleringe: k = 15; Hall: k = 10; Hammarsänget: k = 9) to test how robust the genetic structure was with respect to the number of assumed
clusters. Regardless of the k-value considered, the results of STRUCTURE indicated shared group memberships among nests and no obvious correspondence with host species (see Additional file2for graphical results).
The test for isolation by distance was significant for Hall (p = 0.01), where between host differentiation was not significant at the 0.05 threshold. In the two other patches, isolation by distance signals differed between host species, (Fleringe: overall: p = 0.07, among tit nests:
p = 0.105, among flycatcher nests: p = 0.025;
Hammar-sänget: overall: p = 0.07, among tit nests: p = 0.040, among flycatcher nests: 0.740; see Additional file 3 for graphical results). The p-values obtained corresponded to an overall significant pattern of isolation by distance across patches according to the generalized binomial procedure.
Table 2 Decomposition of genetic variation from the between-host to the intra-individual scales within each patch
Wood patch Fleringe Hall Hammarsänget
Df %var Stats Pvalue Df %var Stats Pvalue Df %var Stats Pvalue Between hosts 1 0.4 Frt = 0.004 0.002 1 0.2 Frt = 0.002 0.092 1 0.2 Frt = 0.002 0.020 Among nests / Within hosts 8 2.8 Fsr = 0.028 < 0.0001 7 1.7 Fsr = 0.017 < 0.0001 8 3.9 Fsr = 0.039 < 0.0001 Among individuals / Within nests 205 27.7 Fst = 0.032 < 0.0001 184 27.1 Fst = 0.019 < 0.0001 209 26.6 Fst = 0.041 < 0.0001 Within individuals 215 69.2 Fis = 0.286 < 0.0001 193 71.0 Fis = 0.276 < 0.0001 219 69.3 Fis = 0.277 < 0.0001
Fig. 6 Per infrapopulation average relatedness (blue lines) ± SE (black lines). Red lines show the upper and lower bounds of expected values under a random hypothesis. A star (*) next to the nest label indicates cases where p < 0.05
Within nests
Patch-wide average Fisestimates per nest were all
signifi-cantly greater than zero (Fis values: Fleringe: 0.246 ±
0.078, Hall: 0.242 ± 0.075, Hammarsänget: 0.232 ± 0.071, all p-values< 0.0001) suggesting within nest substructure and/or inbreeding. For all three patches, mean pairwise relatedness within each nest indicated that individuals within a nest were frequently more closely related than individuals selected at random in the patch (relatedness significantly higher than random: 8/10 nests in Fleringe, 5/9 in Hall and 6/10 in Hammarsänget; Fig.6). Moreover, clustering analyses suggested that some nests could shelter different flea sub-populations (See for instance
nests HM19, HM9 and HL 19 in Additional file 2),
corresponding to the co-existence of different flea lineages within nests.
Discussion
In this study, we assessed the population genetic structure of a common avian ectoparasite exploiting two of its main host species at different spatial scales in a fragmented landscape, i.e. within and among populations and infrapo-pulations. Our study aimed to test whether this genetic structure matched expected patterns based on previous experimental results that revealed parasite maladaptation and host specialization in part of the study area [20, 21]. Based on these patterns, we hypothesized that flea population structure should reveal low among-nest and/or among-patch gene flow and signs of host-associated genetic divergence, at least in some localities. Our results show significant genetic structure occurs at all spatial scales investigated and between hosts, which suggests low overall dispersal of hen fleas.
Differentiation of hen fleas among nests and patches
As genetic variation was significantly structured at the level of the wood patch, the three woods sampled here were treated as three replicates for studying fine-scale spatial structure. Within each patch, nests were genetically differentiated, with standardized values of Fstranging from
8 to 17%. The low overall dispersal of hen fleas we found contradicts previous observations in which artificially deparasitized nest boxes were rapidly recolonized due, presumably, to high dispersal rates [41]. However, these observations could be due to fleas of the same infrapopu-lations remaining outside, but close to boxes and not to among-box dispersal per se. Moreover, not all dispersal events may be followed by successful reproduction and therefore lead to gene flow. Indeed, density-dependent reproduction has been described in hen flea infrapopula-tions [42] and may prevent dispersers from achieving reproductive success when they arrive in already abundant infrapopulations.
Given among patch differentiation and the tendency for significant patterns of isolation by distance among nests within patches, hen flea dispersal is likely to be a step by step process, with fleas dispersing over short distances between neighboring nests. Fleas are thought to disperse mostly at the beginning of spring, when adults emerge from overwintering cocoons in response to increasing temperatures [43, 44]. Fleas can disperse either by jumping/ crawling on the ground [43] or by jumping on prospecting birds when they visit cavities [44]. Dispersal may also be possible at the end of the breeding season with the post-breeding prospecting movements of fledglings or adults [45] or with accidental hosts such as small mammals that temporarily use nest boxes. However, as passerines and small rodents exhibit preening/grooming behaviors [46], such a dispersal mechan-ism is more likely to occur over short distances. Laboratory experiments are now called for to quantify the potential for independent flea dispersal from one cavity to another, and therefore evaluate the relative use of independent vs host-associated dispersal.
Among patch differentiation in fleas that takes into account both inter- and intra-nest variation (Frt= 0.013) is
approximately twice as high as that previously estimated for great tits on Gotland at the among patch level (for 10 patches with distances ranging from 3 to 50 km, Fst= 0.006, [47]). Although this estimate for great tits was
not standardized for the Fstmax value [27], the levels of
polymorphism observed for great tits [47, 48] and hen fleas (here) are similar and allow us to make a direct com-parison of the two raw values. Hen flea maladaptation on Gotland, revealed experimentally [20], could therefore be at least partly explained by the lower relative dispersal of the parasite compared to its main host [2]. Although intuitive, lower parasite dispersal compared to their hosts may not be a general trend. A recent meta-analysis showed that parasites are frequently less structured than their hosts [49]. As an example, higher parasite dispersal was inferred in a system composed of bats and wingless bat flies [50]. Bat flies typically live in the host fur or on wing membranes [50, 51], which could result in a rather frequent bat to bat dispersal. In con-trast, hen fleas live in nest material rather than on the host itself [42] reducing this dispersal potential. Be-cause hen fleas live largely off-host, their reproductive success also depends on local environmental conditions [42]; in bat flies incubate larvae within their abdomen [51] and reproductive success after dispersal may thus be less dependent on new local conditions. Finally, bats are colonial animals [52] which can favour effective parasite transmission, compared to more solitary breeders like great tits and collared flycatchers. In gen-eral, therefore, the dispersal ability of ectoparasites, and their associated population genetic structure, will depend
on a combination of parasite and host biology, ecology and social behaviors.
Population structure of hen fleas within nests
We found that flea infrapopulations (i.e., fleas within a nest) deviated significantly from Hardy-Weinberg proportions. This result may be due to either inbreeding (i.e. mating with relatives) and/or the presence of different family groups within nests (i.e., a local Wahlund effect, [53]); both processes likely occurred within nest boxes. Inbreed-ing is supported by the fact that most nests showed higher relatedness values than expected in the overall population of each patch. A Wahlund effect is supported by clustering analyses, which indicated the co-existence of fleas from different clusters within some nests. Clusters may be due either to the presence of dispersing fleas that did not yet mix with the rest of the local nest population, or to a par-ticular mating structure within nests such as homogamy (i.e. mating with individuals with similar traits, such as size [53]). Given the relatively low dispersal rate suggested here for the flea, this latter explanation may be more likely. Moreover, multiple mating has been described in this flea species [54], which should enhance the rapid genetic mix-ing of local individuals and dispersers if matmix-ing is random.
Between host differentiation of hen fleas
Population differentiation in relation to host species was observed here, suggesting that despite small scale gene flow, population divergence is occurring between fleas exploiting tits and flycatchers. This result matches fitness differences observed in a cross-infestation experiment of hen fleas between great tits and collared flycatchers on the same island [21]. In this experiment: (i) fleas originating from tit nests tended to cause higher damage to tit hosts compared to fleas originating from flycatcher nests, and (ii) fleas originating from flycatcher nests frequently had faster larval development rates than fleas originating from tit nests when infesting flycatcher nests. However, in this experiment, the effect of flea origin differed among localities. This spatial variation in apparent host specialization matches the variable pattern of population genetic structure among patches we found in the present study and suggests a geographic mosaic-like pattern in the coevolutionary interactions between fleas and their bird hosts [55]. Although the two host species considered here share the same breeding habitat and are present in similar abundances in the studied patches, they have contrasting life history and ecological traits that may exert divergent selection on hen fleas. First, collared flycatchers are trans-saharian migratory birds, whereas great tits are resident or partial, short-distance migrants. Migratory behavior can modify breeding phenology and alter energy allocation among functions, particularly to immune function
[56–58]. Second, great tits and collared flycatchers use different nest materials. The moss used by great tits was suggested to modulate the development of fleas and alleviate parasitic costs for hosts [19]. Finally, great tits have longer reproductive periods and larger clutch sizes than collared flycatchers [59]. Great tits may therefore provide more food resources for adult fleas and a suitable environment for the development of flea larvae (regarding e.g. heat or humidity) for a longer period than flycatchers.
Because fleas sampled in the nest of a given host species were suggested to perform less well when infesting the alternative host [21], host specialization may act to reinforce population isolation. If offspring from crosses between fleas specialized on different host species perform poorly on both host species, for example, assortative mat-ing by host species of origin could be favored and effective dispersal would be limited. Isolation among fleas infesting different host species could also result from great tits and collared flycatchers using slightly different microhabitats within patches due to interspecific competition for resources, as observed between pied and collared flycatchers in a sympatric zone [60]. Preferences for particular tree types or forest coverage could limit flea dispersal to alternative host nests. Flea dispersal could also be actively biased toward the host they are specialized on. This requires that fleas are able to discriminate among hosts during dispersal, a hypothesis that could be investigated in future experiments. Indeed, experimental work in a rodent-flea system showed that flea species used odor cues to dis-criminate between alternative sympatric host species [61]. Finally, great tits start breeding a couple of weeks earlier than collared flycatchers [59]. This difference could also lead to the temporal isolation of flea populations.
Hen flea populations on Gotland could either be at an equilibrium between selection and gene flow, such that the between-host genetic structure observed here is main-tained across generations, or they could be undergoing specialization that could lead to increasing population structure between the different host species over time (i.e. ecological speciation with gene flow; [62]). The sampled populations in our study were only left undisturbed for a relatively short time before sampling (6 years) and may therefore be at the beginning of the specialization process. Repeat sampling of the same patches over several years using a non-destructive method (i.e. sampling fleas without destroying the nests) would be required to assess whether the observed between-host structure we found may lead to sympatric speciation or whether gene flow and/ or inter-annual stochasticity may balance out host-asso-ciated patterns of divergence [4, 63]. Additionally, al-though difficult to obtain, fleas sampled from natural bird cavities would be useful to check whether results from artificial cavities correspond to interactions under natural breeding conditions.
Conclusions
Hen flea populations were genetically structured across the study area and the observed patterns of spatial and host-associated differentiation fell in line with the results of previous experiments in this multi-host-parasite system. Our results suggest that the observed hen flea maladapta-tion to its main host, the great tit, could be explained by low parasite dispersal compared to its host. Limited dispersal may also account for the between-host patterns we found, where low gene flow favors host-associated selection and adaptation. The results of our population genetic study therefore provide essential new elements for understanding the ecology and coevolutionary trajectories of the hen-flea passerine system. Because this system represents a popular model system to study host-parasite interactions and evolution in the wild [1,54,64–67], our results are particularly relevant for other studies, especially experimental studies involving parasite translocations. For example, because infrapopulations within a single patch are genetically differentiated among and within host species, controlling for flea origin in experiments may be crucial. The generality of the presented results should now be tested in other study areas of this host-parasite system, and in particular in areas with different host communities.
More generally, our study sheds empirical light on the relationship between the two evolutionary phenomena acting here: local adaptation and host specialization. We suggest that there may be a feedback loop between local maladaptation and host specialization; low dispersal of the parasite can prevent local adaptation of the parasite population, but it can also prevent parasites from shifting hosts within their lifetime, therefore enhancing host-asso-ciated selective pressures on the parasite. Parasite specialization to particular host types may then, in turn, reduce the dispersal potential of the parasite (as dispersal to the wrong host type would result in low reproductive success) and enhance parasite maladaptation. Modelling and experimental studies with fast-evolving organisms would be helpful to test this relationship, and would provide exciting new perspectives for understanding the evolutionary ecology of host-parasite systems.
Additional files
Additional file 1:This file contains two tables: Table S1. Genetic diversity at each locus for each population & Table S2. Allelic richness at each locus for each population (PDF 162 kb).
Additional file 2:This file contains figures representing the probability of individual flea assignment to the k clusters computed by STRUCTURE, for each patch (PDF 202 kb).
Additional file 3:This file contains graphs representing the isolation by distance within each patch, not considering host-associated structure (PDF 86 kb).
Abbreviations
FL:Fleringe; HL: Hall; HM: Hammarsänget; DNA: Deoxyribonucleic acid; PCR: Polymerase Chain Reaction; EDTA: Ethylenediaminetetraacetic acid; DAPC: Discriminant Analysis of Principal Component; PCA: Principal Component Analysis; DA: Discriminant Analysis; AMOVA: Analysis of Molecular VAriance
Acknowledgements
We are grateful to all the students involved in the sampling work and surveys: Morgane Manoury, Quentin Delfour, Teddy Urvois, Audrey Le Pogam, Schédir Marchesseau, Camille Huguet, Charley Chancelier, Marion Robillard, Quentin Mauvisseau, Nicolas Gal, Léa Darquié, Elise Coquillard and Elodie Toucheboeuf. We also acknowledge land owners who allowed us to conduct our study in their woods, Mårten Hjernquist for maps and advice about the sampling areas, and Lars Gustafsson for practical assistance.
Funding
The study was financially supported by the French Ministry of Higher Education and Research, the Swiss National Science Foundation, the Région Rhône-Alpes (Explora’doc student mobility grant) and the French National Center for Scientific Research (CNRS). Funding agencies did not participate in or influence study design, data collection, analysis and interpretation, nor writing of the manuscript.
Availability of data and materials
The datasets used and analyzed during the current study are available from the corresponding author on reasonable request.
Authors’ contributions
Study design and practical planning of field sampling was achieved by Anaïs Appelgren (AA), Heinz Richner (HR), Blandine Doligez (BD) and Karen McCoy (MC). Field sampling was achieved by AA, assisted by the students cited in the acknowledgement section. Laboratory analyses were performed by AA and Verena Saladin (VS). Data analysis and interpretations were performed by AA and KM. Maps and figures were produced by AA. Drafting of the manuscript was achieved by AA and substantial revisions were provided by VS, HR, BD and KM. All authors have read and approved the publication of the present manuscript.
Ethics approval and consent to participate
Sampling fleas from old passerine nests is not subject to specific authorization from Ethical committees in Sweden. Collection of specimens used in this study complied with institutional and national guidelines in Sweden, France and Switzerland.
Competing interests
The authors declare that they have no competing interests.
Publisher’s Note
Springer Nature remains neutral with regard to jurisdictional claims in published maps and institutional affiliations.
Author details
1Evolutionary Ecology Laboratory, Institute of Ecology and Evolution,
University of Bern, Baltzerstrasse 6, Bern, Switzerland.2CNRS; Université de Lyon, F-69000, Lyon; Université Lyon 1; Department of Biometry and Evolutionary Biology, LBBE UMR 5558, Bâtiment Gregor Mendel, 43 boulevard du 11 novembre 1918, F-69622, Villeurbanne, France.3Department of
Biometry and Evolutionary Biology, LBBE UMR 5558, Bâtiment Gregor Mendel, Université Lyon 1, 43 boulevard du 11 novembre 1918, F-69622 Villeurbanne, France.4Maladies Infectieuses & Vecteurs: Ecologie, Génétique,
Evolution & Contrôle (MIVEGEC), Université de Montpellier– CNRS – IRD, Centre IRD, 911 avenue, Agropolis, BP 64501, F-34000 Montpellier, France.
5Department of Ecology and Genetics/Animal Ecology, Evolutionary Biology
Centre (EBC), University of Uppsala, Norbyvägen 18D, 752 36 Uppsala, Sweden.
Received: 20 December 2017 Accepted: 30 May 2018
References
1. Combes C. Parasitism: the ecology and evolution of intimate interactions. Chicago: University of Chicago Press; 2001.
2. Gandon S, Capowiez Y, Dubois Y, Michalakis Y, Olivieri I. Local adaptation and gene-for-gene coevolution in a metapopulation model. Proc R Soc Lond B Biol Sci. 1996;263:1003–9.
3. Gandon S, Michalakis Y. Local adaptation, evolutionary potential and host– parasite coevolution: interactions between migration, mutation, population size and generation time. J Evol Biol. 2002;15:451–62.
4. Bruyndonckx N, Henry I, Christe P, Kerth G. Spatio-temporal population genetic structure of the parasitic mite Spinturnix bechsteini is shaped by its own demography and the social system of its bat host. Mol Ecol. 2009;18: 3581–92.
5. Gandon S. Local adaptation and the geometry of host–parasite coevolution. Ecol Lett. 2002;5:246–56.
6. Morgan AD, Gandon S, Buckling A. The effect of migration on local adaptation in a coevolving host–parasite system. Nature. 2005;437:253–6. 7. Whitlock MC. The red queen beats the jack-of-all-trades: the limitations on
the evolution of phenotypic plasticity and niche breadth. Am Nat. 1996;148: S65–77.
8. Lajeunesse MJ, Forbes MR. Host range and local parasite adaptation. Proc R Soc Lond B Biol Sci. 2002;269:703–10.
9. Filchak KE, Roethele JB, Feder JL. Natural selection and sympatric divergence in the apple maggot Rhagoletis pomonella. Nature. 2000;407: 739–42.
10. McCoy KD, Chapuis E, Tirard C, Boulinier T, Michalakis Y, Le Bohec C, et al. Recurrent evolution of host-specialized races in a globally distributed parasite. Proc R Soc Lond B Biol Sci. 2005;272:2389–95.
11. De Meeûs T, Koffi BB, Barré N, de Garine-Wichatitsky M, Chevillon C. Swift sympatric adaptation of a species of cattle tick to a new deer host in New Caledonia. Infect Genet Evol. 2010;10:976–83.
12. Kempf F, De Meeûs T, Vaumourin E, Noel V, Taragel’ová V, Plantard O, et al. Host races in Ixodes ricinus, the European vector of Lyme borreliosis. Infect Genet Evol. 2011;11:2043–8.
13. Dietrich M, Kempf F, Boulinier T, McCoy KD. Tracing the colonization and diversification of the worldwide seabird ectoparasite Ixodes uriae. Mol Ecol. 2014;23:3292–305.
14. Dietrich M, Lobato E, Boulinier T, McCoy KD. An experimental test of host specialization in a ubiquitous polar ectoparasite: a role for adaptation? J Anim Ecol. 2014;83:576–87.
15. McCoy KD, Léger E, Dietrich M. Host specialization in ticks and transmission of tick-borne diseases: a review. Front Cell Infect Microbiol. 2013;3:57. doi:https://doi.org/10.3389/fcimb.2013.00057.
16. Tripet F, Richner H. The coevolutionary potential of a‘generalist’parasite, the hen flea Ceratophyllus gallinae. Parasitology. 1997;115:419–27.
17. Richner H, Oppliger A, Christe P. Effect of an Ectoparasite on reproduction in great tits. J Anim Ecol. 1993;62:703–10.
18. Fitze PS, Clobert J, Richner H. Long-term life-history consequences of ectoparasite-modulated growth and development. Ecology. 2004;85:2018–26. 19. Lemoine M, Doligez B, Passerault M, Richner H. Influence of host profitability
and microenvironmental conditions on parasite specialization on a main and an alternative hosts. J Evol Biol. 2011;24:1212–25.
20. Lemoine M, Doligez B, Richner H. On the equivalence of host local adaptation and parasite maladaptation: an experimental test. Am Nat. 2011; 179:270–81.
21. Appelgren A, McCoy KD, Richner H, Doligez B. Relative fitness of a generalist parasite on two alternative hosts: a cross-infestation experiment to test host specialization of the hen flea Ceratophyllus gallinae (Schrank). J Evol Biol. 2016;29:1091–101.
22. Binz T, Bonfils D, Balloux F, Richner H. Isolation and characterization of 23 microsatellite loci in the hen flea Ceratophyllus gallinae. Mol Ecol Resour. 2003;3:215–7.
23. Rousset F. genepop’007: a complete re-implementation of the genepop software for windows and Linux. Mol Ecol Resour. 2008;8:103–6. 24. Van Oosterhout C, Hutchinson WF, Wills DP, Shipley P. MICRO-CHECKER:
software for identifying and correcting genotyping errors in microsatellite data. Mol Ecol Resour. 2004;4:535–8.
25. Goudet J. FSTAT (version 1.2): a computer program to calculate F-statistics. J Hered. 1995;86:485–6.
26. Weir BS, Cockerham CC. Estimating F-statistics for the analysis of population structure. Evolution. 1984;38:1358–70.
27. Hedrick PW. A standardized genetic differentiation measure. Evolution. 2005; 59:1633–8.
28. Meirmans PG. Using the AMOVA framework to estimate a standardized genetic differentiation measure. Evolution. 2006;60:2399–402.
29. Jombart T. Adegenet: a R package for the multivariate analysis of genetic markers. Bioinformatics. 2008;24:1403–5.
30. Team RC. R Core team. R: a language and environment for statistical computing R foundation for statistical computing, Vienna, Austria ISBN 3– 900051–07–0. 2013.
31. Peakall ROD, Smouse PE. GENALEX 6: genetic analysis in excel. Population genetic software for teaching and research. Mol Ecol Resour. 2006;6:288–95. 32. Peakall R, Smouse PE. GenAlEx 6.5: genetic analysis in excel. Population
genetic software for teaching and research-an update. Bioinformatics. 2012; 28:2537e2539.
33. Pritchard JK, Stephens M, Donnelly P. Inference of population structure using multilocus genotype data. Genetics. 2000;155:945–59.
34. Pritcharda JK, Wena X, Falushb D. Documentation for structure software: Version 2.3. 2009.
35. Earl DA. STRUCTURE HARVESTER: a website and program for visualizing STRUCTURE output and implementing the Evanno method. Conserv Genet Resour. 2012;4:359–61.
36. Evanno G, Regnaut S, Goudet J. Detecting the number of clusters of individuals using the software STRUCTURE: a simulation study. Mol Ecol. 2005;14:2611–20.
37. Teriokhin AT, De Meeûs T, Guégan J-F. On the power of some binomial modifications of the Bonferroni multiple test. Zh Obshch Biol. 2007;68:332–40. 38. De Meeûs T, Guégan J-F, Teriokhin AT. MultiTest V. 1.2, a program to
binomially combine independent tests and performance comparison with other related methods on proportional data. BMC Bioinformatics. 2009;10:443. 39. De Meeûs T. Statistical decision from k test series with particular focus on
population genetics tools: a DIY notice. Infect Genet Evol. 2014;22:91–3. 40. Queller DC, Goodnight KF. Estimating relatedness using genetic markers.
Evolution. 1989;43:258–75.
41. Heeb P, Werner I, Richner H, Kolliker M. Horizontal transmission and reproductive rates of hen fleas in great tit nests. J Anim Ecol. 1996;65:474– 84.
42. Tripet F, Richner H. Density-dependent processes in the population dynamics of a bird ectoparasite Ceratophyllus gallinae. Ecology. 1999;80:1267–77. 43. Bates JK, Rothschild M. Field studies on the behaviour of bird fleas: I.
Behaviour of the adults of three species of bird fleas in the field. Parasitology. 1962;52:113–32.
44. Humphries DA. The host-finding behaviour of the hen flea, Ceratophyllus gallinae (Schrank) (Siphonaptera). Parasitology. 1968;58:403–14.
45. Ponchon A, Gremillet D, Doligez B, Chambert T, Tveraa T, González-Solís J, et al. Tracking prospecting movements involved in breeding habitat selection: insights, pitfalls and perspectives. Methods Ecol Evol. 2013;4:143–50. 46. Moore J. Parasites and the behavior of animals: Oxford University Press; 2002. 47. Lemoine M, Lucek K, Perrier C, Saladin V, Adriaensen F, Barba E, et al. Low
but contrasting neutral genetic differentiation shaped by winter temperature in European great tits. Biol J Linn Soc. 2016;118:668–85. 48. Lemoine M. Local adaptation and dispersal ability in a host-parasite system
genetic and experimental approaches in the great tit (Parus major) and its main Ectoparasite, the hen flea (Ceratophyllus Gallinae). 2011.
49. Mazé-Guilmo E, Blanchet S, McCoy KD, Loot G. Host dispersal as the driver of parasite genetic structure: a paradigm lost? Ecol Lett. 2016;19:336–47. 50. Witsenburg F, Clement L, Lopez-Baucells A, Palmeirim J, Pavlinic I, Scaravelli D,
et al. How a haemosporidian parasite of bats gets around: the genetic structure of a parasite, vector and host compared. Mol Ecol. 2015;24:926–40. 51. Dick CW, Patterson BD. Bat flies: obligate ectoparasites of bats.
Micromammals macroparasites [Internet]. Springer, Tokyo; 2006 [cited 2018 Mar 15]. p. 179–194. Available from:https://link.springer.com/chapter/10. 1007/978-4-431-36025-4_11
52. Rodrigues L, Palmeirim JM. Migratory behaviour of the Schreiber’s bat: when, where and why do cave bats migrate in a Mediterranean region? J Zool. 2008;274:116–25.
53. Chevillon C, de Meeûs T, McCoy KD. Population genetics and molecular epidemiology of infectious diseases. In: Morand S, Beaudeau F, Cabaret J,
editor. New frontiers of molecular epidemiology of infectious diseases. Dordrecht: Springer; 2012. p. 45-76.
54. Krasnov BR. Functional and evolutionary ecology of fleas: a model for ecological parasitology. New York: Cambridge University Press; 2008. 55. Thompson JN. The geographic mosaic of coevolution. Chicago: University
of Chicago Press; 2005.
56. Altizer S, Bartel R, Han BA. Animal migration and infectious disease risk. Science. 2011;331:296–302.
57. Nowakowski JK. Vaehaetalo AV. is the great tit Parus major an irruptive migrant in north-East Europe? Ardea. 2003;91:231–44.
58. Weidinger K, Kral M. Climatic effects on arrival and laying dates in a long-distance migrant, the collared flycatcher Ficedula albicollis. Ibis. 2007;149:836–47. 59. Cramp S, Perrins CM. The birds of the western Palearctic. Vol. IX buntings
and New World warblers. Oxford: Oxford University Press; 1994.
60. Rybinski J, Sirkiä PM, McFarlane SE, Vallin N, Wheatcroft D, \AAlund M, et al. Competition-driven build-up of habitat isolation and selection favoring modified dispersal patterns in a young avian hybrid zone. Evolution 2016; 70:2226–2238.
61. Krasnov BR, Khokhlova IS, Oguzoglu I, Burdelova NV. Host discrimination by two desert fleas using an odour cue. Anim Behav. 2002;64:33–40. 62. Rundle HD, Nosil P. Ecological speciation. Ecol Lett. 2005;8:336–52. 63. McCoy KD. Host–parasite determinants of parasite population structure: lessons
from bats and mites on the importance of time. Mol Ecol. 2009;18:3545–7. 64. De Coster G, De Neve L, Martin-Galvez D, Therry L, Lens L. Variation in innate immunity in relation to ectoparasite load, age and season: a field experiment in great tits (Parus major). J Exp Biol. 2010;213:3012–8. 65. Brommer JE, Pitala N, Siitari H, Kluen E, Gustafsson L. Body size and immune
defense of nestling blue tits ( Cyanistes caeruleus ) in response to manipulation of Ectoparasites and food supply. Auk. 2011;128:556–63. 66. Basso A, Coslovsky M, Richner H. Parasite-and predator-induced maternal
effects in the great tit (Parus major). Behav Ecol. 2014;25:1105–14. 67. Wegmann M, Voegeli B, Richner H. Parasites suppress immune-enhancing