HAL Id: hal-02651008
https://hal.archives-ouvertes.fr/hal-02651008
Submitted on 29 May 2020
HAL is a multi-disciplinary open access
archive for the deposit and dissemination of
sci-entific research documents, whether they are
pub-lished or not. The documents may come from
teaching and research institutions in France or
abroad, or from public or private research centers.
L’archive ouverte pluridisciplinaire HAL, est
destinée au dépôt et à la diffusion de documents
scientifiques de niveau recherche, publiés ou non,
émanant des établissements d’enseignement et de
recherche français ou étrangers, des laboratoires
publics ou privés.
Devil Ray Conservation
Joshua D. Stewart, Fabrice R. A. Jaine, Amelia J. Armstrong, Asia O.
Armstrong, Michael B. Bennett, Katherine B. Burgess, Lydie I. E. Couturier,
Donald A. Croll, Melissa R. Cronin, Mark H. Deakos, et al.
To cite this version:
Joshua D. Stewart, Fabrice R. A. Jaine, Amelia J. Armstrong, Asia O. Armstrong, Michael B. Bennett,
et al.. Research Priorities to Support Effective Manta and Devil Ray Conservation. Frontiers in Marine
Science, Frontiers Media, 2018, 5, pp.UNSP 314. �10.3389/fmars.2018.00314�. �hal-02651008�
Edited by:
Mark Meekan, Australian Institute of Marine Science (AIMS), Australia
Reviewed by:
Camrin Braun, MIT/WHOI Joint Program in Oceanography, United States Nuno Queiroz, Centro de Investigação em Biodiversidade e Recursos Genéticos (CIBIO), Portugal Yannis Peter Papastamatiou, Florida International University, United States
*Correspondence:
Joshua D. Stewart [email protected]
Specialty section:
This article was submitted to Marine Megafauna, a section of the journal Frontiers in Marine Science
Received: 27 June 2018 Accepted: 15 August 2018 Published: 18 September 2018 Citation:
Stewart JD, Jaine FRA, Armstrong AJ, Armstrong AO, Bennett MB, Burgess KB, Couturier LIE, Croll DA, Cronin MR, Deakos MH, Dudgeon CL, Fernando D, Froman N, Germanov ES, Hall MA, Hinojosa-Alvarez S, Hosegood JE, Kashiwagi T, Laglbauer BJL, Lezama-Ochoa N, Marshall AD, McGregor F, Notarbartolo di Sciara G, Palacios MD, Peel LR, Richardson AJ, Rubin RD, Townsend KA, Venables SK and Stevens GMW (2018) Research Priorities to Support Effective Manta and Devil Ray Conservation. Front. Mar. Sci. 5:314. doi: 10.3389/fmars.2018.00314
Research Priorities to Support
Effective Manta and Devil Ray
Conservation
Joshua D. Stewart1,2*, Fabrice R. A. Jaine3,4, Amelia J. Armstrong5, Asia O. Armstrong5,
Michael B. Bennett5, Katherine B. Burgess5,6, Lydie I. E. Couturier7, Donald A. Croll8,
Melissa R. Cronin8, Mark H. Deakos9, Christine L. Dudgeon5, Daniel Fernando2,10,11,
Niv Froman2, Elitza S. Germanov6,12, Martin A. Hall13, Silvia Hinojosa-Alvarez14,
Jane E. Hosegood2,15, Tom Kashiwagi6,16, Betty J. L. Laglbauer17, Nerea Lezama-Ochoa18,
Andrea D. Marshall6, Frazer McGregor12, Giuseppe Notarbartolo di Sciara19,
Marta D. Palacios20, Lauren R. Peel2,21,22,23, Anthony J. Richardson24,25, Robert D. Rubin26,
Kathy A. Townsend27, Stephanie K. Venables6,21and Guy M. W. Stevens2
1Scripps Institution of Oceanography, La Jolla, CA, United States,2The Manta Trust, Dorchester, Dorset, United Kingdom, 3Sydney Institute of Marine Science, Mosman, NSW, Australia,4Department of Biological Sciences, Macquarie University,
Sydney, NSW, Australia,5School of Biomedical Sciences, The University of Queensland, St. Lucia, QLD, Australia,6Marine
Megafauna Foundation, Truckee, CA, United States,7Université de Brest, CNRS, IRD, Ifremer, UMR 6539 LEMAR, Plouzané,
France,8Coastal Conservation Action Lab, University of California, Santa Cruz, Santa Cruz, CA, United States,9Hawaii
Association of Marine Education and Research, Lahaina, HI, United States,10Department of Biology and Environmental
Science, Linnaeus University, Kalmar, Sweden,11Blue Resources Trust, Colombo, Sri Lanka,12Murdoch University, Perth,
WA, Australia,13Inter-American Tropical Tuna Commission, La Jolla, CA, United States,14Laboratory of Evolutionary Biology
and Bioinformatics, University of Barcelona, Barcelona, Spain,15Molecular Ecology and Fisheries Genetics Laboratory,
Bangor University, Bangor, United Kingdom,16Center for Fisheries, Aquaculture & Aquatic Sciences, Southern Illinois
University Carbondale, Carbondale, IL, United States,17Okeanos Research Centre of the University of the Azores, Horta,
Portugal,18AZTI - Tecnalia Marine Research Divison, Pasaia, Spain,19Tethys Research Institute, Milan, Italy,20Instituto
Politécnico Nacional (CICIMAR), La Paz, Mexico,21The School of Biological Sciences and the Oceans Institute, The
University of Western Australia, Perth, WA, Australia,22Save Our Seas Foundation –D’Arros Research Centre, Geneva,
Switzerland,23The Australian Institute of Marine Science, Crawley, WA, Australia,24Centre for Applications in Natural
Resource Mathematics (CARM), School of Mathematics and Physics, The University of Queensland, St. Lucia, QLD, Australia,25CSIRO Oceans and Atmosphere, Ecosciences Precinct, Dutton Park, Brisbane, QLD, Australia,26Pacific Manta
Research Group, Santa Rosa, CA, United States,27School of Science and Engineering, University of the Sunshine Coast,
Hervey Bay, QLD, Australia
Manta and devil rays are filter-feeding elasmobranchs that are found circumglobally in tropical and subtropical waters. Although relatively understudied for most of the Twentieth century, public awareness and scientific research on these species has increased dramatically in recent years. Much of this attention has been in response to targeted fisheries, international trade in mobulid products, and a growing concern over the fate of exploited populations. Despite progress in mobulid research, major knowledge gaps still exist, hindering the development of effective management and conservation strategies. We assembled 30 leaders and emerging experts in the fields of mobulid biology, ecology, and conservation to identify pressing knowledge gaps that must be filled to facilitate improved science-based management of these vulnerable species. We highlight focal research topics in the subject areas of taxonomy and diversity, life history, reproduction and nursery areas, population trends, bycatch and fisheries, spatial dynamics and
movements, foraging and diving, pollution and contaminants, and sub-lethal impacts. Mobulid rays remain a poorly studied group, and therefore our list of important knowledge gaps is extensive. However, we hope that this identification of high priority knowledge gaps will stimulate and focus future mobulid research.
Keywords: manta, mobula, devil ray, elasmobranch, management
INTRODUCTION
Manta and devil rays (collectively known as mobulids) are medium to large batoid fishes, reaching wingspans of up to seven meters and occupying primarily pelagic, offshore marine habitats (Couturier et al., 2012). These filter-feeding species are found circumglobally in tropical and subtropical waters where they exploit a broad range of oceanographic regimes, from productive equatorial upwelling systems to oligotrophic tropical seas (Couturier et al., 2012; Stewart et al., 2017a). Although relatively understudied for most of the Twentieth century, public awareness, and scientific research on these species has increased dramatically in recent years. Much of this attention has been in response to targeted fisheries (White et al., 2006; Croll et al., 2016), international trade in mobulid products (O’Malley et al., 2016), and a growing concern over the fate of exploited populations (Ward-Paige et al., 2013; Lewis et al., 2015; White et al., 2015). Over the past decade, research advances on the biology and ecology of mobulid rays have supported a number of international, national, and local management actions focused on halting or reversing population declines (Croll et al., 2016).
The majority of previous research efforts have focused on manta rays (previously genus Manta but now included in genus Mobula; White et al., 2017), due in part to their popularity with the dive community and high ecotourism value (O’Malley et al., 2013). Mobula alfredi is the best studied member of the family due to its coastal distribution (Kashiwagi et al., 2011) and relatively predictable visitation to coastal aggregation sites such as cleaning stations (Marshall et al., 2011; Jaine et al., 2012). These attributes facilitate field research activities and allow for long-term monitoring of populations that is critical for studying the ecology, life history, and population dynamics of the species (e.g., Stevens, 2016). In contrast, the species in the family more associated with offshore habitats (i.e., many devil rays) are challenging to study in the field and are better known from specimens captured in fisheries (White et al., 2006; Fernando and Stevens, 2011; Croll et al., 2016; Pardo et al., 2016a; Stewart et al., 2017a). Recent public and conservation interest in devil rays has resulted in more targeted field efforts to study these species, leading to a growing understanding of their movements and habitat use (e.g.,Croll et al., 2012; Thorrold et al., 2014).
Despite progress in mobulid research over the past decade, major knowledge gaps still exist. Considerable action has been taken to curb targeted fisheries for these species, but bycatch remains a persistent threat (Croll et al., 2016). Fisheries impacts are currently the most acute threat to mobulids and are the main focus of management strategies (Lawson et al., 2017). However, little management attention has been directed toward the impacts
of pollution, habitat degradation, and climate change on already-depleted mobulid populations. To develop effective management strategies and prioritize conservation actions for mobulid rays, a number of pressing knowledge gaps must be filled on the life history, biology, ecology, taxonomic status, and population dynamics of these species.
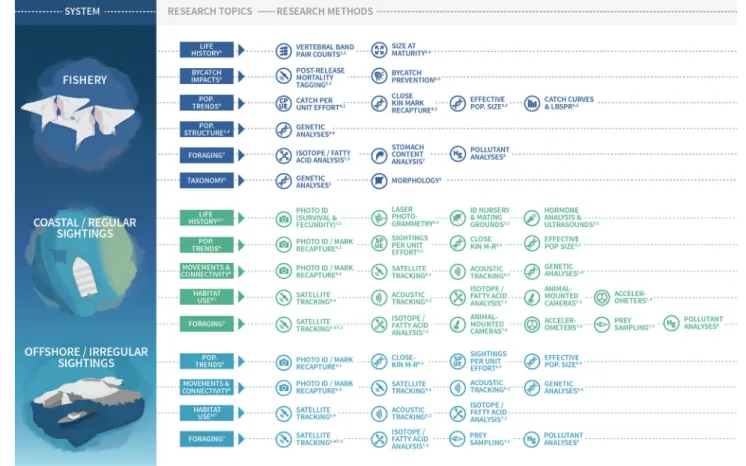
Here we describe priority questions for future mobulid ray research. Our aim is to identify the most critical questions for conservation scientists to address in the coming decade. We have organized these priority questions around nine themes that we consider vital to improving different aspects of management of mobulids: 1. Taxonomy and diversity; 2. Life history; 3. Reproduction and nursery areas; 4. Population trends; 5. Bycatch and fisheries; 6. Spatial dynamics and movements; 7. Foraging and diving; 8. Pollution and contaminants; and 9. Sub-lethal impacts. (See Figure 1 for a graphical table of contents). Within each theme, we describe methods that have been successfully applied to other taxa and provide suggestions about how these could be adapted for use in future mobulid research. Mobulid rays remain a poorly studied group, and therefore our list of important knowledge gaps is extensive. However, we hope that this identification of high priority knowledge gaps will stimulate and focus future mobulid research.
1. TAXONOMY AND DIVERSITY
Taxonomic clarity is a fundamental requirement for species conservation and management. Without it, human impacts on evolutionary and ecologically distinct groups cannot be accurately evaluated. Key advances in this field include an initial revisionary study of the genus Mobula (Notarbartolo di Sciara, 1987), the resurrection of M. alfredi, splitting the genus Manta into two species (Marshall et al., 2009), a redescription of M. kuhlii (Notarbartolo di Sciara et al., 2017), and a recent phylogenetic reclassification of the mobulid ray family (Mobulidae) that proposes a single genus (Mobula) and eight species where there were previously 11 (White et al., 2017). Despite considerable progress over the past three decades, more work is needed to fully characterize diversity within the Mobulidae.
1.1. Clarifying Existing Taxonomy
There is an urgent requirement to resolve species boundaries further in the genus Mobula to underpin conservation and management.White et al. (2017)synonymized M. rochebrunei and M. hypostoma, M. eregoodootenkee and M. kuhlii, and M. japanica and M. mobular, and proposed a single genus, lumping Manta into Mobula. Previous work supports the
FIGURE 1 | Graphical table of contents/research topics and methods for use in different mobulid study systems. Superscript numbers refer to sections in the paper with detailed descriptions and recommendations for future research addressing each topic and using each method. Figure design by Madeline Wukusick www. communique.design.
monophyly of the genus Mobula (Adnet et al., 2012; Poortvliet et al., 2015) and the lumping of M. mobular and M. japanica (Notarbartolo di Sciara, 1987; Poortvliet et al., 2015). It is important to note that in all cases of synonymy in White et al. (2017), the observed genetic relatedness between the lumped species is of comparable magnitude to that detected for M. alfredi and M. birostris. However, a more detailed population level study previously revealed them to be distinct species that had experienced introgression, obscuring genetic separation (Kashiwagi et al., 2012). In the case of M. kuhlii and M. eregoodootenkee, White et al. (2017) suggest that such a population level study might provide the evidence needed to recognize them as distinct species. Investigation into intra-specific variation using genomic data is lacking for most of the mobulid species. We therefore strongly recommend comprehensive population level studies of these species complexes as currently recognized, with the inclusion of morphological considerations. Such studies should also make use of genomic techniques and multi-locus analysis such as Restriction site Associated DNA Sequencing (e.g., Davey and Blaxter, 2010; Peterson et al., 2012). There is also a need to consider interactions between species given current evidence
for secondary contact in manta rays (Kashiwagi et al., 2012; Walter et al., 2014), and recent divergence times within the group (Poortvliet et al., 2015). The challenge, therefore, will be distinguishing distinct species where hybridization and historical introgression may occur.
Samples from across the known ranges of species of interest, including replicates within localities, should be collected and analyzed to minimize the introduction of ascertainment bias, and encompass intra-specific variation. In addition, given the morphological similarities among species, samples should be accompanied by photographs that allow for confident species identification and documentation of intra-specific variation. Clarifying the taxonomy of the M. hypostoma species complex (including those specimens formerly attributed to M. rochebrunei) will be particularly challenging, as few historical samples of M. rochebrunei were ever collected along the West African coastline. Given the scarcity of modern sightings and samples of M. rochebrunei and high rates of fishing in the region (Agnew et al., 2009), this collapse may lead to an underestimate of the species’ vulnerability to extinction, and highlights the susceptibility of mobulid rays to Illegal, Unreported and Unregulated (IUU) fishing. Future research should include a
comprehensive survey of the West African coastline to collect specimens and investigate diversity within the region. For the purposes of this paper, we identify existing research and knowledge gaps for M. eregoodootenkee and M. rochebrunei, and urge further taxonomic attention to resolve the M. kuhlii cf. eregoodootenkee and M. hypostoma cf. rochebrunei species complexes.
1.2. Cryptic Diversity
In addition to the currently recognized M. birostris and M. alfredi, a putative third species of manta ray in the Atlantic has been hypothesized for almost a decade (Marshall et al., 2009; Hinojosa-Alvarez et al., 2016; Stewart et al., 2018b). Conclusive molecular support and clear morphological descriptions based on sufficient population and genomic sampling are still lacking (Hinojosa-Alvarez et al., 2016). However, a formal description of M. cf. birostris is urgently needed to determine whether this is a distinct species or a subspecies of M. birostris, which will have implications for management. Rediscovery of cryptic diversity within manta rays in the early Twenty-first Century was the result of detailed morphological observation of many individuals of several populations combined with genetic analyses of multiple genes (Marshall et al., 2009; Kashiwagi et al., 2012). The lack of equivalent studies for the remaining devil rays indicates that currently undetected cryptic diversity within the group cannot be ruled out, and thus we recommend additional detailed taxonomic studies for mobulid rays generally. Further, population level sampling enables opportunities for studies to define Evolutionarily Significant Units (ESUs) for conservation prioritization. To support future morphometric and meristic-based studies, we strongly encourage research groups and collections to improve reference material at the population level to effectively catalog mobulid diversity. These should include tissue samples for molecular analysis; whole specimens where possible; partial specimens of species- and region-specific characters such as gill plates, spiral valves, and tooth-bands; and high-quality images with a scale bar of the dorsal, ventral, mouth, tail/dorsal fin, and spiracle views.
2. LIFE HISTORY
Life-history information is needed to estimate extinction risk, maximum population growth rates in data-poor species, and for performing stock assessments (Musick, 1999; Pardo et al., 2016a,b). Many chondrichthyans have highly conservative life-history characteristics, and mobulid rays have some of the most conservative traits, making them vulnerable to overfishing (Cortés, 2002; Dulvy et al., 2014; Croll et al., 2016). These slow-growing rays have very low rates of reproduction and long maturation times (Notarbartolo di Sciara, 1988; Marshall and Bennett, 2010; Dulvy et al., 2014; Pardo et al., 2016a; Stevens, 2016). Key life history parameters such as age at maturity, growth rate, lifespan, mortality (both natural and fisheries-induced) and fecundity are lacking for most mobulid species (Table 1). Estimating these parameters is crucial for assessing the vulnerability and demography of exploited populations (Campana et al., 2002; Goldman, 2005; Cailliet et al., 2006; García
et al., 2008; Dulvy et al., 2014). Wherever possible, life-history parameter estimates should be obtained and applied to management at the population level, as biological characteristics are likely to vary both among species and locations with variable environmental conditions. Regional differences may be especially relevant in broadly distributed species such as M. mobular, M. thurstoni, M. tarapacana, and M. birostris. Available estimates of mobulid extinction risk suggest that mobulid ray populations are unlikely to withstand current levels of fishing mortality, even in small-scale artisanal fisheries (Dulvy et al., 2014; Pardo et al., 2016a). Therefore, accurate estimates of life history parameters are urgently needed to assess the effectiveness of potential fisheries management scenarios.
2.1. Age and Growth
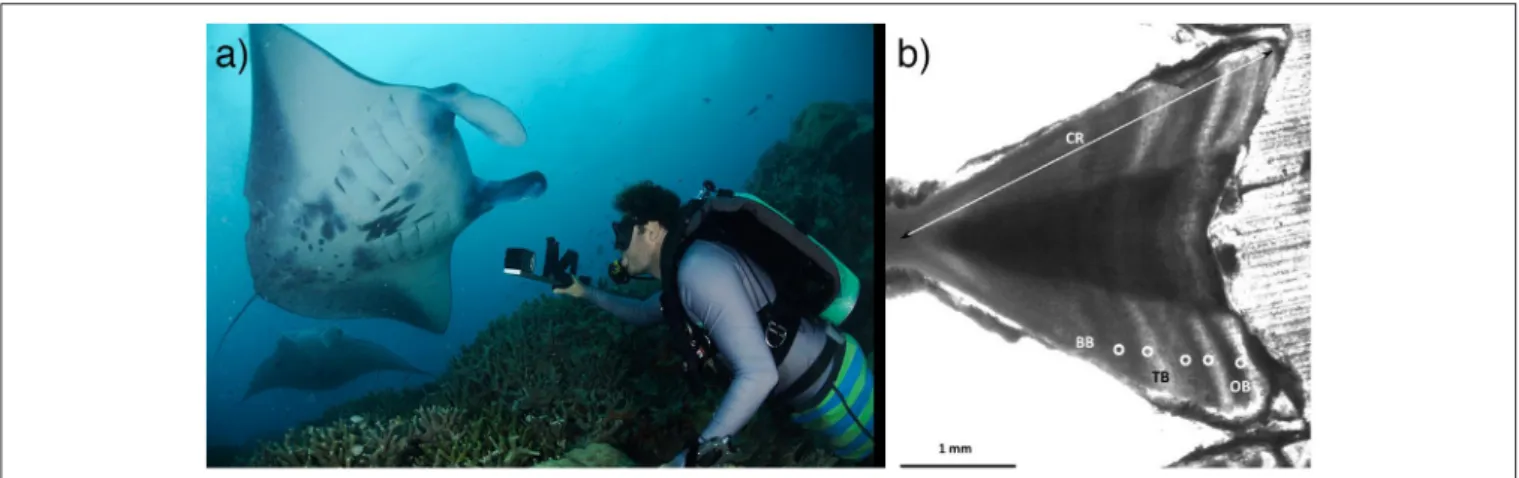
In elasmobranchs, growth is usually modeled by estimating the age of individuals of known size (disc width in rays) by counting growth bands on vertebral centra (Figure 2) or other hard parts such as fin spines (Cailliet et al., 2006). The vertebral centra of devil rays tend to be poorly calcified, which has hindered the use of this technique so far. Currently, only one data set has provided size-at-age estimates to model growth rates using vertebrae from the caudal region of M. mobular (previously M. japanica) from Mexico (Cuevas-Zimbrón et al., 2013; Pardo et al., 2016a). Further efforts should assess this method in other species and locations, since the extent of calcification may vary. Researchers should strive to obtain samples from a broad size-range and estimate growth parameters using a multi-model approach (i.e., including von Bertalanffy, Gompertz, or Logistic models) (Smart et al., 2016). In data-poor situations or when a size-class is poorly represented, back-calculation, or Bayesian methods may allow for adequate estimates (Cailliet et al., 2006; Pardo et al., 2016a). An important assumption is that each pair of opaque and translucent bands is deposited annually (Cailliet et al., 2006). Validating this assumption in mobulid rays could be attempted by injection of a fluorochrome label (e.g., calcein) into specimens in aquaria and confirming band periodicity post-mortem (Huveneers et al., 2013), although aquarium specimens may show atypical band deposition due to constant environmental conditions. Alternatively, radiocarbon (14C) dating of archival devil ray hard parts could provide a method of age validation by tracing this dated chemical marker released in high concentrations during atomic bomb testing in the 60–70 s (Campana et al., 2002). Additionally, researchers could evaluate the feasibility of using cesium isotopes released during the Fukushima nuclear accident to assist with age validation for mobulids in the western Pacific (Neville et al., 2014). Until validation is achieved, researchers can test band-pair deposition consistency across years as a means of verification (Cailliet et al., 2006).
Aging elasmobranchs using vertebrae relies on access to fished specimens and therefore is not appropriate in many wild mobulid ray populations. Direct estimates of growth rate can be obtained in-situ from morphometric measurements of resighted individuals over known time increments, based on visual size estimates (Kitchen-Wheeler et al., 2012; Kashiwagi, 2014; Stevens, 2016), paired laser photogrammetry (Deakos, 2010), or
T A B L E 1 | L ife h is to ry p a ra m e te rs fo r m a n ta a n d d e vi lr a ys . L if e-h is to ry p ar am et er M o b u la b ir o s tr is M o b u la al fr ed i M o b u la tar ap acan a M o b u la m o b u lar (M . jap an ica) M o b u la th u rs to n i M o b u la m u n ki an a M o b u la ku h li i M o b u la er eg o o d o o ten kee M o b u la ro ch eb ru n ei M o b u la h y p o s to m a S iz e a t bi rth (m m D W ) 2 ,0 0 0 ( R a m ba h in ia ri so n e t a l., 2 0 1 8 ; P h ili ppi n e s) . 1 ,3 0 0 – 1 ,5 00 ( M a rs h a ll e t a l., 2 0 0 9 ; S o u th A fr ic a a n d M o za m bi qu e ). 1 ,3 0 0 – 1 ,5 00 ( K a sh iw a g i, 2014 ; J a pa n ). 1 ,3 0 0 – 1 ,6 00 ( S te ve n s, 2016 ; M a ldi ve s) . > 1,052 ( N ota rba rtol o di S c ia ra , 1987 ; G u lf of C a lif or n ia ). 920– 994 ( W h ite e t a l., 2006 ; In don e si a ). 1,659 ( N ota rba rtol o di S c ia ra a n d S e re n a , 1988 ; M e di te rr a n e a n ). 1,000 (Ra m ba h in ia ri son e t a l., 2018 ; P h ili ppi n e s) . 650– 850 ( N ota rba rtol o di S c ia ra , 1987 ; G u lf of C a lif or n ia ). 900 ( R a m ba h in ia ri son e t a l., 2018 ; P h ili ppi n e s) . 350– 360 ( N ota rba rtol o di S c ia ra , 1987 ; G u lf of C a lif or n ia ). 480 (c a rr ie d e m br yo) ( R a n da ll, 1995 ; O m a n ). 310 ( C om pa gn o a n d L a st, 1999 ; W e ste rn C e n tr a l P a c ifi c ). 347– 423 (n e a r-te rm e m br yos , B roa dh u rs t a n d L a gl ba u e r u n pu bl is h e d; E a ste rn A u str a lia ). 340– 350 (n e a r-te rm e m br yos , C a de n a t, 1960 ; W e st C oa st of A fr ic a ). 550 ( M c E a c h ra n a n d C a rv a lh o, 2002 , W e ste rn C e n tr a lA tla n tic ). S iz e a t m a tu ri ty (m m D W ) 4 ,1 3 0 (fe m a le s) /3 ,7 5 0 (m a le s) ( W h ite e t a l., 2 0 0 6 ; In do n e si a ). 4 ,0 0 0 (m a le s) ( M a rs h a ll e t a l., 2 0 0 9 ; M o za m bi qu e ). 4 ,4 8 0 (fe m a le s) /3 1 8 9 (m a le s) ( R a m ba h in ia ri so n e t a l., 2 0 1 8 ; P h ili ppi n e s) . 3 ,3 7 0 (fe m a le s) /2 ,700– 2 ,8 0 0 (m a le s) ( D e a k o s, 2 010 ; H a w a ii) . 3 ,9 0 0 (fe m a le s) /3 ,000 (m a le s) ( M a rs h a ll a n d B e n n e tt, 2010 ; S o u th A fr ic a a n d M o za m bi qu e ). 3 ,2 0 0 – 3 ,3 00 (fe m a le s) /2 ,700– 2 ,8 0 0 (m a le s) ( S te ve n s, 2016 ; M a ldi ve s) . 2,500 (2,340– 2,522) (m a le s) ( W h ite e t a l., 2006 ; In don e si a ). > 2,360 (fe m a le s) /2016 (m a le s) ( N ota rba rtol o di S c ia ra , 1987 ; G u lf of C a lif or n ia ). 2,400– 2,500 (m a le s) /2,700– 2,800 (fe m a le s) (F e rn a n do, u n pu bl is h e d da ta ; S ri L a n k a , In di a , M a la ys ia ). 2,648 (fem a le s) /2,521 (m a le s) ( R a m ba h in ia ri son e t a l., 2018 ; P h ili ppi n e s) . 2,016 (m a le s) /> 2,360 (fe m a le s) ( N ota rba rtol o di S c ia ra , 1987 ; G u lf of C a lif or n ia ). 2,050– 2,100 (m a le s) ( W h ite e t a l., 2006 ; In don e si a ). 2,100 (m a le s) /2,070 (fe m a le s) (F e rn a n do, u n pu bl is h e d da ta ; S ri L a n k a , In di a , M a la ys ia ). 2,178 (fe m a le s) /2058 (m a le s) ( R a m ba h in ia ri son e t a l., 2018 ; P h ili ppi n e s) . 1,500 (m a le s) ( W h ite e t a l., 2006 ; In don e si a ). 1,538 (m a le s) ( N ota rba rtol o di S c ia ra , 1988 ; G u lf of C a lif or n ia ). 1,636 (fem a le s) /1,584 (m a le s) ( R a m ba h in ia ri son e t a l., 2018 ; P h ili ppi n e s) . 820 (m a le s) ( N ota rba rtol o di S c ia ra , 1987 ; G u lf of C a lif or n ia ). 910 (fe m a le s) ( V ill a vi c e n c io-G a ra yz a r, 1991 , M e xi c o) . 980 (m a le s) /970 (fe m a le s) ( L ope z, 2009 ) 1,150– 1,190 (m a le s) ( W h ite e t a l., 2006 ; In don e si a ). 1,020– 1,033 (m a le s) /1,168 (pr e gn a n t fe m a le ) ( N ota rba rtol o di S c ia ra e t a l., 2017 ). 990 (m a le s) /925 (fe m a le s) ( B roa dh u rs t e t a l., 2018 ; E a ste rn A u str a lia ). 1,100 (m a le s) 1,190 (fe m a le s) / ( C a de n a t, 1960 ; W e st C oa st of A fr ic a ). 1,117 ( C ol e s, 1916 ; N or th C a rol in a ). 1,140 (m a le s) / 1,110 (fe m a le s) ( B ige low a n d S c h roe de r, 1953 ; W e ste rn N or th A tla n tic ). A g e a t m a tu ri ty U n k n o w n 3 – 6 y ear s (m a le s) ( M a rs h a ll e t a l., 2 0 1 1 ; M o za m bi qu e ). 4– 9 y ear s (m a le s) /8– 15 y ear s (fe m a le s) ( K a sh iw a g i, 2014 ; J a pa n ). 9 – 1 3 y ear s (m a le s) /1 3 – 17 y ear s (fe m a le s) ( S te ve n s, 2016 ; M a ldi ve s) . 5 y ear s (m a le ) ( N o zu e t a l., 2 0 1 7 ; J a pa n ; in cap ti v it y ). U n k n ow n N on -v a lida te d e sti m a te d a ge a t m a tu ri ty (on e ba n d pa ir pe r ye a r) : 10 y ear s ( P a rdo e t a l., 2016a ; M e xi c o) . U n k n ow n U n k n ow n U n k n ow n U n k n ow n U n k n ow n U n k n ow n (C on ti n u e d)
T A B L E 1 | C o n tin u e d L if e-h is to ry p ar am et er M o b u la b ir o s tr is M o b u la al fr ed i M o b u la tar ap acan a M o b u la m o b u lar (M . jap an ica) M o b u la th u rs to n i M o b u la m u n ki an a M o b u la ku h li i M o b u la er eg o o d o o ten kee M o b u la ro ch eb ru n ei M o b u la h y p o s to m a M a xi m u m si ze (m m D W ) 7 ,1 0 0 ( C o m pa g n o , 1 9 9 9 ). 4 ,0 0 0 (m a le s) /5,000 (fe m a le s) ( Y a n o e t a l., 1 9 9 9 ; J a pa n ). 5 ,0 0 0 (fe m a le s) ( M a rs h a ll e t a l., 2 0 0 9 ; M o za m bi qu e ). 3 ,0 3 0 (m a le s) /3,640 (fe m a le ) ( D e a k os , 2 0 1 0 ; H a w a ii) . 3 ,1 0 0 (m a le s) /3,600 (fe m a le ) ( S te ve n s, 2 0 1 6 ; M a ldi ve s) . 3,040 (m a le s) /3,280 (fe m a le s) ( W h ite e t a l., 2006 ; In don e si a ). 3,100 (m a le s) /3,400 (fe m a le s) (F e rn a n do, u n pu bl is h e d da ta ; S ri L a n k a , In di a , M a la ys ia ). 2,400 (m a le s) / 2,840 (fe m a le s) ( W h ite e t a l., 2006 ; In don e si a ). 3,100 (Nota rba rtol o di S c ia ra , 1987 ; G u lf of C a lif or n ia ). 2,900? (m a le s) / 3,200 (fe m a le s) (F e rn a n do, u n pu bl is h e d da ta ; S ri L a n k a , In di a , M a la ys ia ). 1,681 (m a le s) /1,790 (fe m a le s) ( W h ite e t a l., 2006 ; In don e si a ). 1,770 (m a le s) /1,801 (fe m a le s) ( N ota rba rtol o di S c ia ra , 1988 ; G u lf of C a lif or n ia ). 1,830 (fe m a le s) (F e rn a n do, u n pu bl is h e d da ta ; P e ru ? ). 1,100 ( N ota rba rtol o di S c ia ra , 1987 ; G u lf of C a lif or n ia ). 1,300 (fe m a le ) (R oj a s, u n pu bl is h e d da ta ; P e ru ). 1,197 (m a le s) ( W h ite e t a l., 2006 ; In don e si a ). 1,100 (m a le s) /1,220 (fe m a le s) ( N ota rba rtol o di S c ia ra e t a l., 2017 ; A ra bi a n S e a ). 1,230 (m a le s) /1,300 (fe m a le s) ( B roa dh u rs t e t a l., 2018 ; E a ste rn A u str a lia ). 1,250 (m a le s) /1,330 (fe m a le s) ( C a de n a t, 1960 ; W e st C oa st of A fr ic a ). 1,219 ( C ol e s, 1916 ; N or th C a rol in a ). 1,290 ( P a te lla a n d B u lla rd, 2013 ; A la ba m a ). M a xi m u m a g e U n k n o w n , bu t > 2 8 y ear s ( M a rs h a ll e t a l., 2 0 1 1 ; R u bi n e t a l. u n pu bl is h e d da ta ). U n k n o w n , bu t> 30 y ear s ( H o m m a e t a l., 1 9 9 9; C la rk , 2 0 1 0 ; C o u tu ri e r e t a l., 2 0 1 4; K a sh iw a g i, 2014; S te ve n s, 2 016 ). U n k n ow n N on -v a lida te d e sti m a te d a ge a t m a tu ri ty (on e ba n d pa ir pe r ye a r) : 14 y ear s ( C u e va s-Zi m br ón e t a l., 2013 ; M e xi c o) . U n k n ow n U n k n ow n U n k n ow n U n k n ow n U n k n ow n U n k n ow n N a tu ra lm o rta lity ra te U n k n o w n bu t e sti m a te d fo r a g e n e ri c m a n ta ra y: 0 .0 1 2 – 0 .0 4 y ear − 1( D u lv y e t a l., 2 0 1 4 ). 0 .3 7 (0 .2 2 – 0 .5 4 9 5 % C I) for ye a r-1 ju ve n ile s in J a pa n ( K a sh iw a gi , 2 0 1 4 ). 0 .0 6 (0.05– 0 .0 7 9 5 % C I) for a du lts in J a pa n ( K a sh iw a g i, 2014 ) a n d n ear 0 for a du lts in e a ste rn A u str a lia ( C ou tu ri e r e t a l., 2 0 1 4 ) U n k n ow n 0.25 y ear − 1( P a rdo e t a l., 2016a ; M e xi c o) . U n k n ow n U n k n ow n U n k n ow n U n k n ow n U n k n ow n U n k n ow n M a xi m u m in tr in si c ra te o f po pu la tio n in c re a se (rm a x ) 0 .0 0 0 1 y ear − 1 (ba se d o n a g e a t fir st pr e g n a n c y) o r 0 .0 1 9 y ear − 1 (ba se d o n a g e a t m a tu ri ty ) ( R a m ba h in ia ri so n e t a l., 2 0 1 8 ; P h ili ppi n e s) E sti m a te d fo r a g e n e ri c m a n ta ra y: 0 .1 1 6 y ear − 1 ( D u lv y e t a l., 2 0 1 4 ). U n k n o w n bu t e sti m a te d for a g e n e ri c m a n ta ra y: 0 .1 1 6 y ear − 1( D u lv y e t a l., 2 0 1 4 ). U n k n ow n 0.077 y ear − 1(on e ba n d pa ir pe r ye a r) ( P a rdo e t a l., 2016a ; M e xi c o) . 0.012 y ear − 1(ba se d on a ge a t fir st pr e gn a n c y) or 0.016 y ear − 1(ba se d on a ge a t m a tu ri ty ) ( R a m ba h in ia ri son e t a l., 2018 ; P h ili ppi n e s) . 0.028– 0.044 y ear − 1(ba se d on a ge a t fir st pr e gn a n c y) or 0.037– 0.055 y ear − 1(ba se d on a ge a t m a tu ri ty ) ( R a m ba h in ia ri son e t a l., 2018 ; P h ili ppi n e s) . U n k n ow n U n k n ow n U n k n ow n U n k n ow n U n k n ow n
FIGURE 2 | Age and growth in mobulid rays. (a) Stereo-video photogrammetry can be used to measure individuals in the field, providing insights into growth, size at maturity, and other life history characteristics. Photo © Guy Stevens, used with consent. (b) In fisheries scenarios, vertebral centra have been successfully used to age mobulids, although validation of band-pair deposition rates are needed. Photo © Betty Laglbauer. (See section 2).
stereo-video photogrammetry (Shortis et al., 2009) (Figure 2). These mark-recapture data with associated size estimates can be used to fit growth curves (e.g.,Perry et al., 2018), estimate size at maturity, and study factors influencing growth rates across life stages, regions and populations. Therefore, further efforts should aim to obtain accurate size estimates over longer time frames to estimate growth rates. It will also be important to obtain accurate estimates of size-at-birth from neonates or late-term embryos across populations since these are necessary to fit two-parametric growth models, which are preferable to three-parametric models that sometimes provide unrealistic estimates of size at birth in elasmobranchs (Smart et al., 2016).
2.2. Mortality
Mortality is an essential parameter to understand population dynamics, and it is important for demographic models and stock assessments to separate natural mortality from fishing mortality. There are a number of methods researchers can use to estimate mortality in mobulid rays depending on both data availability and type. In data-rich wild populations, mark-recapture (via photo identification) and acoustic telemetry can be used to estimate survival and natural mortality of specific life stages (e.g., Heupel and Simpfendorfer, 2002). In fisheries scenarios, catch curve analysis of landed specimens allows for direct estimates of total mortality (natural plus fishing mortality) (e.g., Simpfendorfer, 1999; Pardo et al., 2016a). Many indirect methods exist to estimate mortality based on other life history parameters (Pauly, 1980; Kenchington, 2014). The most relevant approaches to mobulid research likely include estimation of natural mortality from maximum age (e.g., Hoenig, 1983) and average age (e.g.,Pardo et al., 2016a), or from the von Bertalanffy growth coefficient K (e.g.,Beverton and Holt, 1959; Charnov, 1993; Jensen, 1996).
2.3. Population Viability
The life history information highlighted in this section is important for developing management strategies that prioritize
life stages for conservation, and for testing the ability of proposed conservation approaches to enhance population viability. Matrix models are a common tool for population viability analysis, and can be particularly useful in data-poor scenarios that are common among mobulid rays (Heppell et al., 2000). As key life history data become available, future research on mobulids should use sensitivity, elasticity, and perturbation analyses to identify life stages with significant contributions to overall population viability in order to direct management actions (Heppell, 1998; Frisk et al., 2005). Additionally, researchers could assess the impact of specific management approaches by quantitatively evaluating the increase in the growth rate of a population given reduced mortality of specific life stages (e.g.,Gerber and Heppell, 2004; Smart et al., 2017). Further, in cases where time-series of abundance or relative abundance are not available (which is the case for many mobulid populations), these life history parameters can be used to calculate the maximum growth rate of a population (Pardo et al., 2016b). This can be compared with total mortality to determine population trajectories and extinction risk (Pardo et al., 2016a).
3. REPRODUCTION AND NURSERY AREAS
The reproductive biology of mobulid rays is known mostly from the reef manta ray (M. alfredi). Courtship and copulation in reef manta rays are common around cleaning stations and reef habitats (Marshall and Bennett, 2010; Deakos et al., 2011; Deakos, 2012; Stevens, 2016; Stevens et al., 2018b). Observations of courtship and mating remain rare in other mobulid species (Yano et al., 1999; Duffy and Scott, 2017; Stevens et al., 2018a). A gestation period of 1 year has been observed in both wild and captive M. alfredi, but remains unknown for other mobulids (Uchida et al., 2008; Marshall and Bennett, 2010; Couturier et al., 2012; Deakos, 2012; Stevens, 2016). All mobulids are thought to give birth to a single large pup, with rare observations of twins (Marshall et al., 2009; Couturier et al., 2012). Parturition is often followed immediately by copulation in captive and wild M. alfredi
(Uchida et al., 2008; Stevens, 2016); a reproductive strategy that is likely to be found in other mobulid species, as well (Stevens, 2016; Duffy and Scott, 2017). In wild populations of M. alfredi, interbirth intervals of 2–7 years have been reported, presumably dependent on environmental conditions and food availability (Marshall and Bennett, 2010; Deakos, 2012; Kashiwagi, 2014; Stevens, 2016). The fecundities of mobulids other than M. alfredi have not been determined, and previous risk assessments and demographic analyses have assumed that mobulids share similar key reproductive parameters (Dulvy et al., 2014; Pardo et al., 2016a). Size segregation appears to be common across mobulid species, with juveniles absent from most field studies or present at different times or locations than adults (Notarbartolo di Sciara, 1988; Deakos, 2010), with the exception of M. alfredi in Mozambique where young-of-year individuals were occasionally observed within the general population (Marshall and Bennett, 2010). In terms of movements, habitat use and general life history data, the juvenile life stage of all mobulid species remains poorly studied.
3.1. Age at Maturity & Fecundity
Maturity assessments of mobulids are based primarily on external morphological cues, such as changes in clasper morphology in males, and the presence of visual signs of mating or pregnancy in females (Deakos, 2010; Marshall and Bennett, 2010; Stevens, 2016) (Figure 3). However, physiological sexual maturity may not coincide with the external signs of sexual maturation. Physiological markers such as changes in steroid levels have been successfully adopted as indicators of reproductive status in elasmobranchs (Sulikowski et al., 2007; Prohaska et al., 2013). Ultrasonography has also been widely adopted to define gonadal maturity in a variety of fish species (Bryan et al., 2007; Novelo and Tiersch, 2012) including elasmobranchs (Carrier et al., 2003; Whittamore et al., 2010). Future research addressing mobulid reproduction and fecundity could consider applying these methods, particularly in species where individual identification to track reproductive status through time is not possible. If used on a sufficiently large scale, these approaches could help estimate the proportion of females within a population contributing to annual recruitment and, for data collected over extended periods of time, may provide information on the timing and seasonality of the reproductive cycle (Whittamore et al., 2010). In combination with photogrammetry, ultrasonography and endocrinology would enable more reliable estimates of age and size at maturity.
3.2. Mating, Pupping, and Nursery Areas
In several mobulid species, reproductive activity peaks seasonally and may occur more often at social aggregation sites such a seamounts or cleaning stations (Yano et al., 1999; Marshall and Bennett, 2010; Stevens, 2016; Stevens et al., 2018b). However, significant knowledge gaps remain in our understanding of mobulid courtship and mating behavior. Long-term monitoring of areas where opportunistic courtship activity has been documented previously may reveal more seasonal mating grounds for certain species, and targeted surveillance of social aggregation sites would be a natural starting place to undertake
these studies. Little is known about parturition in mobulid rays. To date, no natural wild birth for any mobulid species has been observed. Advanced technology may be required to determine if specific pupping grounds exist, or if females give birth in any area with suitable conditions. Researchers could use satellite and acoustic tags to evaluate the movements and habitat use of near-term females and reveal behavioral changes preceding pupping events. Additionally, animal-borne video camera systems (e.g.,Stewart et al., 2017b; Fontes et al., 2018) may also reveal changes in behavior preceding parturition and allow for more detailed examinations of environments being used.
In many locations, juvenile M. alfredi and M. birostris have been observed in coastal shoreline and lagoon habitats (McCauley et al., 2014; Stevens, 2016; M. Deakos, G. Stevens unpublished) and occasionally in offshore habitats (R. Rubin unpublished) segregated from adult populations. Additionally, juvenile M. thurstoni have been observed in coastal regions of the Gulf of California (Notarbartolo di Sciara, 1988), indicating that protected coastal habitats may be important to juvenile mobulids in general. To date two locations have been identified that meet established criteria for elasmobranch nursery habitats (Heupel et al., 2007; Martins et al., 2018) (M. birostris in the Gulf of Mexico,Stewart et al., 2016b; M. munkiana in the Sea of Cortez, Palacios et al. in prep; Figure 3), although other locations are currently undergoing similar assessments. Future work should target locations where juvenile mobulids are known to aggregate or are frequently present, and determine whether these sites meet the criteria for formal classification as a nursery habitat as defined by Heupel et al. (2007) and Martins et al. (2018). Given the apparent affinity for protected coastal and lagoon habitats in several species, aerial drone surveys could be an efficient and cost-effective method for identifying candidate sites. The identification of mating and pupping grounds may also aid in the identification of juvenile habitats and nursery grounds. For example, large annual aggregations of M. munkiana in the Gulf of California, Mexico are presumed to be mating aggregations. Juvenile and potential young-of-year individuals have been observed along the coast adjacent to these aggregations (Notarbartolo di Sciara, G. Stevens & J. Stewart, pers. obs; Palacios et al., in prep), suggesting that pupping and nursery grounds may exist in close proximity to mating grounds. If mating pupping, and nursery habitats are identified, these critical habitats should be protected to prevent changes in natural behavior, to ensure that pathways to these areas are not obstructed and to ensure the safety of individuals within these areas.
4. POPULATION TRENDS
With increasing concern for the general status of global mobulid populations, estimates of abundance, and breeding stock along with monitoring of long-term population trends are crucial measures required to develop effective management and conservation strategies. Current population information for manta rays is predominantly gathered through diver counts and
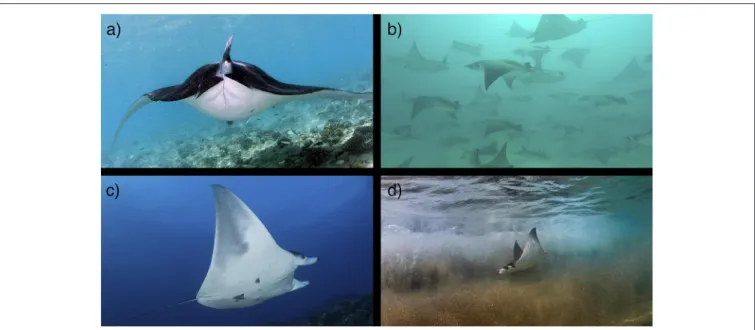
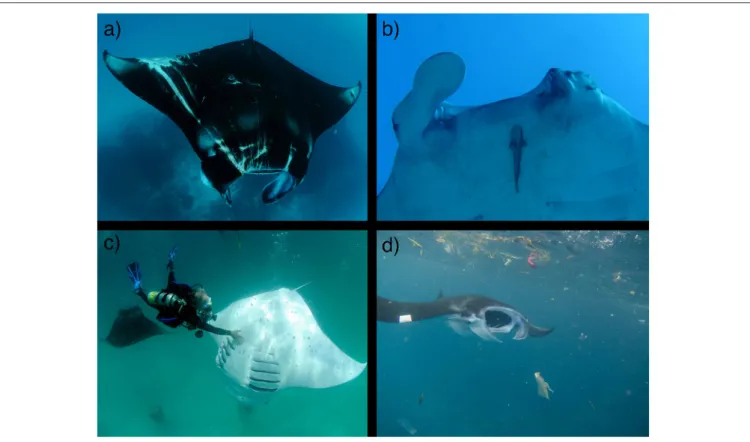
FIGURE 3 | Mobulid reproduction. Mating, pupping and nursery grounds are not well defined for mobulids. (a) A pregnant reef manta ray (M. alfredi) in the Maldives. Photo © Guy Stevens (b) A school of pregnant M. munkiana in the Galapagos Islands. Photo © Walter Pisco. (c) A juvenile male M. cf. birostris at the Flower Garden Banks in the Gulf of Mexico. Photo © NOAA/FGBNMS/G.P. Schmahl. (d) A juvenile M. munkiana in the Sea of Cortez. Photo © Octavio Aburto. (See section 3).
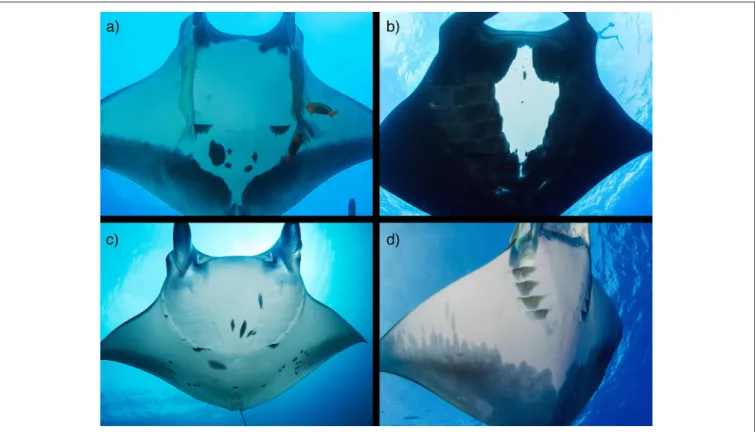
photo-identification (photo-ID) surveys of targeted populations at predictable aggregation sites. When photographs are collected in a rigorous sampling design, they can provide an index of sighting per unit effort over time and/or be incorporated into mark-recapture statistical models to generate estimates of abundance and parameters of population trends (Marshall et al., 2011; Marshall and Pierce, 2012; Couturier et al., 2014). However, photo-ID is limited to species with individually unique markings (e.g., M. birostris, M. alfredi, M. tarapacana; Figure 4) and is most effective in populations with coastal distributions that are accessible by divers. Therefore, there is a need to investigate additional methods to assess population trends, especially for devil rays.
4.1. Photo Identification
Of all mobulid species, M. alfredi is the most studied using photo-ID methods (Deakos et al., 2011; Marshall et al., 2011; Kitchen-Wheeler et al., 2012; Couturier et al., 2014; Kashiwagi, 2014) and therefore has the most robust estimates of population size. The large variation in body pigmentation patterns, presumed to be unique to each individual from birth, facilitates the cataloging of individuals and the creation of photo-ID databases (Kumli and Rubin, 2010; Kitchen-Wheeler et al., 2012; Marshall and Pierce, 2012). The popularity of in-water interactions with mobulids has also resulted in a high incidence of citizen science contributions to regional photo-ID databases from recreational divers (Kumli and Rubin, 2010; Couturier et al., 2011, 2014; Germanov and Marshall, 2014; Stevens, 2016). In addition to benefiting researchers by expanding data collection spatially and temporally without additional cost or resource use, citizen science promotes public awareness, and
engagement in conservation actions (Bonney et al., 2009). The opportunistic manner by which these sightings are reported, however, can impede the use of mark-recapture analyses that require precise sampling designs to control for effort and information on absence as well as presence of individuals (Cooch and White, 2006). Researchers should carefully consider the analytical methods they plan to employ and the key parameters they wish to recover, and plan their data collection accordingly rather than relying purely on opportunistic sightings. Furthermore, a key limiting factor to mark-recapture analysis is recapture rate: the probability of observing an individual animal on subsequent events. Patchy data often result in low recapture rates, and this may lead to non-estimable parameters or low precision around estimates, precluding the determination of trends. The use of auxiliary data within mark-recapture frameworks can help to overcome limitations with low recapture rates. For example, the incorporation of acoustic tagging data into mark-recapture analysis of tagged seven-gill sharks (Notorhynchus cepedianus) facilitated abundance estimation for this species (Dudgeon et al., 2015). Several mobulid research programs already include tagging studies (see Movements section) and future research programs could consider integrating these study designs to enable best use of data across multiple studies. Rigorous sampling designs can also increase the utility of citizen science data. For example, focusing citizen science efforts during particular time periods can increase data input into analysis frameworks, as well as investigating presence-only models to include opportunistic sightings (Mengersen et al., 2017). Ongoing surveys of well-studied populations should be continued to enable long-term trends to be assessed.
FIGURE 4 | Photo identification of mobulids. Oceanic manta rays (M. birostris; a,b) and reef manta rays (M. alfredi; c) have unique spot patterns that remain constant through time and can be used to identify individuals for mark-recapture studies. Both species have chevron (a,c) and black (b) morphs. (d) The posterior shading of the ventral surface of M. tarapacana may also allow for individual identification. Photo copyrights: (a,b) Joshua Stewart; (c) Guy Stevens; (d) Tom Burd www.tomburd. co.uk. (See section 4).
4.2. Relative Abundance, Data Poor
Methods, and Population Projections
For many mobulid species, assessing population trends through individual identification (photo-ID, tag, and release) is impossible due to extremely low recapture probabilities resulting from infrequent encounters, diver avoidance behaviors, or lack of distinct physical markings. Other approaches therefore need to be considered. In populations of mobulids that may exhibit high site affinity and recapture rates, researchers could evaluate the efficacy of external tags or implanted PIT tags (Chapman et al., 2009) in facilitating traditional mark-recapture methods for abundance estimation. Indirect or relative estimates of abundance can be generated through: a) count surveys (SPUE: sighting per unit effort) of live animals (e.g.,Rohner et al., 2013), b) observer data of capture rates (CPUE: catch per unit effort or BPUE: bycatch per unit effort), or c) landed animals at fish markets (CPUE). As life history parameters and population estimates become available for mobulids, researchers should use traditional stock assessment methods to evaluate the status and trends of populations (Methot and Wetzel, 2013). However, this will most likely only be possible in fisheries that have high observer coverage or bycatch reporting (e.g., Inter-American Tropical Tuna Commission (IATTC) purse seine fishery). In more common data-poor scenarios, researchers could take advantage of existing length- and age-based assessment methods
such as catch curve analysis (Pardo et al., 2016a) and the length based spawning potential ratio (Hordyk et al., 2015) to evaluate the status of mobulid populations. Where robust estimates of current population sizes are available (e.g., Couturier et al., 2014), researchers should use population projection models (Meyer-Gutbrod and Greene, 2018) and extinction risk analyses (Dulvy et al., 2004) to evaluate future population trends under varying management schemes, environmental conditions, and climate change scenarios.
4.3. Genetic Approaches to Estimating
Abundance
New developments in genomic approaches show promise for facilitating population size estimates for mobulids. DNA can be extracted from small amounts of tissue collected from live or dead animals as well as preserved components such as gill plates. High throughput sequencing enables thousands of genetic markers to be sequenced (most commonly focusing on single nucleotide polymorphisms—SNPs), which can then be used in multiple population genetic analyses. One approach is estimating genetic effective population size (Ne), which provides the number of breeding individuals to be used as a metric of population viability. Strong concordance has been demonstrated between ecological and genetic estimates of abundance for some elasmobranch species (Portnoy et al.,
2009; Dudgeon and Ovenden, 2015) with preliminary work for mobulids also demonstrating concordance for M. alfredi in Japan (Kashiwagi, 2014). Investigations are ongoing for M. alfredi from Australia (A. Armstrong unpublished) and Mozambique (S. Venables unpublished). The advantage of Ne is that only a single population sample is required to generate a point estimate. Theoretically, changes in Ne with temporal sampling can demonstrate population trends (e.g., Kuparinen et al., 2016). However, given that demography, ecology, and reproductive mode can all influence Ne estimates (Wang, 2005), future research is needed to investigate the sensitivity of Ne to these biological features in mobulids and provide guidelines on minimum sampling requirements. Another emerging molecular approach to estimating population size is close-kin mark-recapture (CKMR; Bravington et al., 2016a,b). Genomic data are used to identify kin pairs including parent-offspring, full siblings and half-siblings. Marking occurs during reproduction and the juvenile genomic signatures represent “recaptures” of the parents (Hillary et al., 2018). CKMR has been applied to natural populations of bluefin tuna (Bravington et al., 2016a) and white sharks (Hillary et al., 2018). As with Ne, CKMR only provides information about adults and requires sampling a substantial proportion of the population to identify kinship pairs and generate abundance estimates (Bravington et al.,
2016b). However, combining CKMR methods with auxiliary
data, such as acoustic telemetry data, can provide estimates of key demographic parameters needed to estimate total population size (Hillary et al., 2018). With few published examples for CKMR, sampling guidelines are not yet available, however several elasmobranch studies are underway (Ovenden et al., in review) and their outcomes will be informative for designing studies for mobulids.
5. BYCATCH AND FISHERIES
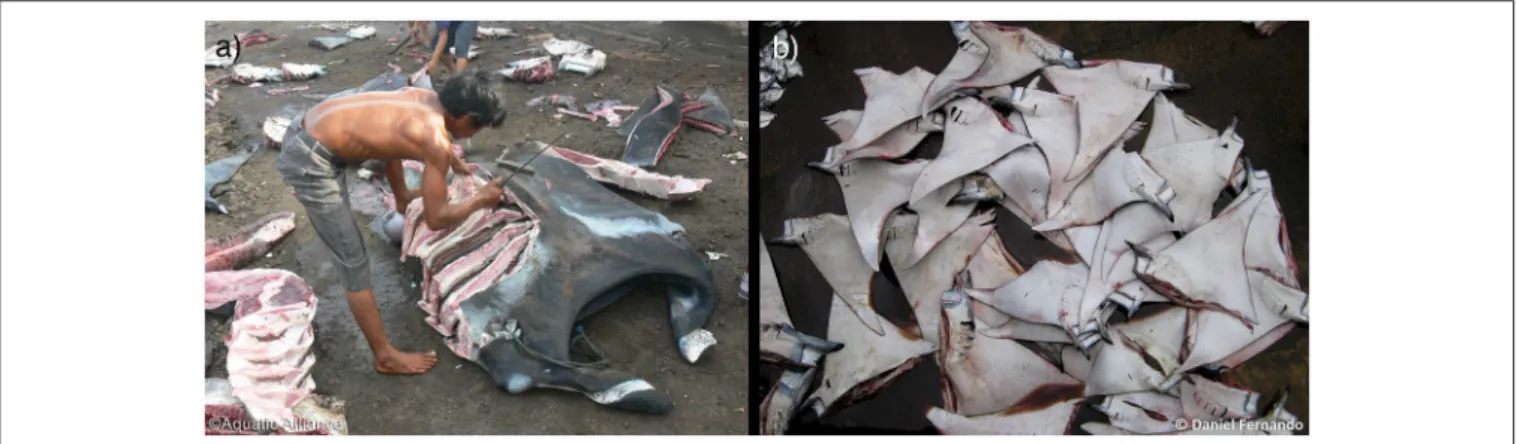
The greatest contributors to direct mortality of mobulid rays across their range are targeted and bycatch fisheries (Croll et al., 2016). At least 13 fisheries in 12 countries specifically target mobulids, and at least 30 fisheries in 23 countries capture mobulids as bycatch (Hall and Roman, 2013; Croll et al., 2016). They are targeted or retained for the Asian medicine trade as well as consumption of meat (Croll et al., 2016; O’Malley et al., 2016) (Figure 5), which has contributed to declines in mobulid landings in the Philippines, Indonesia, Mexico, India, and Mozambique (Couturier et al., 2012). The attraction of mobulids to productive tropical and subtropical habitats where target species such as tunas aggregate, along with their distribution in the epipelagic zone, make them vulnerable to fisheries capture (Croll et al., 2016). Mobulids are targeted or caught as bycatch in virtually every fishing gear type, including small-scale fisheries characterized by the use of driftnets, gillnets, harpoons, gaffs, traps, trawls, and longlines; and large-scale fisheries using driftnets, trawls and purse seines (Croll et al., 2016). The level of bycatch depends greatly on the fishing method used, with the highest bycatch rates reported from gillnets and purse seiners (Croll et al., 2016; Alfaro-Cordova et al.,
2017). The slow population growth rates of mobulid populations largely exclude them from considerations of sustainable targeted fisheries (Dulvy et al., 2014; Pardo et al., 2016a). Consequently, future research should focus on assessing bycatch risks and mitigation efforts as well as the impacts of existing fisheries on mobulid populations.
5.1. Post-release Mortality
While fisheries regulations have sought to prevent the retention and landing of mobulid rays, the vast majority of mobulid captures are a result of unintentional bycatch (Croll et al., 2016). Physical and biological traits of rays (i.e., lack of a rigid skeleton to protect internal organs, relatively high metabolic rates) make them particularly vulnerable to handling while they are out of water (Poisson et al., 2014). In the past, onboard handling practices have resulted in high levels of post-release mortality (Hall and Roman, 2013; Poisson et al., 2014). Efforts to create a comprehensive “best practices” bycatch mitigation plan for mobulids have defined suitable technical and behavioral recommendations aboard vessels (Poisson et al., 2014; Hutchinson et al., 2017). Recent resolutions prohibiting harmful handling practices like gaffing and punching holes in the bodies of rays were approved by the IATTC, and have begun to be applied in some purse seine and longline fisheries (IATTC Resolution C-15-04; IOTC Resolution 2017-S21-PropC (E)). Further work to identify and implement less harmful handling practices could prevent a significant amount of onboard mobulid mortality. Evaluating survival rates of mobulids released alive in non-target fisheries will help guide management decisions, as simply banning landings will not be an effective strategy in cases where a high proportion of individuals die after release. Initial studies of M. mobular released from tuna purse seine fisheries in New Zealand found mortality rates of 50–60% (Francis and Jones, 2016). Researchers should evaluate the post-release mortality of mobulids captured incidentally in a variety of gear types, as fishing gear such as gill nets with long soak times may have considerably higher post-release mortality rates than long lines or purse seines. Additionally, future studies should evaluate the impact of handling and release methods and relevant environmental and operational covariates on mobulid post-release mortality in order to develop release guidelines that maximize survival. Post-release mortality can be evaluated using pop-off satellite tags (Francis and Jones, 2016) or blood chemistry analyses (Hutchinson et al., 2015) in offshore fisheries. In coastal fisheries where released mobulids are more likely to remain in range of acoustic receivers, researchers could also consider the use of acoustic tags to evaluate survivorship rates (Skomal, 2007). Accelerometer tags may also be useful in the quantification of post-release behavior and mortality and the impacts of handling methods in cases where instrument recovery is feasible (Whitney et al., 2016). As relationships between directly observable covariates (e.g., time on deck, behavior after release) and survivorship are identified, observer programs in commercial fisheries should strive to collect fishery-wide data on these covariates, which will allow managers to estimate the total impact of a given fishery on mobulid populations.
FIGURE 5 | Mobulid fisheries. Mobulid rays are captured incidentally in virtually all fishing gear types, and are also targeted for their meat and gill plates in some countries. (a) A fisherman removes the gill plates of an oceanic manta ray (M. birostris) in Tanjung Luar, Indonesia. Photo © Peter Bassett, Aquatic Alliance, used with consent. (b) A pile of M. mobular and M. tarapacana at a fish market in Sri Lanka. Photo © Daniel Fernando. (See section 5).
5.2. Species Distributions and Fishery Data
Standardization
Identifying areas of overlap between mobulid hotspots and fisheries could help reduce mobulid bycatch rates. Concurrent satellite tracking of focal species and vessel monitoring systems can provide insights into bycatch risk and identify key locations for mitigation and management action (Queiroz et al., 2016). Onboard fisheries observers provide far more data-rich scenarios in which to assess bycatch risk, especially in commercial fisheries with high observer coverage such as the IATTC tuna purse seine fleet (Hall and Roman, 2013; Croll et al., 2016). These observer records allow for detailed species distribution models that can reveal relationships between species abundance and key environmental variables, both for bycatch and target species (Scales et al., 2017; Hazen et al., 2018). Future studies should identify the regions with both the highest overall mobulid bycatch rates, and the highest mobulid bycatch to target catch ratios. This information will allow managers to develop spatio-temporal (and ideally dynamic) management approaches with the greatest ecological and conservation value for mobulids and the lowest economic loss from reduced catches of target species. However, to take full advantage of fisheries observer data to develop species-specific habitat and distribution models, data collection protocols need to be standardized and species identification training for observers emphasized. Researchers could work with regional fisheries management organizations (RFMOs) to develop a comprehensive, standardized data collection manual for mobulids that ensures all relevant variables, including release methods, are collected and can be compared among regions and fisheries. Additionally, RFMOs should be encouraged to implement detailed mobulid identification training courses, and researchers could follow up with molecular identification of captured specimens to determine identification error rates. Unfortunately, these approaches will not cover mobulid mortality onboard smaller tuna purse seine vessels that don’t carry observers, or for fisheries targeting species outside the purview of the current RFMOs (e.g., clupeoid seine fisheries), and this mortality is not accounted for in
current bycatch estimates. Many of these vessels operate in nearshore productive waters where mobulids aggregate, and are likely to represent substantial unreported mobulid bycatch. Further research is necessary to describe the nature and quantity of this bycatch (e.g., Alfaro-Cordova et al., 2017).
5.3. Bycatch Prevention and Mitigation
Bycatch mitigation methods have not been adequately explored for mobulids, and proposals for preventing interactions between fishing gear and mobulids through technological innovations or gear modifications are needed. Strong associations with the thermocline in M. birostris (Stewart et al., 2016b) suggest that setting fishing gear above the thermocline depth could reduce bycatch rates of this species, and incorporating water column dynamics into species distribution models could help identify important bycatch hotspots (Brodie et al., 2018a). However, the feasibility of limiting gear depth in commercial fisheries is questionable, and therefore alternate proposals should be developed and tested for mobulids more generally. Bycatch mitigation has been developed for many non-target marine species such as seabirds in long-line fisheries (e.g., streamers, bird-scaring lines, weighted lines) (Melvin et al., 2014), and turtles in shrimp trawl fisheries (e.g., turtle excluder devices) (Crowder et al., 1995). For elasmobranchs more generally, there have been various trials, such as the (apparently unsuccessful) use of rare-earth metals to deter sharks from baited hooks (Jordan et al., 2011; Godin et al., 2013), and use of “deterrent” colors and patterns (Jordan et al., 2013). Some studies suggest that the use of light-emitting diodes in or near the ultraviolet range may reduce bycatch of elasmobranchs in gill net fisheries (Jordan et al., 2013), and trials employing similar approaches are currently underway with mobulid rays in Indonesia (Rosady, pers. comm.).
5.4. Fisheries Impacts on Genetic Diversity
Although in-depth research into population genetic structure is lacking for mobulids, the limited studies of genetic connectivity
indicate that populations are spatially structured (Stewart et al.,
2016a). Consequently, fisheries management of mobulid rays
may be more effective and relevant at the stock level, rather than simply along political or geographic boundaries (Reiss et al., 2009). More genetic studies are needed to identify genetically distinct populations of mobulid rays to support regional management strategies. As traditional gene sequencing methods may not reveal population structure in mobulids (Kashiwagi et al., 2012), we recommend high-throughput genomic methods (Peterson et al., 2012; Catchen et al., 2013) applied to samples of representative coverage within and among populations to generate robust estimates of population structure. Given that many of the smaller mobulid species are challenging to find and sample in typical field expeditions, fisheries may provide the best opportunities to obtaining such sample representation. For example, tissue, or tail samples collected by observers in tuna fisheries could provide the extensive geographic coverage and the large sample sizes necessary for investigating genetic connectivity. Additionally, there is strong evidence for a positive correlation between genetic diversity and a population’s resilience to extinction (Frankham, 2005; von der Heyden, 2017) and overexploited fish species have been shown to have lower genetic diversity than closely related species that are not overharvested (Pinsky and Palumbi, 2014). We therefore encourage researchers to evaluate genetic diversity across a gradient of fishing pressure to establish if and where fishing has led to a loss of diversity and population bottlenecks (e.g., Hauser et al., 2002). This will help prioritize vulnerable populations for conservation and management action. Studies of general patterns of effective population sizes and descriptions of the demographic histories of mobulids can establish valuable baseline reference points.
6. SPATIAL DYNAMICS AND MOVEMENTS
Understanding the spatial dynamics and habitat use patterns of animal populations is key to successful conservation and management (Cooke, 2008; Ogburn et al., 2017). This theme has been a dominant focus of mobulid ray research over the past decade, with 17 published studies documenting movements of individuals using a combination of photographic mark-recapture methods and electronic tracking. Using acoustic and satellite telemetry, movements of 1,008 individual rays of 6 species have been investigated in 10 distinct regions throughout their range (Figure 6). However, the majority of this effort has been focused on manta rays (n = 863), with devil rays representing only 14.4% of tracked animals (n = 145). Together, these studies highlight the large movement capacity of manta and devil rays and their use of broad geographic ranges including coastal and pelagic waters (Croll et al., 2012; Jaine et al., 2014; Thorrold et al., 2014; Francis and Jones, 2016). High rates of site residency and fidelity have been demonstrated, particularly in manta rays (Jaine et al., 2014; Stewart et al., 2016a; Couturier et al., 2018), with examples of seasonal migration between known aggregation sites up to 750 km apart (Couturier et al., 2011; Germanov and Marshall, 2014). The drivers underlying these large seasonal aggregations, common to both manta and devil rays, remain
elusive. Identifying common physical and biological processes that underlie movements and aggregative behavior across species will allow for improved identification and characterization of critical habitats. Studies of fine-scale habitat use at aggregation sites have revealed that individuals visit these areas to attend shallow cleaning stations, engage in courtship behavior, and forage on ephemeral food resources (Dewar et al., 2008; Jaine et al., 2012; Weeks et al., 2015; Armstrong et al., 2016; Burgess, 2017; Couturier et al., 2018).
6.1. Satellite Tagging
Technological advances in satellite tagging (Musyl et al., 2011; Hussey et al., 2015) are providing tools to explore topics of direct relevance to mobulid rays such as fine-scale habitat use (e.g., Fastloc technology, Wildlife Computers) and fishing mortality (e.g., mark-report or survivorship tags, Wildlife Computers). Most studies of mobulid movements have employed pop-up satellite archival transmitting (PSAT) tags (Table S1), which typically yield long retention times but coarse position estimates (i.e., one or two positions per day estimated from light levels and SST measurements) (Braun et al., 2015). Using these, mobulid rays have been successfully tracked for periods of up to a year, revealing regional philopatric movements and strong affinity to shelf edge habitats in manta rays (Braun et al., 2014; Jaine et al., 2014; Stewart et al., 2016a) as well as long-distance offshore movements in devil rays (i.e., > 1,500 km,Thorrold et al., 2014; Francis and Jones, 2016). In contrast, towed Argos-linked tags require long tethers to facilitate surface satellite communications, leading to shorter deployments (poor tag retention) but higher resolution position estimates whenever the tag surfaces. These have been successfully used to investigate short-term (i.e., up to 64 days) foraging movements of manta rays in the Gulf of Mexico (Graham et al., 2012). More recently, towed tags enabled with fast-acquisition GPS technology (e.g., Fastloc, Wildlife Computers) have produced valuable data on the fine-scale movements of manta rays by providing both light-based geolocation estimates as well as accurate GPS positions upon surfacing, for periods of up to 6 months (M. Erdmann pers. com.). Fastloc positions require less surface time, allowing for shorter tethers and longer retention times than Argos-linked tags, but do not transmit archived high-resolution GPS positions until the tag detaches from the animal. Recent improvements to geolocation and subsequent state space models are quantifying and reducing the levels of uncertainty associated with light-based geolocation (Patterson et al., 2008; Jonsen et al., 2013; Gredzens et al., 2014; Braun et al., 2018). It is likely that with the increasing capacity to make fine-scale observations, movement patterns will indicate significant overlap with anthropogenic threats or sensitive areas (Braun et al., 2015; Kessel et al., 2017; Pikesley et al., 2018). Researchers could therefore incorporate metrics such as the Human Impact Index (Halpern et al., 2008) in future mapping of core mobulid utilization areas to identify time periods and locations where mobulid populations are likely to be impacted by human activities. Fine-scale habitat use assessments will be facilitated by increased use of Argos-linked and Fastloc tags, and researchers could make efforts to improve retention times for these tag types, perhaps by implementing new
FIGURE 6 | Mobulid telemetry effort to date. (a) Cumulative number of acoustic and satellite tags deployed on all mobulid rays from published literature by year. (b) Comparison of tagging effort to date for manta and devil rays. (c) Total tags deployed by species. Note that we specify tagging effort by IUCN species classifications, but use the same color for M. japanica and M. mobular, which have been lumped into M. mobular but have different IUCN Red List classifications. (d) Distribution of acoustic tag deployments on mobulid rays by species. (e) Distribution of satellite tag deployments on mobulid rays by species. The mobulid tagging effort information was sourced from published literature on the topic as well as from other unpublished mobulid tracking studies known to the authors and their collaborators (summarized in Table S1). (See section 6).
attachment methods such as dorsal fin mounts (e.g.,Kessel et al., 2017). In addition to contributing important spatial information about the conservation needs of these species, such information will enhance our understanding of the global connectivity of mobulid populations with respect to gene flow and potential isolation.
6.2. Acoustic Tagging
Compared with satellite tags, the affordability and longer battery life of acoustic tags enables the collection of larger datasets on mobulid movements, site fidelity and habitat use than studies employing satellite tags. The increased battery life of acoustic transmitters (up to 10 years) will also greatly benefit efforts to monitor site fidelity and residency in mobulid species that are rarely encountered and are often only tagged opportunistically (e.g., M. mobular). However, the long-term attachment of external tags on mobulid rays over months to years remains a challenge. Future studies should consider internal tagging where possible (e.g. Kessel et al., 2017; Croll unpublished). Additionally, acoustic tags only provide positions when they are in range of acoustic receiver stations, limiting their utility for wide-ranging mobulids that routinely travel outside of receiver arrays. Researchers could make use of collaborative regional acoustic sensor networks to expand monitoring capacity (e.g., Australia’s Integrated Marine Observing System—Animal Tracking Facility network, The Atlantic Cooperative Telemetry Network, The Ocean Tracking
Network, iTAG network in the Gulf of Mexico). Large scale collaborative efforts will inform the design of management strategies on national (or smaller) scales (Lea et al., 2016) and facilitate the protection of key aggregation sites, especially for the philopatric manta species (Graham et al., 2012; Jaine et al., 2014; Braun et al., 2015; Stewart et al., 2016a; Kessel et al., 2017).
6.3. Critical Habitats
The ability of researchers to identify and predict areas of critical habitat for mobulid rays will be improved with increasing amounts of movement data collected through telemetry studies (Hays et al., 2016; Sequeira et al., 2018). Density maps (e.g., kernel utilization density, minimum convex polygon) can be constructed from horizontal movement data to reflect the core area use of mobulid species (Croll et al., 2012; Kessel et al., 2017). Historical observations of mobulid presence and aggregation events may provide novel and temporal insight into species distributions. Researchers should consider Unmanned Aerial Vehicle (UAV) technology or aerial surveys to provide additional opportunities to collect quantitative and behavioral data of mobulids (Hodgson et al., 2013; Girondot et al., 2014; Notarbartolo di Sciara et al., 2015; Weeks et al., 2015; Schofield et al., 2017; Pikesley et al., 2018). It is highly likely that oceanographic features and their influence on the distribution of patchy prey resources play a key role in driving the behavior of planktivores (Sims et al., 2006; Rohner et al., 2014; Weeks