Ancestral grass karyotype reconstruction unravels
new mechanisms of genome shuffling as a source
of plant evolution
Florent Murat,
1,4Jian-Hong Xu,
2,4Eric Tannier,
3,4Michael Abrouk,
1Nicolas Guilhot,
1Caroline Pont,
1Joachim Messing,
2,5and Je´ro
ˆme Salse
1,51
INRA, UMR 1095, Laboratoire Ge´ne´tique, Diversite´ et Ecophysiologie des Ce´re´ales, 63100 Clermont Ferrand, France;
2The Plant
Genome Initiative at Rutgers (PGIR), Waksman Institute of Microbiology, Rutgers, The State University of New Jersey, Piscataway, New
Jersey 08854, USA;
3INRIA Rhoˆne-Alpes, Universite´ de Lyon 1, CNRS UMR5558, Laboratoire Biome´trie et Biologie E´volutive, 69622
Villeurbanne Cedex, France
The comparison of the chromosome numbers of today’s species with common reconstructed paleo-ancestors has led to
intense speculation of how chromosomes have been rearranged over time in mammals. However, similar studies in plants
with respect to genome evolution as well as molecular mechanisms leading to mosaic synteny blocks have been lacking due
to relevant examples of evolutionary zooms from genomic sequences. Such studies require genomes of species that belong
to the same family but are diverged to fall into different subfamilies. Our most important crops belong to the family of the
grasses, where a number of genomes have now been sequenced. Based on detailed paleogenomics, using inference from n =
5–12 grass ancestral karyotypes (AGKs) in terms of gene content and order, we delineated sequence intervals comprising
a complete set of junction break points of orthologous regions from rice, maize, sorghum, and Brachypodium genomes,
representing three different subfamilies and different polyploidization events. By focusing on these sequence intervals, we
could show that the chromosome number variation/reduction from the n = 12 common paleo-ancestor was driven by
nonrandom centric double-strand break repair events. It appeared that the centromeric/telomeric illegitimate
re-combination between nonhomologous chromosomes led to nested chromosome fusions (NCFs) and synteny break points
(SBPs). When intervals comprising NCFs were compared in their structure, we concluded that SBPs (1) were meiotic
re-combination hotspots, (2) corresponded to high sequence turnover loci through repeat invasion, and (3) might be
con-sidered as hotspots of evolutionary novelty that could act as a reservoir for producing adaptive phenotypes.
[Supplemental material is available online at http://www.genome.org.]
The Poaceae (grasses) comprise more than 10,000 species, and their basic chromosome number can widely range from two to 18 (deWet 1987; Hunziker and Stebbins 1987) both within and among sub-families (Gaut 2002). Chromosome number can double with poly-ploidization, which is common in flowering plants and also re-ferred to as whole-genome duplication (WGD). Recent comparison of map-based genomic sequences of grasses revealed shared intra-genomic duplications, providing new insights into the evolu-tion of extant genomes from an ancestral grass karyotype (AGK). Complete grass genome sequences, including three subfamilies of the grasses (Poaceae)—i.e., the Panicoideae (sorghum [Paterson et al. 2009]; maize, [Schnable et al. 2009]), Ehrhartoideae (rice [In-ternational Rice Genome Sequencing Project 2005]), and Pooideae (Brachypodium [International Brachypodium Initiative 2010])—that have diverged from a common ancestor 50–70 million yr ago (Mya) (Kellogg 2001), are available to perform paleogenomics studies, i.e., study of the ancestral genome structure of today’s species.
Previous comparative analysis (i.e., establishment of orthol-ogous and paralorthol-ogous gene pair repertory) of two (rice, sorghum) whole-genome sequences and three high-density EST-based
ge-netic maps (wheat, barley, maize) has permitted us to use synteny blocks to model an AGK based on gene order and content. We defined two new parameters for BLAST analyses (either nucleic or protein-based) that take into account not only similarity but also the relative lengths of the sequences: cumulative identity percent-age (CIP) and cumulative alignment length percentpercent-age (CALP). We also systematically performed a statistical test after BLAST com-parison with the CIP/CALP parameters to validate nonrandom associations between groups of sequences (Salse et al. 2009a,b). To further refine the junctions of synteny blocks from fully sequenced genomes to large mapped EST collections, we previously added two other new criteria: the density (DR) and the cluster (CR) ratios that are functions of the physical and/or genetic size, the total number of genes and/or loci, and the number of orthologous sequence pairs defined in the orthologous regions identified with the pvious CIP/CALP parameters. Statistically significant collinear re-lationships between the two genomes are associated with the lowest DR and highest CR values, while the remaining collinear regions are considered as artificial, i.e., obtained at random (Salse et al. 2009b). Based on this approach, we recently proposed an AGK with a minimal size of 33.6 Mb structured in five proto-chromosomes containing at least 9138 predicted protogenes (Salse et al. 2009a). We proposed that two major evolutionary shuffling events, i.e., WGD followed by diploidization, explain the di-vergence of cereal genomes during their evolution from a common AGK (Bolot et al. 2009).
4These authors contributed equally to this work. 5Corresponding authors.
E-mail jsalse@clermont.inra.fr; fax (33) 473624453. E-mail messing@waksman.rutgers.edu; fax (732) 445-1404. Article published online before print. Article and publication date are at http://www.genome.org/cgi/doi/10.1101/gr.109744.110.
Interestingly, both in animals and plants, similar evolution-ary paths have been described with respect to the reduced numbers of protochromosomes and several rounds of WGDs, followed by lineage-specific rearrangements leading to different chromosome numbers in today’s species (Salse et al. 2009a). However, the se-quence-based identification of junctions, where chromosomal rearrangements took place in grasses since their divergence from their common ancestor, was a prerequisite for discovering the molecular mechanisms that might drive these chromosome-shuf-fling events. The recent availability of large amounts of whole-genome sequences from diverse taxa yielded large-scale, whole- genome-wide comparisons in mammals and provided clear identification of synteny breakpoints or junction sequences, which gave rise to a new evolutionary perspective. Synteny break points (SBPs) in mammals have then been suggested to (1) occur nonrandomly, (2) involve gene-rich intervals, (3) contain a high occurrence of seg-mental duplications and/or repetitive elements, (4) be involved in nonallelic homologous recombination, (5) be reusable fragile loci for chromosome rearrangement, and (6) involve adaptation traits such as disease-related ones (Trinh et al. 2004; Everts-van et al. 2004; Murphy et al. 2005; Schibler et al. 2006; Bulazel et al. 2007; Larkin et al. 2009; Lemaitre et al. 2009). However, regions of major interest, as they represent evolutionary break points caused by fusions, inversions, translocations, and other processes, were not yet investigated in detail in plants.
Where, when, and how these breakpoints can and do occur are fundamental questions regarding the evolution of today’s species from their founding ancestor. Here, we undertook a new scale of plant genome comparisons because of the sets of closely related genomes that have been fully sequenced since early 2010 (rice, sorghum, maize, Brachypodium). We conducted a recon-struction of the AGK, in terms of ancestral gene order, as well as several intermediary ancestral genomes, delineating today’s spe-cies from extinct AGKs. The reconstruction of AGKs then permit-ted us to discover sequence intervals of several 100 kb comprising junction sequences with chromosome break and fusion points. Analysis of these intervals permitted us to propose the molecular mechanisms that have shaped today’s rice, maize, Brachypodium, and sorghum chromosomes.
Results
AGK reconstruction
Grass genomic synteny, exemplified by rice, sorghum, maize, and Brachypodium, representing three separate subfamilies of species and 8.53-fold genomic expansions, was analyzed using alignment parameters and statistical tests (see Methods) to identify ortholo-gous relationships and delimit intergenome collinearity as well as ancestral shared duplications. Overall, we identified 13,098 orthologous pairs covering an average of 73% of the extant ge-nomes and involving the following conserved synteny chromo-some-to-chromosome relationships with r for rice, s for sorghum, m for maize, and b for Brachypodium (Fig. 1, bottom): r1/s3/m3-m8/ b2 (pink), r2/s4/m4-m5/b3 (light green), r3/s1/m1-m5-m9/b1 (red), r4/s6/m2-m10/b5 (dark green), r5/s9/m6-m8/b2 (violet), r6/ s10/m5-m6-m9/b1 (green), r7/s2/m2-m7/b1 (orange), r8/s7/m1-m4-m6-m10/b3 (yellow), r9/s2/m2-m7/b4 (light yellow), r10/s1/ m1-m5-m9/b3 (brown), r11/s5/m2-m4/b4 (blue), and r12/s8/m1-m3-m10/b4 (light blue). Our approach also allowed us to refine and extend the identification of interchromosomal duplications, consisting of 2731 paralogous gene pairs and covering on average
65% of the extant genomes, which include 10, eight, 17, and six major duplications in the rice, sorghum, maize, and Brachypodium genomes, respectively (Salse et al. 2008, 2009a; International Bra-chypodium Initiative 2010). These gene pairs also represent an-cient orthologs in contrast to the generation of intrachromosomal linked (tandem) and unlinked (transposed) paralogous gene cop-ies, reflecting different mechanisms of gene amplification. Here, integration of intraspecies duplications and interspecies synteny analyses in the grasses genomes yielded seven shared ancestral duplications, highlighted with gray boxes as shown (Fig. 1, bot-tom) and involving the following chromosome pair combi-nations: r11-r12/s5-s8/m2-m4-m1-m3-m10/b4-b4, r5-r1/s9-s3/ m6-m8-m3/b2-b2, r10-r3/s1/m1-m5-m9/b1-b3, r7-r3/s2-s1/m2-m7-m1-m9-m5/b1-b1, r4-r2/s6-s4/m2-m10-m4-m5/b3-b5, r9-r8/ s2-s7/m2-m7-m1-m4-m10-m6/b3-b4, and r2-r6/s4-s10/m4-m5-m6-m9/b1-b3. Identification of seven ancestral duplications cov-ering more than 50% of each genome of these diverged species demonstrated that they originated from a shared WGD event, about 60 Mya, and were all diploidized ancient polyploids. In addition, maize underwent an additional WGD through hybridization of two closely related species about 5 Mya (Swigonova et al. 2004).
One of the grass subfamilies investigated here is the Pooideae, which includes important crops like wheat, barley, and oats. Be-cause most of these genomes contain large amounts of repeti-tive DNA, Brachypodium, with a very small genome, has been se-quenced as a representative of this subfamily. To reconstruct the ancestral genome of the Pooideae, we compared the 8533 orthologs between rice and Brachypodium with those from sorghum as an outgroup, resulting in a set of 245 ancestral blocks, where 7668 (89%) genes have been reordered (1268 on A1, 559 on A5, 565 on A7, 294 on A10, 1374 on A3, 201 on A11, 290 on A12, 452 on A8, 434 on A9, 736 on A4, 578 on A6, and 917 on A2). These blocks could then be rearranged into 12 contiguous ancestral regions (CARs) thanks to the physical mapping techniques described by Chauve and Tannier (2008), corresponding to the extinct 12 Pooideae ancestral protochromosomes, which suggest that a large majority (89%) of the ancestral gene order within the Pooideae had been maintained due to a few species-specific shuffling events of the progenitors of the rice and Brachypodium genomes (cf. Fig. 1, ‘‘Ancestor Pooideae’’ box).
The reconstruction of the ancestral genome of the Panicoideae is complicated with maize as a reference because of its recent WGD and the subsequent dramatic gene loss in one of the two duplicated regions during diploidization (Messing et al. 2004). We constructed a set of 137 ancestral blocks including 2433 (59%) reordered protogenes by double synteny block identifications (see Methods) using the 4082 orthologs identified between maize and sorghum (461 on A1, 159 on A5, 469 on A3/10, 110 on A12, 22 on A11, 80 on A8, 371 on A7/9, 303 on A4, 171 on A6, and 287 on A2). These blocks were assembled into 10 CARs with the same physical mapping technique as before, corresponding to the ex-tinct 10 Panicoideae ancestral protochromosomes, confirming that a large majority (41%) of the ancestral gene order has been lost in the allotetraploid genome of maize, which is in close agreement with previous estimates of mapped BAC end sequences (cf. Fig. 1, ‘‘Ancestor Panicoideae’’ box; Messing et al. 2004).
By now comparing the progenitor genomes of the Pooideae (7668 reordered genes in 245 blocks) and Panicoideae (2433 reor-dered genes in 137 blocks) with the seven ancestral shared dupli-cations reported previously, we were able to model with the same strategy the n = 12 ancestral intermediate with 6045 reordered genes in 125 blocks (998 on A1, 819 on A2, 1044 on A3, 582
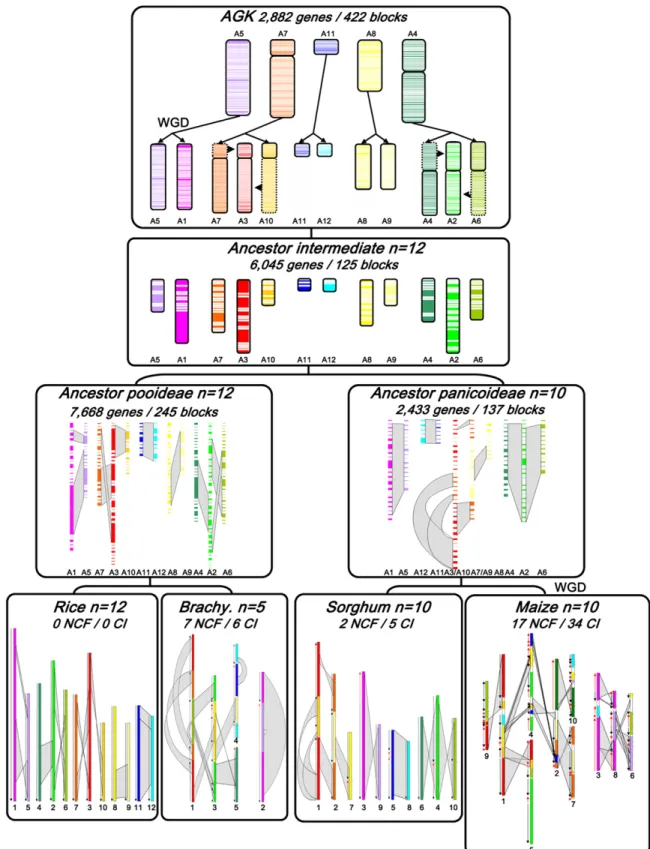
Figure 1. Ancestral grass karyotype reconstruction. The monocot (rice, Brachypodium, sorghum, maize) chromosomes are represented with color codes to illustrate the evolution of segments from a common ancestor with five protochromosomes (named according to the rice nomenclature A5, A4, A7, A8, A11). The current structure of the four genomes is represented at the bottom of the figure, with the seven ancestral duplications highlighted with gray boxes. Large segmental inversions are indicated with red arrows in Brachypodium, sorghum, and maize genomes according to the synteny, with rice used as reference genome. The ancestor intermediate (n = 12 for Pooideae, A1 to A12; and n = 10 for Panicoideae, A1 to A10) is illustrated by blocks of reordered genes, with the chromosome and duplication five-color code described above. The AGK (top), structured in seven blocks of five protochromosomes, went through a WGD and two chromosome fusions and fissions (A3 = A7 + A10; A2 = A4 + A6) to reach the n = 12 ancestor intermediate. Polyploidization events are indicated as WGD in the figure. The number of reordered genes, gene blocks, NCF, and CI events are indicated on the depicted modern and ancestral genomes.
on A4, 443 on A5, 451 on A6, 443 on A7, 358 on A8, 333 on A9, 257 on A10, 141 on A11, and 176 on A12) (cf. Fig. 1, ‘‘Ancestor intermediate’’ box). From this intermediate, we then reconstructed the gene order in the AGK, using the 8120 orthologous or paral-ogous (ancient ortholparal-ogous) relationships of rice and sorghum genes. Using a slight modification of the physical mapping tech-niques, allowing for gene losses in duplicated regions, we grouped 2882 ancestral genes into 422 CARs, seven of them containing more than 80 genes. Reconstituting the AGK, 35% of the genes were successfully assigned to seven blocks and five protochro-mosomes (988 on A5, 410 on A7, 114 on A11, 532 on A8, 838 on A4), suggesting that a large proportion of the ancestral gene order has eroded over 60 Myr of evolution of a single family of plant species (cf. Fig. 1, ‘‘AGK’’ box). What became apparent from the examples of recent and more ancient chromosomal duplica-tions in maize and rice (Xu and Messing 2008b) can now be demonstrated to have occurred on a genome-wide basis in the representative genomes of three subfamilies of the grasses. Such a pattern of gene loss of duplicated chromosomal segments has also been described for the modern yeast genome (Kellis et al. 2004), indicating an ancient cycle of gene birth and death. To support the use of the comparative analyses in genetic map-ping, we developed a user-friendly online web tool called ‘‘Plant-Ancestor,’’ based on the public Narcisse platform (Courcelle et al. 2008), that allows us to visualize the 13,098 orthologs as well as the 2731 paralogs characterized in the four cereal genomes (http://www.clermont.inra.fr/umr1095/plant-ancestor). With this tool, it is possible to gain access to the raw data (gene name, se-quence, position, and alignment criteria) obtained from the anal-ysis of the synteny and duplication of the rice, maize, sorghum, and Brachypodium genomes as well as AGK gene order.
Paleo-shuffling event (nested chromosome fusion,
chromosomal inversion) repertory and origin
Robust statistical methods in the determination of SBP boundaries provided us with sequence footprints for the detection of the evolutionary paths from different lineages and the mechanisms that drove chromosome number variation from n = 5–12 (AGK and ancestor intermediate) to n = 12 (rice), 5 (Brachypodium), and 10 (maize and sorghum). In respect to these evolutionary paths of today’s grass chromosomes, we proposed a paleotetraploid AGK with five to seven protochromosomes (A5, A7, A11, A8, A4, pos-sibly A4 and A7 being in two pieces) comprising 13,098 protogene models, for which 2882 were ordered into seven ancestral blocks defining five protochromosomes (A5, A8, and A11 were in a single block, while A4 and A7 were split and contained two large blocks). After a WGD event ([5–7] 3 2 = 10–14 chromosomes) about 50–70 Mya, the ancestral genome underwent two distinct series of interchromosomal fissions and fusions that resulted in an n = 12 intermediate ancestor. A3 resulted in the fusion of segments from A7 and A10. In the same way, A2 resulted in the fusion of segments from A4 and A6. The progenitor of the Ehrhartoideae derived from this n = 12 ancestor intermediate (7668 protogene models reordered into 245 blocks and 12 CARs) of rice that retained the original chromosome number of 12, whereas the other grass genomes have evolved from this ancestral genome structure through independent nested chromosome fusions (NCFs) events. Brachypodium went through seven NCFs, highlighted with distinct colors on the same chromosomes, and six chromosomal inversions (CI), highlighted with red arrows (Fig. 1). The maize and sorghum genomes evolved from the 12 intermediate ancestral
chromosomes through two NCFs (between A3 and A10 and A7 and A9) (Fig. 1), giving the progenitor genome of the Panicoideae ancestor n = 10 (12 2) chromosomes. Maize and sorghum subsequently evolved independently from this ancestor. While the sorghum genome structure maintained the n = 10 chromo-some ancestral genome except for five CIs as indicated with red arrows (Fig. 1), maize underwent another WGD event, resulting in an intermediate with n = 20 chromosomes. Rapidly following this event, 17 NCFs led to a genome structure with 10 chromo-somes (n = 10 = [5 3 2 + 2 2] 3 2 10) followed by 34 CIs (red arrows). Overall, 26 NCFs (seven for Brachypodium, two for sor-ghum, and 17 for maize) and 45 CIs (six for Brachypodium, five for sorghum, and 34 for maize) could be accounted for with our methods.
Comparison of these observations with the analyses of ge-nome evolution in the animal kingdom suggests that plants had to rely on more rapid and frequent changes in chromosomal archi-tecture (especially WGD followed by NCF and CI) in speciation than did mammalian species. However, interestingly, similar evo-lutionary mechanisms have been described in both animals and plants, with a reduced number of protochromosomes (Luo et al. 2009) and several rounds of WGD followed by lineage-specific rearrangements, leading to different chromosome numbers in ex-tant species. Although there are many similarities between the eukaryotic kingdoms with respect to the characteristics of such chromosomal rearrangements, there are also significant differ-ences. Polyploidization, a dominant force in the evolution of plants and fungi, seemed to have occurred far less frequently in vertebrates and was a rare event in most vertebrate lineages, in-dicating differences in the capacity to adapt to genome duplica-tions. Moreover, NCFs have not been described in animal ge-nomes, where chromosomes would have fused by a telomere-based ‘‘end-to-end’’ or ‘‘tip-to-tip’’ joining process.
To achieve a better understanding of the molecular mecha-nisms driving such invasive shuffling events, we produced heat maps, scoring particular features such as telomeric, centromeric, transposable element (TE) repeats, as well as copy number varia-tions (CNVs) and coding sequences (CDSs) for the Brachypodium and sorghum chromosomes that originated from the fusion of at least two protochromosomes (Fig. 2A). We identified a total of nine ancestral chromosomal breaks based on NCFs (#1 to #9); eight took place in the telomeric and/or centromeric (cf. first and second heat maps) regions and one was terminal (NCF#6). The nine NCF events resulted in 18 fusion points (cf. Supplemental Table 1). There is a clear correlation between the position of NCFs, especially for NCF#1-3-5, and the occurrence of centromeric repeats. Moreover, we found the highest number of SBPs in recent segmental dupli-cations and diploidized genomes, i.e., maize (17 NCFs and 34 CIs) (Fig. 1). The potential reusability of SBPs was identified at the intragenomic level in the same protochromosomes for b1, b3, and m1–m10 but was not identified at the intergenomic level as the pattern of NCFs was not shared by any of the four genomes (Fig. 1). On the other hand, it has been proposed that the mosaic structure of syntenic blocks in grass chromosomes might involve hot spots for sequence insertions (Song et al. 2002). This appeared certainly to be true for the distribution of TEs (Fig. 2A, third heat maps) and CDSs (Fig. 2A, fourth heat maps). SBPs correlated with hot spots of TEs, albeit the already reported biased high density of TEs in centromeric regions and CDS in subtelomeric regions. Still, SBPs did not seem to have any impact onto CNVs (Fig. 2A, fifth heat maps) as they were randomly distributed among the six analyzed chromosomes. However, detailed analysis of gene content within
the SBP junctions revealed 23 sorghum genes within a 602.5-kb interval and 24 Brachypodium genes within a 881.0-kb interval, giving rise to a gene density of 3.82 and 2.72 in sorghum and Bra-chypodium (genes/100 kb), respectively. For rice, regions containing 12 SBPs within intervals amounting to 693.4 kb and 29 genes produce a gene density of 4.18 (genes/100 kb). These gene densities were lower than gene densities observed at the whole genome level as previously shown for sorghum (3.74 genes/100 kb), Brachypodium (9.39 genes/100 kb), and rice (7.39 genes/100 kb). When genes within the SBPs intervals were analyzed for their potential function, three of six at chromo-some fusion point #1 (NCF#1), four of 10 at NCF#8, and three of six at NCF#3 were putative cytochrome P450 genes; four of six at NCF#2 were similar to the LTPL62 gene; and six of eight at NCF#4 were pu-tative wall-associated kinase genes. More-over, 45% of these genes were tandemly duplicated (cf. Supplemental Table 1), sug-gesting a bias for certain gene copies close to SBPs. They may be considered as pu-tative adappu-tative gene functions in plants. In mammals, loci at SBP seemed to be enriched with development-related genes such as the nervous system (Larkin et al. 2009).
Among the nine described NCFs (Fig. 2A; Supplemental Table 1), four corre-sponded to fusions of paleo-homolo-gous chromosomes (NCF#2 between A3-A7; NCF#3 between A1-A5; NCF#6 be-tween A11-A12; NCF#8 bebe-tween A3-A10). The other five (55%) NCF events involved nonhomologous chromosomes. Based on these sequence alignments, the NCF pro-cess most probably occurred through cen-tromeric and/or telomeric repeats and not any gene-based recombination so that chromosome fusion was a semirandom process in respect to evolution and the chromosomal regions involved. The ra-diants for Brachypodium and sorghum ge-nomes (Fig. 2A) represented the percent-age (from 0%–100%) of sequence coverpercent-age at the centromere, telomere, SBPs, internal NCFs (defined as chromosome regions inside the SBPs, i.e., from SBP to centro-mere), and external NCF regions (defined as chromosome regions outside the SBPs, i.e., from telomere to SBP) observed for centromeric (blue), telomeric (purple), TE (yellow) repeats, as well as CDS (light blue). The two genome-wide distributions clearly demonstrated that (1) centromeric repeats, despite an expected location at the centro-mere, were also found at SBPs and internal Figure 2. Synteny break points characterization. (A) The four Brachypodium (b1-2-3-4) and two
sorghum (s1-2) chromosomes harboring the nine NCFs (black dots linked with dotted lines) identified in these genomes are illustrated according to their ancestral chromosomal origin (i.e., the A1 to A12 color code provided as the AGK painting scale): NCF#1-2 = A6-7-3, NCF#3 = A1-5, NCF#4-5 = A10-8-2, NCF#6-7 = A11-9-12, NCF#8 = A3-10, and NCF#9 = A7-9. For the six chromosomes, a heat map is provided for the telomeric repeat (blue, 0; yellow, <40%; red, >40%), centromeric repeat (blue, 0; yellow, <40%; red, >40%), LTR TE (blue, <80%; yellow, >80%; red, ;100%), CDS (blue, <40; yellow, 40–50; red, >50), and CNV (blue, <3; yellow, 3–5; red, >5) distribution. The radars for Brachypodium and sorghum genomes represent the percentage (from 0 to 100%) for the centromeric, telomeric, SBPs, and internal and external NCF sequence regions (corresponding to the five radar peaks) harboring cen-tromeric (blue), telomeric (purple), and TE (yellow) repeats as well as CDS (light blue). (B) Detailed representation of the NCF#19. The microsynteny is illustrated for the sorghum chromosome 2 (83 genes, 657 kb) and the rice chromosomes 9 (25 genes, 110 kb) and 7 (81 genes, 903 kb). Conserved genes are indicated with the same color code and linked with black lines. The SBP is indicated with a dotted black box. The dot plot illustrates the alignment of the 51-kb SBP region against itself.
NCF regions; (2) telomeric repeats, despite their expected location at the telomere, were also present at the centromere, SBPs, and internal and external NCF regions; (3) TEs were preferentially lo-cated in the centromeric regions, internal NCF regions, and SBP regions; (4) genes were preferentially noted within the external NCFs (subtelomeric regions) or close to the SBPs (considered as subtelomeric regions of neo-inserted chromosomes).
As an example, microsynteny analysis of one SBP using in-tervals from s2 and r7-9 is shown (Fig. 2B; Supplemental Table 1). The 657-kb sorghum region of chromosome 2 was orthologous to rice chromosome 9 (110 kb) and 7 (903 kb). A region of 51.1 kb in length that included the actual fusion point could be aligned using collinear genes (colored pink and brown, respectively). The align-ment of the selected region on itself (through the classical dot plot representation) clearly demonstrated the presence of repeats, known as AT-rich (69%) filler DNA sequences. However, additional AT-rich regions can be identified throughout the genome that also might resemble telomere remnants (heat maps, Fig. 2A). Finally, we could also show that such NCF regions are prone to gene re-arrangement with a large segmental inversion, highlighted with a gray block (Fig. 2B).
Impact of diploidization on genome structure
Because meiosis provides a strong selection against the pairing of homologous chromosomes, chromosomes duplicated in poly-ploids diverge instantly to make them dissimilar. However, it ap-pears that the process of divergence, once initiated, keeps con-tinuing through many generations. This gradual transformation of a polyploid into a neo-diploid genome is referred to as dip-loidization. As all reconstructed and modern chromosomes are complex mosaics of ancestral synteny blocks, we can assume that diploidization also involves lineage-specific reductions of chro-mosome numbers accompanied by the extensive restructuring process in terms of gene content and distribution.
As an example, we present the statistics of the alignments of the ancestral chromosome A5 and today’s chromosomes of the Brachypodium, sorghum, and rice genomes derived from their conserved gene order in form of three graphs, representing the distribution of gene content (red curve) and the percentage of observed orthologous genes (Fig. 3A, blue bars). For sorghum chromosome 3 and rice chromosome 1 that did not experience any NCF, the gene content was low in centromeric and telomeric re-gions (red arrows). This data suggested that collinearity of genes (blue bars) increased from the centromere to the telomere. More interestingly, for Brachypodium chromosome 2 that went through an NCF event (white bar), the gene density pattern indicated that gene hot-spots precisely corresponded to subtelomeric regions of either the modern Brachypodium chromosome (external red ar-rows) or the fused chromosome (A5, internal red arar-rows). As a re-sult, gene density (or TE density that is negatively correlated), was a prominent evolutionary marker of the NCF pattern of any of the genomes described here. Figure 3A also illustrated how diploid-ization had a major impact on the duplicated gene loss phenom-enon. For instance, the maize genome underwent a recent allote-traploidization event so that maize chromosome 3 and 8 are orthologous to the ancestral chromosome A5. Considering either maize homoeolog, 4587 genes were collinear, a number that dropped dramatically to only 499 if the presence on both homoeo-logs was tested, indicating a higher than average loss of one of the duplicated gene copies in these chromosomal segments of the maize genome, closer to what has been found in fungi (Kellis et al.
2004). Moreover, in genomes that did not undergo WGD, like maize 3639, 4565, and 5313, A5 gene models were collinear with the Brachypodium, sorghum, and rice genomes, respectively (Fig. 3A).
Interestingly, such a drastic reduction in orthologous gene pairs did not seem to have prevailed after the ancient WGD at the root of the grass family of species. A detailed analysis of the an-cestral duplication involving the protochromosomes A11 and A12 showed a greater degree of conserved gene order than expected from the recent WGD of maize. This ancestral duplication was, by definition, common to any cereal genome and involved, in par-ticular, the following chromosome relationships in the current analysis: r11-r12, b4-b4, and s5-s8 (Fig. 3B). Moreover, the density of the conserved paralogous (ancient orthologous) genes is not random within the chromosomal regions investigated. Even, if this duplication is ancestral (;60 Mya), a 3-Mb region (red bars) has remained highly collinear and did not yield the gene loss ob-served for the rest of the considered chromosomal duplications. Previous phylogenetic analysis of such a duplicated segment in rice concluded with nonhomologous gene conversion (Xu and Messing 2008b), which had to be contingent on random somatic spatial association of homologous sequences. Therefore, the dif-ferential loss of one copy of duplicated genes in the subtelomeric region reported here could be the result of the well-known biased gene conversion (BGC) model. In the BGC model, the chromo-somal locations where recombination is the highest should over time increase in their G+C content with decreasing nucleotide substitution rates (Ks) (Marais 2003). In order to test this model, we demonstrated that the low Ks distribution value (Fig. 3B, green curve) fits perfectly with the linear position of conserved gene copies, consistent with a BGC-mediated mechanism of gene copy conservation.
Although the large genome of wheat has not been sequenced yet, we were able to use a reference gene–based genetic map that was recently reassessed in respect to its synteny with the rice, Brachypodium, and maize genomes (Salse et al. 2008) for testing the hypothesis of whether the recombination pattern corre-sponded with its genome evolution. Our analysis indicated that chromosome 1B of bread wheat was the result of an NCF event between A5 and A7 (Fig. 3C). Using this synteny relationship, we plotted several features on this wheat chromosome bin, such as the genetic distance, physical distance, and number of orthologous genes. These data clearly confirmed that the recombination pat-tern (i.e., CO for crossing-over) of the chromosome was directly linked to gene density, gene conservation, and SBPs.
It became clear that gene shuffling (duplication or loss re-sulting in lower syntenic content) took place in distal and high-recombination regions of chromosomes. Synteny between the investigated chromosomes therefore eroded faster in the distal, high-recombination chromosomal regions than in the proximal, low-recombination regions. The subtelomeric regions of today’s, as well as ancient, chromosome arms showed greater erosion of synteny in their distal regions than in their proximal regions. In contrast, the interstitial location of today’s, as well as ancient, chromosome arms did not show this relationship. This finding suggested that the synteny erosion pattern observed in wheat as well as in Brachypodium, sorghum, and rice (Fig. 3A) could have evolved recently in these different genomes. Taken together, the synteny erosion pattern was correlated with a recombination gra-dient, giving new insights for genetic studies. Finally, in terms of agronomical trait dissection perspective, such a common pattern of NCF conserved in cereal genomes tends to suggest that genes
of applicable interest located in a low recombinant centromeric region will be difficult to clone using either segregating pop-ulations (i.e., QTL approach) or historical patterns of recombina-tion (i.e., associarecombina-tion mapping). Figure 3D clearly illustrates that
the centromere of chromosome 7 in barley consists of an entire ancestral chromosome (A8, inserted within A6 during the Triticeae genome evolution) containing about 3000 genes located within an ;20-cM interval.
Figure 3. Impact of polyploidization of the genome structure. (A) Illustration of the synteny between Brachypodium chromosome 2 (3639 genes), sorghum chromosome 3 (4565 genes), rice chromosome 1 (5313 genes), maize chromosomes 3–8 (2873 and 1714 genes, respectively), and their ancestral relative (A5, 988 reordered genes in 96 blocks). Orthologous genes are linked with gray lines. Gene distribution (red curves) and percentage of conserved genes (blue bars) per megabase are provided for the Brachypodium, sorghum, and rice chromosomes (top). The duplication identified between maize chromosomes 3 and 8 as part of the recent tetraploidization are linked with gray lines and represent 499 orthologous relationships (bottom). (B) The ancestral duplication A11 and A12 is illustrated in modern grass species, i.e., rice (r11-r12), sorghum (s5-s8), and Brachypodium (b4-b4). The orthologous relationship between b4-r11-s5 (dark blue chromosomes at the top) and b4-r12-s8 (light blue chromosomes at the bottom) is illustrated with gray blocks. Paralogous gene distribution (bars) per megabase is provided for the three pairwise comparisons, i.e., b4-b4, r11-r12, s5-s8. The differential loss of duplicated genes in the subtelomeric region is illustrated with red bars within the gene distribution. The biased gene conversion (BGC) model for the observed differential loss of duplicated gene copies in the subtelomeric region is illustrated with the calculated nucleotide substitution rates (Ks values from 0–1, left scale) shown as green dots for the classes of paralogous couples highlighted with red bars. (C ) Illustration of the synteny between wheat chromosome 1B and the ancestral relatives A5 and A7. The orthologous conserved genes are linked with colored lines. The height of wheat chromosome bin (from 1BS9 to 1BL3) is mentioned and is associated with the corresponding physical size (red dots), genetic size (blue dots), and number of conserved genes (gray bars), referring to the corresponding colored y-axis at the left of the figure. (D) Illustration of the synteny between barley chromosome 7 (displayed as chromosome heat map: blue, 5 markers; yellow, <5–10 markers; red, >10 markers in a 2-cM window) and the ancestral relatives A6 and A8. Orthologous conserved genes are linked with green (A6) and yellow (A8) lines. NCFs between A8 and A6 that occurred during the Triticeae genome paleo-history establish that A8 covers a 20-cM centromeric interval in the modern barley chromosome structure.
Discussion
Polyploidization followed by diploidization through NCF,
accompanied by genome reshuffling (CI) and inactivation
of paleo-centromere, leads to chromosome number variation
Our analysis suggested that the grass chromosome number re-ductions from n = 12 into five (Brachypodium) and 10 (sorghum and maize) were due to recurrent series of insertions of a chromo-some into the centromeric region of another chromochromo-some, i.e., NCF. As the insertion of a complete chromosome into a centro-meric region is likely to result in a dicentric chromosome, the de-rived composite chromosome could only be maintained as func-tional if one centromere became either inactive or lost and then was identified as a centromere remnant in today’s species. This NCF pattern of evolution seemed to have involved centromeric/ telomeric repeats and was independent of the gene content be-cause we found no evidence that homology be-caused by paleo-tetraploidy of grasses contributed or accelerated this process.
In the current analysis, we could show that plant chromo-some number variation/reduction through NCFs, yielding SBPs, corresponded to (1) a nonrandom centromeric-mediated process, (2) meiotic recombination hotspots, and (3) high sequence turn-over through TE invasion, but appeared to not impact CNVs. In terms of gene-based–assisted selection perspectives, such patterns of NCF will make it difficult to clone genes contributing QTLs that arose in low recombinant centromeric regions during this plant genome evolutionary track.
Although SBP features were quite similar in plants and in mammals at first glance, major differences emerged. One of the fundamental differences was variation that could arise from pair-ing of nonhomologous chromosomes durpair-ing mitosis. Because in plants there is no separate germline, as there is in animals, mitotic recombination events like gene conversion (Xu and Messing 2008b) or nonhomologous end-joining footprinted with filler DNA (Goettel and Messing 2009) could be transmitted into the next generation. By integrating current and previous data, we can then propose a model for plant chromosome evolution involving either nonhomologous (primary) or homologous (secondary) se-quence joining (Lysak et al. 2006; Schubert 2007). The observed NCF and SBP patterns might be interpreted through pericentric inversions followed by reciprocal translocations involving termi-nal breakpoints and the loss of one of the two resulting products. Such a mechanism has been described as the major source of chromosome reduction following WGD in dicots and especially the crucifer species (Schubert 2007; Manda´kova´ and Lysak 2008). We propose that centromeric breaks (CBs), triggered in part by polyploidization, could be considered a signal for chromo-some-wide double-strand break repair (DSBR) processes. Illegiti-mate recombination mediated DSBR between sister chromatids has been suggested as a major evolutionary force of plant ge-nomes in counteracting genome expansion through TE insertion or genomic duplication (Devos et al. 2002; Ma et al. 2004). Classically, the rejoining of DNA fragments separated by several kilobases and carrying different types of sequence motifs, might occur locally (up to ;50-kb loci) by illegitimate recombination mediated through DSBR between homologous chromosomes (Chantret et al. 2005) or nonhomologous chromosomes (Wicker et al. 2010). Recombination might occur via short sequence motifs, leading to the erosion or even loss of microcolinearity. We would argue that such a mechanism not only was suitable for single-and or double-strsingle-anded homologous DNA to repair chromosomal
lesions or breaks but could involve entire nonhomologous chro-mosomes for CB repair as a dominant evolutionary force in plants, leading to centric shifts of modern chromosomes, i.e., centromere loss in the derived dicentric fused chromosomes (Fig. 4).
In our model, illustrated in Figure 4, we propose that after a WGD (panel A), a CB (panel B), or, alternatively, a terminal break (panel C) from ring chromosomes could have taken place, leading to one metacentric (green) and two acrocentric (blue) chromo-somes. For instance, cytological evidence for ring chromosomes has been demonstrated in maize (McClintock 1939). Nonhomologous (or interchromosomal) illegitimate recombination based on re-ciprocal translocation between centromere/telomeric repeats is suggested so that the fused chromosome could be obtained in identical or reverse (if pericentric inversion occur for one of the neo-acrocentric chromosomes) orientation compared with their ancestral counterparts (Fig. 4D). The resulting gamete harboring a reduced number of chromosomes (from two to one in Fig. 4) would be viable when the accompanied rearrangement of such inversions and duplications was tolerated. The centromere of the internal inserted chromosome remained active, whereas the cen-tromere of the external chromosome became inactive and then lost. Such a mechanism would explain the entire set of 26 NCFs reported in the Brachypodium, sorghum, and maize genomes. Still, CBs could also be repaired by homologous (or intrachromosomal) DSBR of homologous chromosomes and could then produce inverted chromosome arms or regions (Fig. 4E,F). This process would also explain the entire set of 45 CIs reported in the Bra-chypodium, sorghum, and maize genomes. Finally, the modern species chromosomes can be displayed according to its ancestral relatives so that high-density islands of genes, TEs, and COs can be directly explained by the fusion/fission cycles that have shaped the modern actual chromosome structure (Fig. 4G,H).
We suggest that such a DSB mis-repair chromosome fusion by ectopic recombination between nonallelic repeats from CB-derived acrocentric and metacentric chromosomes could provide us with a common evolutionary pathway in plants involving centromere and telomere repeat clusters. We could then attribute these features to the evolution of DNA replication and repair mechanisms (especially DSBR) in plants, in part due to the im-mobility of plants compared with animals and their vulnerability to environmental changes. The previously reported fusion–fis-sion cycle between nonhomologous chromosomes observed in plants is quite dissimilar to the telomere-to-telomere (i.e., also called tip-to-tip or end-to-end) fusion proposed for the origin of human chromosomes and more generally as a basis of chromosome reduction in vertebrates (Ijdo et al. 1991).
In mammals, illegitimate recombination between (peri)cen-tromeric repeats is supposed to gradually remove the repeats and heterochromatin from these regions (Ventura et al. 2007). However, in some cases, the remnants of centromere and subtelomere se-quences could still be identified around SBPs, suggesting centro-meric (or pericentrocentro-meric) and telocentro-meric (or subtelocentro-meric) regions were hotspots for DSBR (Blitzblau et al. 2007). These DSBs were repaired by illegitimate recombination between centromeric and telomeric/subtelomeric repeats (Fig. 4). The original centromere– telomere polarity of the chromosome arms in the newly formed chromosome could easily be maintained, suggesting centro-mere–telomere fusions might be the most important force in the evolution of chromosome numbers of the grass species.
In addition, SBPs and associated NCFs boundaries did cor-respond in modern species to regions of abnormal recombination due to mutation and repair activities. These regions could be considered
as ‘‘fragile’’ genomic structures as they became hotspots of chro-mosomal rearrangements such as inversions and repeats inva-sions. Considering that the process leading to the formation of recombinational chiasmata was complex and not completely un-derstood, initiation of double-strand-break-mediated chiasmata leading to normally completed chiasmata might then greatly
improve nonhomologous recombination with similar centro-meric-related sequences on homologous or even different non-homologous chromosomes. The centromere inactivation prior NCF accompanied by the loss of heterochromatin has recently been envisaged for cucumber chromosome 6 (Han et al. 2009). This was clearly the case in the current analysis, where a centromere Figure 4. Model for grass chromosome evolution and shuffling. The model begins with WGD (A), followed by centromeric breaks (B) or terminal breaks (C ), interchromosomal break repair (D), and intra-CBR mechanisms (E, F ), respectively, between nonhomologous (A) and homologous chromosomes (E ) to explain the observed NCF and CI pattern (G) as well as repeat/TE, gene, and CO distribution in rice, maize, sorghum, and Brachypodium genomes, resulting from their paleo-history from their common AGK (H ). Colored arrows represent the different alternative orientation of the double-strand break repair to explain the actual syntenic chromosome order and orientation observed among rice, Brachypodium, sorghum, maize.
remnant could not be identified in ancient NCFs (#2-5-6-7-8-9) and where telomere repeats had been transposed within the en-tire inserted genomic region and were no longer located at the precise boundary break points. A by-product of the insertion of a chromosome by its telomeres into the centromeric region of another chromosome was the maintenance of the centromere– telomere polarity of chromosome arms in the new chromosome that was observed for six of the reported NCFs.
As discussed above, NCFs will result in dicentric chromo-somes, and one of the two centromeres in dicentrics must be inactivated or deleted. Actually, centromere inactivation widely existed in both plants and animals through epigenetic silencing, though the mechanism is still unclear (Amor et al. 2004; Han et al. 2006; Piras et al. 2010). Usually most old centromere locations, which were epigenetically silenced, could not easily be detected because sequences evolved rapidly in the absence of selection, al-though recent ones still retain large amounts of centromere repeat sequences (Amor et al. 2004; Piras et al. 2010). We even found the remnant of subtelomeric and centromeric repeats at SBPs in mod-ern species. New centromere formation or centromere reposition-ing is another frequent phenomenon in mammalians (Marshall et al. 2008). Interestingly, orthologous positions in related grass species indicated hot spots of the insertion of repeated sequences that led to the formation of centromeres in sorghum chromosome 5 and rice chromosome 6 (Xu and Messing 2008a). Comparative fluorescence in situ hybridization mapping using a common set of fosmid clones revealed that the centromere position changed between cucumber and melon after chromosome fusion/fission (Han et al. 2009) and even within the genus of Oryza (Ma et al. 2007). Therefore, the mechanisms must have existed that not only ancient chromosomes could reposition a centromere but also new chromosomes formed by chromosomal rearrangements (chromosome fusion/fission) could reposition a centromere in grass species.
Structural and functional induced changes from
polyploidization provide competitive advantages
The question of whether NCFs that remained intact during a long evolutionary period of time was accidental or imposed by selection remains open. Chromosome organizations were not expected to involve ways that will cause major disruption of molecular path-ways or gene networks essential to plant development. However, the large diverse pattern of sequences in the NCF boundaries reported would favor a random pattern of NCFs in respect to the origin of protochromosomes, which underwent parallel fusion events in the four genomes studied. Moreover the absence of co-regulated gene clusters in plant genomes might explain such an observation (Throude et al. 2009).
Polyploidization followed by diploidization provided a new dynamic pathway for extensive chromosome reshuffling based on inter- or intra-CBRs, leading to NCFs and CIs and resulting in re-duced numbers of chromosomes in today’s species compared with their common paleotetraploid ancestor. These regions became then preferential sites for additional structural adaptations due to the functional competitive advantages. Structural changes also triggered gene-copying events that generated functional redun-dancy followed by pseudogenization (i.e., unexpressed or function-less paralogs), concerted evolution (i.e., conservation of function for paralogs), subfunctionalization (i.e., complementary function of paralogs), or neofunctionalization (i.e., novel function of paralogs) during the course of genome evolution. Functional
di-vergence by either sub- or neofunctionalization among the du-plicated genes is one of the most important sources of evolutionary innovation in complex organisms.
Recent studies suggested that a majority of duplicated genes that are structurally retained during evolution have at least par-tially diverged in their function (Paterson et al. 2004; Doyle et al. 2008). In maize, where a recent WGD occurred in addition to the ancient one, more than 50% of the duplicated genes have been deleted, indicating a selection against gene duplication by ploidy (Messing et al. 2004). These results clearly demonstrate that most of the genetic redundancy originating from polyploid events was erased by a massive loss of duplicated genes by pseudogenization or deletion (chromosome contraction) in one of the duplicated segments soon after the polyploidization event, as shown in maize (Bruggmann et al. 2006). Genome duplications were generally correlated with a sudden burst of species (Van de Peer et al. 2009). The causality or consequence of genome duplications on observed species variability, however, remained unsolved. Still, the conse-quence of polyploidization (reciprocal gene loss, paralogous gene copies, acquisition of novel functions, etc.) could explain how WGD favored the appearance of novel species.
Moreover, it has been well documented in mammals and plants that WGD favors the structural and functional retention of gene regulators such as transcription factors. Our recent data for the monocots (Salse et al. 2009a) were consistent with the results obtained by Paterson and colleagues (Tang et al. 2008) for the eudicots, which showed that ‘‘duplication-resistant’’ gene families corresponded to transcriptional regulators that were preferentially retained after WGD events. While orthologous gene copies of storage protein genes have been lost during the formation of the subfamilies of the Pooideae, Ehrhartoideae, and Panicoideae, orthol-ogous copies of their transcription factor O2 had been preserved through two cycles of WGD (Xu and Messing 2008b, 2009). Thus, additional copies with altered/modified functions would contin-ually appear and be selected for during evolution. We recently could demonstrate that in rice more than 80% of the duplication-resistant rice genes, i.e., for which both copies were structur-ally maintained, were subfunctionalized or neofunctionalized (Throude et al. 2009). We might then suggest that such genes encoding the products known to interact specifically with rapidly changing biotic and abiotic extrinsic factors were far more likely to be structurally and functionally retained after duplication than were genes encoding products involved in relatively stable processes.
Finally, rapid and massive structural (i.e., NCFs, CIs, and de-rived gene shuffling) and functional (i.e., neo- or subfunctionaliza-tion) changes following WGD might provide the ability of poly-ploids to quickly adapt to survive environmental conditions, not tolerated in their diploid ancestors, as it has been reported that neo- or paleopolyploidy (1) increased vigour (Rieseberg et al. 2003), (2) favored tolerance to a wider range of environments (Van de Peer et al. 2009), (3) facilitated self-fertilization, and, therefore, (4) facilitated the formation of asexually reproducing (apomictic) species (Bicknell and Koltunow 2007; Hegarty and Hiscock 2007).
Methods
Genomic sequence data
The sequences of the 12 rice pseudomolecules (build 5) were downloaded from the Rice Genome Annotation Project website
(http://rice.plantbiology.msu.edu/), and the 41,046 genes identi-fied by the annotation were used for the analysis. The sequences of the 10 sorghum chromosomes were downloaded from the Phytozome website (http://www.phytozome.net/sorghum), and the 34,008 gene models identified by the annotation were used for the analysis. The sequences of the 10 maize chromosomes were downloaded from the Arizona Genomics Institute website (http:// www2.genome.arizona.edu/genomes/maize), and the 32,540 gene models identified by the annotation were used for the analysis. The release of the five Brachypodium chromosome sequences were downloaded from the Brachypodium distachyon Information Re-source website (http://www.brachypodium.org/), and the 25,504 gene models identified by the annotation were used for the anal-ysis. Finally, for the synteny analysis involving the bread wheat genome, the 6426 wheat ESTs representing 15,569 nonredundant loci that were assigned to deletion bins by Qi et al. (2004) were downloaded from the GrainGenes website (http://wheat.pw.usda. gov/). Since some ESTs may correspond to nonoverlapping 39 and 59 ends of the same cDNA sequence, we have recently published a unigene set of 5003 mapped wheat ESTs (Salse et al. 2008) that have been used in the current analysis. Centromere and telomere were identified by BLASTN analysis using the following consensus sequences: telomeric repeat, TTTAGGGTTTAGGGTTTAGGGTTTA GGGTTTAGGGTTTAGGGTTTAGGGTTTAGGGTTTAGGGTTTAG GGTTTAGGGTTTAGGGTTTAGGGTTTAGGGTTTAGGGTTTAGG GTTTAGGGTTTAGGGTTTAGGGTTTAGGGTTTAGGGTTTAGGG TTTAGGGTTTAGGG (for the four genomes studied); centromeric repeat, GTACTAGGATGAGCACACCAAACAAAGCAACTCATCGA AGCAAAACAAGACTAGACCACTTGTACGGACTCGCTAGGCAG GGTCCCTCACTAGGATGGACAATTCGGCAAAATCGGAGTCCG TGCTAAACTTTGATCCGGAACGGGTCCATTTGGT (for the Bra-chypodium genome analysis), and GATCTTTGGATTGGAAACAGT TAAAGAACAATATGTGCATGATGATGATTTTAAAGATGTGTTTTT GCATTGTAAGGATGGGAAGGCATGGAATAAATTTGTTGTAAAT GATGGTTTTGTGTTTAGAGCTAATAAGCTATGCATTCCAGCTAG CTCTGTTCGTTTGTTGTTGCTACAGGAAGCACATGGAGGTGGT TTGATGGGACATTTTGGGGCAAAGAAGACGGAGGACATACTG GCTGGTCATTTCTTTTGGCCAAAGATGAGGAGAGATGTGGAG AGATTTATTGCTCGCTGCACGACATGTCAAAAGGCCAAGTCAC GCTTAAATCCACACGATTTGAAGCCATATTTGGGTGAGGGAGA TGAGCTTGAGTCGGGGACGACTCAAATGCAAGAAGGGGAGG ATGATGAGGACATCAGCACCATCTATACATCCACACCTACACC CACACCATCGCCAACACCACTTGGCCCTCTTACTCGTGCCAG TGCCCGTCAACTGAACCATCAAGTAAGTTTATTCTTAAACTCTT GTCCATCATATTTAGACAATGGAGACACGTGCACTCTTGTTTTG CTTAGGAATGATGGAGAGGACCAGAAGCATAGGGGATTGGTG TAGGCTGGATTTGGACAGCAAGACAGCACCAACTTACAACAA CCGCCATGACTTCATACAGAGTCCATTTTAAGCATGCAAGCAC TTGATGGAAAACTCGTCAAGTATATTTTTAGATGGATC (for the sorghum genome analysis).
Although the quality of genome annotation might vary be-tween different sources, our analysis was based on the conser-vation of gene copies between different genomes. Therefore, the most stringent annotated genome provided the dominant ref-erence for our analysis (see also below).
Paralogs and orthologs identification
Three new parameters were recently defined by Salse et al. (2009b) to increase the stringency and significance of BLAST sequence alignment by parsing BLASTN results and rebuilding high scoring pairs (HSPs) or pairwise sequence alignments. The first parameter, aligned length (AL), corresponds to the sum of all HSP lengths. The second, cumulative identity percentage (CIP), corresponds to the cumulative percentage of sequence identity obtained for
all the HSPs (CIP = [+ ID by HSP/AL] 3 100). The third parameter, CALP, is the cumulative alignment length percentage. It represents the sum of the HSP lengths (AL) for all the HSPs divided by the length of the query sequence (CALP = AL/query length). The CIP and CALP parameters allow the identification of the best align-ment, i.e., the highest cumulative percentage of identity in the longest cumulative length, taking into account all HSPs obtained for any pairwise alignment. These parameters were applied to all the BLAST alignments that were performed in this study.
Paralogous pairs identified during the duplication analyses, as well as orthologous gene pairs identified from the collinearity analysis, were statistically validated according to the method de-scribed by Salse et al. (2009b). We derived two criteria based on the complete set of either two paralogous or orthologous regions. These two related regions are characterized by a physical size (Size), a number of annotated genes (Gnumber), and a number of orthologous or paralogous couples (Cnumber). The two derived criteria are the DR and the CR: DR = [(Size 1 + Size 2)/(2 3 Cnumber)] 3 100 and CR = [(2 3 Cnumber)/(Gnumber 1 + Gnumber 2)] 3 100. The DR considers the number of links be-tween two regions (duplicated or syntenic) in regard to the size of the considered blocks. The CR considers the number of links be-tween two regions (duplicated or syntenic) in regard to the number of annotated genes available in the considered blocks. The collin-ear or duplicated regions considered as statistically significant are associated with both the highest DR and cluster length. The re-maining collinear or duplicated regions are then considered as artificial, i.e., obtained at random considering the number of links between two regions (duplicated or syntenic) characterized by a physical size and number of annotated genes available.
Synteny and double synteny block identification
Using the three-way orthology relationships between the rice, Brachypodium, and sorghum genomes, we joined two genes when they were consecutive in the three species. Discarding groups of less than two genes, we got the 245 ancestral blocks. Using the orthology relationships between sorghum and maize genomes, we found all the segments in the sorghum genome that showed a synteny signal with exactly two segments of the maize genome. It is an instance of the ‘‘double conserved synteny’’ principle used for example by Kellis et al. (2004) to analyze synteny relationships in yeasts in the context of WGD. We used the method described by Tannier (2009) to compare a duplicated and a nonduplicated yeast, and based on common intervals, we required that the two seg-ments in the maize genome have at least two genes and that their two ortholog projections on the sorghum genome intersect. The process ended up with 137 disjoint sorghum segments, each of them mapping to two paralogous maize segments. Note that ac-counting for a duplicated genome requires a nonduplicated ge-nome to be compared, which is the case for maize and sorghum, as it was the case for the yeasts.
CAR reconstruction based on double conserved
ancestral blocks
Either with the 245 ancestral blocks constructed from the rice– Brachypodium–sorghum comparison, or with the 137 double ancestral blocks constructed from the maize–sorghum compari-son, it is possible to apply physical mapping techniques described by Chauve and Tannier (2008) and extend it to the context of WGD (Tannier 2009). It consists in computing common intervals of blocks between two genomes, one duplicated and one not du-plicated, or within a single duplicated genome, and to assemble these intervals into CARs. This last part benefits from a combina-torial framework based on the consecutive 1s problem in binary
matrices and produces a set of equivalent solutions, showing the uncertainties in the ancestral block orders. Formally, we construct a binary matrix, in which columns are blocks, and rows are in-tervals. There is a 1 in an entry if the corresponding block belongs to the corresponding interval, and a 0 otherwise. Then we find an ordering of the columns such that in each row, all 1s are consec-utive. If there is no solution, some rows are discarded until there is one.
CARs in AGK taking gene loss into account
The methods described by Chauve and Tannier (2008), as well as all other methods for ancestral gene order reconstructions that we are aware of, need universal blocks as input; that is, no block should be absent from a genome. It is possible to construct such blocks for the orthology comparisons between rice, Brachypodium, and sorghum, as well as between sorghum and maize, by synteny or double synteny block constructions. For the preduplication AGK reconstruction, no such method is possible, since indepen-dent gene losses in all paralogous chromosomes have dashed the hope of recognizing any universal synteny block. Instead, we used here a novel variant of the consecutive ones problem, designed to handle gene losses. It consists in constructing a ternary matrix, in which columns are ancestral genes and rows are common intervals of genes in two paralogous chromosomes. A common interval is then defined by the genes it contains, the genes outside, and the genes that are lost in the chromosomes, so it is not possible to know if the interval contains it or not. So an entry of the matrix is 1 if the gene is in the interval, it is 0 if the gene is in the genome but not in the interval, and X if the gene is not in the genome. Then we stated the following problem: given the 0,1,X matrix, find an ordering of the columns (of the ancestral genes) such that no 0 entry is between two 1s. This problem is known as the ‘‘consecutive ones matrix sandwich (or probe matrix, or inter-val hypergraph) problem,’’ and is NP-complete (Opatrny 1979; Golumbic and Wassermann 1998). We devised a heuristic solver to construct the gene order in the five to seven protochromosomes of the AGK.
Heat map construction
Distribution of key features (centromeric/telomeric prepeats, LTR, CNV, CDS) of grass chromosomes were downloaded from the ge-nomic sequence databases presented previously and illustrated using an adapted version of the CMTV software (Sawkins et al. 2004).
Acknowledgments
This work was supported by grants from the Agence Nationale de la Recherche (Program ANRjc-PaleoCereal, ANR-09-JCJC-0058-01) to J.S.; Cogebi (ANR-08-GENM-036-01) to E.T.; and the Selman A. Waksman Chair in Molecular Genetics to J.M.
References
Amor DJ, Bentley K, Ryan J, Perry J, Wong L, Slater H, Choo KH. 2004. Human centromere repositioning ‘‘in progress’’. Proc Natl Acad Sci 101: 6542–6547.
Bicknell RA, Koltunow AM. 2007. Understanding apomixis: Recent advances and remaining conundrums. Plant Cell 16: 228–245. Blitzblau HG, Bell GW, Rodriguez J, Bell SP, Hochwagen A. 2007. Mapping of
meiotic single-stranded DNA reveals double-stranded-break hotspots near centromeres and telomeres. Curr Biol 17: 2003–2012.
Bolot S, Abrouk M, Masood-Quraishi U, Stein N, Messing J, Feuillet C, Salse J. 2009. The ‘‘inner circle’’ of the cereal genomes. Curr Opin Plant Biol 12: 119–125.
Bruggmann R, Bharti AK, Gundlach H, Lai J, Young S, Pontaroli AC, Wei F, Haberer G, Fuks G, Du C, et al. 2006. Uneven chromosome contraction and expansion in the maize genome. Genome Res 16: 1241–1251. Bulazel KV, Ferreri GC, Eldridge MD, O’Neill RJ. 2007. Species-specific shifts
in centromere sequence composition are coincident with breakpoint reuse in karyotypically divergent lineages. Genome Biol 8: R170. doi: 10.1186/gb-2007-8-8-r170.
Chantret N, Salse J, Sabot F, Rahman S, Bellec A, Laubin B, Dubois I, Dossat C, Sourdille P, Joudrier P, et al. 2005. Molecular basis of evolutionary events that shaped the hardness locus in diploid and polyploid wheat species (Triticum and Aegilops). Plant Cell 17: 1033–1045.
Chauve C, Tannier E. 2008. A methodological framework for the reconstruction of contiguous regions of ancestral genomes and its application to mammalian genomes. PLoS Comput Biol 4: e1000234. doi: 10.1371/journal.pcbi.1000234.
Courcelle E, Beausse Y, Letort S, Stahl O, Fremez R, Ngom-Bru C, Gouzy J, Faraut T. 2008. Narcisse: A mirror view of conserved syntenies. Nucleic Acids Res 36: 485–490.
Devos KM, Brown JK, Bennetzen JL. 2002. Genome size reduction through illegitimate recombination counteracts genome expansion in Arabidopsis. Genome Res 12: 1075–1079.
deWet JMJ. 1987. Hybridization and polyploidy in the Poaceae. In Grass systematics and evolution (ed. T.R. Soderstrom et al.), pp. 188–194. Smithsonian Institution Press, Washington, DC.
Doyle JJ, Flagel LE, Paterson AH, Rapp RA, Soltis DE, Soltis PS, Wendel JF. 2008. Evolutionary genetics of genome merger and doubling in plants. Annu Rev Genet 42: 443–461.
Everts-van der Wind A, Kata SR, Band MR, Rebeiz M, Larkin DM, Everts RE, Green CA, Liu L, Natarajan S, Goldammer T, et al. 2004. A 1463 gene cattle–human comparative map with anchor points defined by human genome sequence coordinates. Genome Res 14: 1424–1437.
Gaut BS. 2002. Evolutionary dynamics of grass genomes. New Phytol 154: 15–28.
Goettel W, Messing J. 2009. Change of gene structure and function by non-homologous end-joining, non-homologous recombination, and transposition of DNA. PLoS Genet 5: e1000516. doi: 10.1371/journal.pgen.1000516. Golumbic MC, Wassermann A. 1998. Complexity and algorithms for graph
and hypergraph sandwich problems. Graphs Combin 14: 223–239. Han F, Lamb JC, Birchler JA. 2006. High frequency of centromere
inactivation resulting in stable dicentric chromosomes of maize. Proc Natl Acad Sci 103: 3238–3243.
Han Y, Zhang Z, Liu C, Liu J, Huang S, Jiang J, Lin W. 2009. Centromere repositioning in cucurbit species: Implication of the genomic impact from centromere activation and inactivation. Proc Natl Acad Sci 106: 14937–14941.
Hegarty M, Hiscock S. 2007. Polyploidy: Doubling up for evolutionary success. Curr Biol 17: 927–929.
Hunziker JH, Stebbins GL. 1987. Chromosomal evolution in the Gramineae. In Grass systematics and evolution (ed. TR Soderstromet al.), pp. 179–187. Smithsonian Institution Press, Washington, DC.
Ijdo JW, Wells RA, Baldini A, Reeders ST. 1991. Improved telomere detection using a telomere repeat probe (TTAGGG)ngenerated by PCR. Nucleic Acids Res 19: 4780.
International Brachypodium Initiative. 2010. Genome sequencing and analysis of the model grass Brachypodium distachyon. Nature 463: 763–768.
International Rice Genome Sequencing Project. 2005. The map-based sequence of the rice genome. Nature 436: 793–800.
Kellis M, Birren BW, Lander ES. 2004. Proof and evolutionary analysis of ancient genome duplication in the yeast Saccharomyces cerevisiae. Nature 428: 617–624.
Kellogg EA. 2001. Evolutionary history of the grasses. Plant Physiol 125: 1198–1205.
Larkin DM, Pape G, Donthu R, Auvil L, Welge M, Lewin HA. 2009. Breakpoint regions and homologous synteny blocks in chromosomes have different evolutionary histories. Genome Res 19: 770–777. Lemaitre C, Zaghloul L, Sagot MF, Gautier C, Arneodo A, Tannier E, Audit B.
2009. Analysis of fine-scale mammalian evolutionary breakpoints provides new insight into their relation to genome organisation. BMC Bioinformatics 10: 335. doi: 10.1186/1471-2164-10-335.
Luo MC, Deal KR, Akhunov ED, Akhunova AR, Anderson OD, Anderson JA, Blake N, Clegg MT, Coleman-Derr D, Conley EJ, et al. 2009. Genome comparisons reveal a dominant mechanism of chromosome number reduction in grasses and accelerated genome evolution in Triticeae. Proc Natl Acad Sci 106: 15780–15785.
Lysak MA, Berr A, Pecinka A, Schmidt R, McBreen K, Schubert I. 2006. Mechanisms of chromosome number reduction in Arabidopsis thaliana and related Brassicaceae species. Proc Natl Acad Sci 103: 5224–5229. Ma J, Devos KM, Bennetzen JL. 2004. Analyses of LTR-retrotransposon
structures reveal recent and rapid genomic DNA loss in rice. Genome Res 14: 860–869.
Ma J, Wing RA, Bennetzen JL, Jackson SA. 2007. Evolutionary history and positional shift of a rice centromere. Genetics 177: 1217–1220. Manda´kova´ T, Lysak MA. 2008. Chromosomal phylogeny and karyotype
evolution in x=7 crucifer species (Brassicaceae). Plant Cell 20: 2559– 2570.
Marais G. 2003. Biased gene conversion: Implications for genome and sex evolution. Trends Genet 19: 330–338.
Marshall OJ, Chueh AC, Wong LH, Choo KH. 2008. Neocentromeres: New insights into centromere structure, disease development, and karyotype evolution. Am J Hum Genet 82: 261–282.
McClintock B. 1939. The behavior in successive nuclear divisions of a chromosome broken at meiosis. Proc Natl Acad Sci 25: 405–416. Messing J, Bharti AK, Karlowski WM, Gundlach H, Kim HR, Yu Y, Wei F, Fuks
G, Soderlund CA, Mayer KF, et al. 2004. Sequence composition and genome organization of maize. Proc Natl Acad Sci 101: 14349–14354. Murphy WJ, Larkin DM, Everts-van der Wind A, Bourque G, Tesler G, Auvil
L, Beever JE, Chowdhary BP, Galibert F, Gatzke L, et al. 2005. Dynamics of mammalian chromosome evolution inferred from multispecies comparative maps. Science 309: 613–617.
Opatrny J. 1979. Total ordering problem. SIAM J Comput 8: 111–114. Paterson AH, Bowers JE, Chapman BA. 2004. Ancient polyploidization
predating divergence of the cereals, and its consequences for comparative genomics. Proc Natl Acad Sci 101: 9903–9908.
Paterson AH, Bowers JE, Bruggmann R, Dubchak I, Grimwood J, Gundlach H, Haberer G, Hellsten U, Mitros T, Poliakov A, et al. 2009. The Sorghum bicolor genome and the diversification of grasses. Nature 457: 551– 556.
Piras FM, Nergadze SG, Magnani E, Bertoni L, Attolini C, Khoriauli L, Raimondi E, Giulotto E. 2010. Uncoupling of satellite DNA and centromeric function in the genus Equus. PLoS Genet 6: e1000845. doi: 10.1371/journal.pgen.1000845.
Qi LL, Echalier B, Chao S, Lazo GR, Butler GE, Anderson OD, Akhunov ED, Dvora´k J, Linkiewicz AM, Ratnasiri A, et al. 2004. A chromosome bin map of 16,000 expressed sequence tag loci and distribution of genes among the three genomes of polyploid wheat. Genetics 168: 701– 712.
Rieseberg LH, Raymond O, Rosenthal DM, Lai Z, Livingstone K, Nakazato T, Durphy JL, Schwarzbach AE, Donovan LA, Lexer C. 2003. Major ecological transitions in wild sunflowers acilitated by hybridization. Science 301: 1211–1216.
Salse J, Bolot S, Throude M, Jouffe V, Piegu B, Masood-Quraishi U, Calcagno T, Cooke R, Delseny M, Feuillet C. 2008. Identification and
characterization of conserved duplications between rice and wheat provide new insight into grass genome evolution. Plant Cell 20: 11–24. Salse J, Abrouk M, Bolot S, Guilhot N, Courcelle E, Faraut T, Waugh R, Close TJ, Messing J, Feuillet C. 2009a. Reconstruction of monocotelydoneous proto-chromosomes reveals faster evolution in plants than in animals. Proc Natl Acad Sci 106: 14908–14913.
Salse J, Abrouk M, Murat F, Masood-Quraishi U, Feuillet C. 2009b. Improved standards and new comparative genomics tools provide new insights into grasses paleogenomics. Brief Bioinform 10: 619–630.
Sawkins MC, Farmer AD, Hoisington D, Sullivan J, Tolopko A, Jiang Z, Ribaut JM. 2004. Comparative map and trait viewer (CMTV): An integrated bioinformatic tool to construct consensus maps and compare QTL and functional genomics data across genomes and experiments. Plant Mol Biol 56: 465–480.
Schibler L, Roig A, Mahe MF, Laurent P, Hayes H, Rodolphe F, Cribiu EP. 2006. High-resolution comparative mapping among man, cattle and mouse suggests a role for repeat sequences in mammalian genome evolution. BMC Genomics 7: 194. doi: 10.1186/1471-2164-7-194. Schnable PS, Ware D, Fulton RS, Stein JC, Wei F, Pasternak S, Liang C, Zhang
J, Fulton L, Graves TA, et al. 2009. The B73 maize genome: Complexity, diversity, and dynamics. Science 326: 1112–1115.
Schubert I. 2007. Chromosome evolution. Curr Opin Plant Biol 10: 109–115. Song R, Llaca V, Messing J. 2002. Mosaic organization of orthologous
sequences in grass genomes. Genome Res 12: 1549–1555.
Swigonˇ ova´ Z, Lai J, Ma J, Ramakrishna W, Llaca V, Bennetzen JL, Messing J. 2004. Close split of maize and sorghum genome progenitors. Genome Res 14: 1916–1923.
Tang H, Wang X, Bowers JE, Ming R, Alam M, Paterson AH. 2008. Unraveling ancient hexaploidy through multiply aligned angiosperm gene maps. Genome Res 18: 1944–1954.
Tannier E. 2009. Yeast ancestral genome reconstructions: The possibilities of computational methods. In Proceedings of RECOMB Comparative Genomics, Lecture Notes in Bioinformatics, vol. 5817. pp. 1–12. Springer, New York.
Throude M, Bolot S, Bosio M, Pont C, Sarda X, Masood Quraishi U, Bourgis F, Lessard P, Rogowsky P, Ghesquiere A, et al. 2009. Structure and expression analysis of rice paleo-duplications. Nucleic Acids Res 37: 1248–1259.
Trinh P, McLysaght A, Sankoff D. 2004. Genomic features in the breakpoint regions between syntenic blocks. Bioinformatics 20: i318–i325. Van de Peer Y, Maere S, Meyer A. 2009. The evolutionary significance of
ancient genome duplications. Nat Rev Genet 10: 725–732.
Ventura M, Antonacci F, Cardone MF, Sprague LJ, Eichler EE, Archidiacono N, Rocchi M. 2007. Evolutionary formation of new centromeres in macaque. Science 316: 243–246.
Wicker T, Buchmann JP, Keller B. 2010. Patching gaps in plant genomes results in gene movement and erosion of colinearity. Genome Res 20: 1229–1237.
Xu JH, Messing J. 2008a. Organization of the prolamin gene family provides insight into the evolution of the maize genome and gene duplications in grass species. Proc Natl Acad Sci 105: 14330–14335.
Xu JH, Messing J. 2008b. Diverged copies of the seed regulatory Opaque-2 gene by a segmental duplication in the progenitor genome of rice, sorghum, and maize. Mol Plant 1: 760–769.
Xu JH, Messing J. 2009. Amplification of prolamin storage protein genes in different subfamilies of the Poaceae. Theor Appl Genet 119: 1397–1412.