HAL Id: hal-02978591
https://hal.archives-ouvertes.fr/hal-02978591
Submitted on 26 Oct 2020
HAL is a multi-disciplinary open access
archive for the deposit and dissemination of sci-entific research documents, whether they are pub-lished or not. The documents may come from teaching and research institutions in France or abroad, or from public or private research centers.
L’archive ouverte pluridisciplinaire HAL, est destinée au dépôt et à la diffusion de documents scientifiques de niveau recherche, publiés ou non, émanant des établissements d’enseignement et de recherche français ou étrangers, des laboratoires publics ou privés.
Refined carbohydrate-rich diet is associated with
long-term risk of dementia and Alzheimer’s disease in
apolipoprotein E ϵ4 allele carriers
Mélissa Gentreau, Virginie Chuy, Catherine Féart, Cécilia Samieri, Karen
Ritchie, Michel Raymond, Claire Berticat, Sylvaine Artero
To cite this version:
Mélissa Gentreau, Virginie Chuy, Catherine Féart, Cécilia Samieri, Karen Ritchie, et al.. Re-fined carbohydrate-rich diet is associated with long-term risk of dementia and Alzheimer’s disease in apolipoprotein E ϵ4 allele carriers. Alzheimer’s & Dementia: Diagnosis, Assessment & Disease Monitoring, Wiley, 2020, 16 (7), pp.1043-1053. �10.1002/alz.12114�. �hal-02978591�
Refined carbohydrate-rich diet is associated with long-term risk of
dementia and Alzheimer’s disease in
apolipoprotein E ε4 allele
carriers
Mélissa Gentreaua, Virginie Chuy b, Catherine Féart b, Cécilia Samieri b, Karen Ritchiea, Michel
Raymondc, Claire Berticatc #, Sylvaine Arteroa # *
a Neuropsychiat Rech Epidemiol & Clin, Univ Montpellier, INSERM, Montpellier, France b Bordeaux Population Health Research Centre, Univ Bordeaux, INSERM, Bordeaux, France c ISEM, Univ Montpellier, CNRS, EPHE, IRD, Montpellier, France.
# These authors contributed equally to this work.
* Corresponding author. Sylvaine Artero, 39 av Charles Flahault BP 34493; 34093 Montpellier cedex 5 Tel.: 0499614568
E-mail address: sylvaine.artero@inserm.fr
Abstract
Introduction: In animal models, refined carbohydrates (RF)worsen Alzheimer’s disease (AD).
However, the long-term effects of high RF intake on the risk of dementia and AD are poorly described
in epidemiological studies. Moreover, the interaction between RF and the apolipoprotein E 𝜀4 allele
(APOE- 𝜀4) is unknown. Our study investigated whether RF-rich diets are associated with the risk of
dementia and AD.
Methods: The glycemic load (GL) was quantified in 2777 elderly participants from the French
Three-City Study to estimate RF intake. Then, the associations between GL and risk of dementia and AD,
and the interaction with APOE- 𝜀4 over a 12-year period were assessed using proportional hazards
models.
Results: After adjustment for potential confounders, high afternoon-snack GL was associated with
increased dementia and AD risk in APOE- 𝜀4 carriers (hazard ratio = 1.27 [1.03–1.56]).
Discussion: This study highlights that RF-rich diets are a risk factor for dementia and AD in APOE-𝜀4
carriers.
KEYWORDS: Alzheimer’s disease, apolipoprotein E 𝜀4, cohort study, dementia, diet, glycemic load,
1. Introduction
According to the World Health Organization, dementia will affect >152 million people by
2050 [1]. Currently no effective treatment is available to cure or slow down dementia progression.
After the repeated failure of clinical trials, now the most promising research focuses on preventing
dementia. Therefore, it is urgent to identify modifiable factors that could be targeted in interventions
to prevent dementia and to promote better brain health in aging populations. Among these
modifiable factors, nutrition has emerged as an important issue [2], particularly the steady increase
in the consumption of refined carbohydrates [3]. Refined carbohydrates are carbohydrates that are
rapidly absorbed into the bloodstream, and include starches and sugars (sucrose, glucose-fructose
syrup). The glycemic and insulinemic responses progressively increase with more processed
carbohydrates. Moreover, some meals are typically high in refined carbohydrates (i.e., breakfast and
afternoon snack) [4], suggesting that they are at greater risk of inducing large glycemic and
insulinemic responses.
In mouse models of Alzheimer’s disease (AD), high sugar diet worsens AD pathophysiology,
notably by causing memory impairment and increasing amyloid beta (Aβ) deposits. These studies
also demonstrated that a high-sugar diet alters brain insulin signaling and leads to insulin resistance
[5,6]. This suggests that diets rich in refined carbohydrates could promote dementia and AD through
insulin resistance [7]. However, insulin resistance and refined carbohydrate-rich diet are important
risk factors of type 2 diabetes (T2D), therefore T2D could be a confounder in the relationship
between refined carbohydrate-rich diet and dementia.
To date the direct association between refined carbohydrate-rich diet and the risk of
dementia or cognitive decline has not been adequately investigated in epidemiological studies [8,9],
as they have been mostly cross-sectional studies with small sample sizes. They showed that refined
carbohydrates consumption is associated with higher amyloid deposits [10], lower entorhinal cortical
thickness [11], and poorer cognitive performance [12]. The few existing longitudinal studies have
carbohydrate consumption: self-reports [13], adherence to a dietary pattern [10], percentages of
calories from carbohydrates [11], glycemic index and/or glycemic load (GL) [12,14,15].
Previous epidemiological studies also suggest that a refined carbohydrate-rich diet may
interact with the apolipoprotein E 𝜀4 allele (APOE-𝜀4), the principal genetic risk factor of AD and
dementia. In animal studies, APOE-𝜀4 carriers are more likely to develop insulin resistance [16], and
this could be exacerbated by consumption of refined carbohydrates [5,6]. Nevertheless, the potential
interaction between a refined carbohydrate-rich diet and APOE-𝜀4 on the risk of dementia has not
been studied in humans.
The objective of this study was to determine whether high refined carbohydrate intake,
estimated by quantifying the GL, is associated with the risk of dementia in a large population-based
prospective cohort study with a 12-year follow-up (the Three-City Study). The present study
addressed four questions: (1) Is a refined-carbohydrate rich diet associated with dementia? (2) Are
some meals more at risk than others? (3) Does refined carbohydrate-rich diet interact with APOE-𝜀4?
(4) Is the association independent of T2D?
2. Methods
2.1 Study participants
The Three-City Study is a French population-based cohort study of 9294 people, aged 65 years and
over, who were randomly selected between 1999 and 2000 from the electoral roll of three French
cities: Bordeaux, Dijon, and Montpellier. A detailed description of the Three-City Study has been
provided elsewhere [17]. Participants had face-to-face interviews with trained nurses and
psychologists at baseline, and at 2, 4, 7, 10, 12, and 15-years follow-up (FU; Figure 1). Questionnaires
were used to collect data on sociodemographic and lifestyle characteristics, education level,
self-reported chronic diseases, depressive symptoms, and functional status. In addition, participants
underwent a comprehensive evaluation of cognitive and physical functions. The present study
filled in the food frequency questionnaire (FFQ) at the first and second follow-up (i.e., 2 and 4 years
after baseline), respectively (Figure 1). Participants with prevalent dementia at the time of FFQ
completion were excluded. A flow chart describes the participants’ selection (Figure 2). At the end of
the study, the mortality rate was 26.9% and the rate of lost participants in the FU was 21.0%. The
Ethical Committee of the University Hospital of Bicêtre (France) approved the study protocol, and all
participants signed an informed consent.
2.2 Dietary data
2.2.1 Food Frequency Questionnaire
Dietary data were collected using a semi-quantitative, 148-item FFQ at 1-FU for Bordeaux and 2-FU
for Montpellier (Figure 1). The FFQ was divided into: breakfast, lunch, dinner, and snacks between
meals (extract from the FFQ in Table S1 in supporting information). Reported frequencies were
transformed into discrete variables as follows: 0 for never or less than once a month, 0.25 for once a
month, 0.5 for twice a month, 0.75 for three times a month, 1 to 7 for one to seven times per week
[18]. Discrete variables were expressed in servings per week.
2.2.2 24-h dietary recall interview
A 24-hour dietary recall interview was performed at the Bordeaux center at 1-FU by trained
dieticians. For each item, seven serving sizes were available. Concordance between FFQ and 24-hour
dietary recall was previously checked for fatty acids [19].These data were only used in sensitivity
analyses.
2.2.3 Glycaemic load
The glycemic index values of FFQ items were obtained from the International Table of Glycemic Index
[20] and internet updates (www.glycemicindex.com), using glucose as the reference. The glycemic
index compares the rate of glucose release by measuring the 2 hours postprandial glycemia after
consumption of a food portion containing 50 g of available carbohydrates. GL reflects both the
glycemic and insulinemic responses [9,12,20]. For each FFQ item (i.e., food/beverage categories), GL
was calculated by multiplying the glycemic index by the amount of available carbohydrates (g) per
serving, divided by 100 [22]. Foods with low carbohydrate content (e.g., meat, fish, fats) were not
assigned any GL value [23]. Then, the GL for each item was multiplied by the frequency of
consumption/week reported by each participant. Finally, the sum of this last value for all the items
consumed during a meal gave the total GL for breakfast, lunch, afternoon snack (“goûter” in French,
corresponding to a snack between lunch and dinner), and dinner. The GL from the 24-hour dietary
recall was estimated using precise food item data and gathered by meal. The daily GL was either the
sum of all the FFQ items or the 24-hour dietary recall. The total GL values for breakfast, lunch,
afternoon snack, and dinner from the FFQ and the 24-hour dietary recall were significantly correlated
in the Bordeaux subsample (range: 0.30 to 0.57). Precise estimation of carbohydrate content was not
possible with this FFQ.
2.2.4 Energy intake
Energy intakes for the corresponding items in the FFQ were obtained from the Anses-Ciqual database
(www.anses.ciqual.fr). The energy intake per serving of each item was multiplied by the reported
frequencies. Then, the sum of the energy intake for the items consumed at each eating occasion gave
the energy intake of each meal. The energy intakes from the 24-hour dietary recall were derived as
previously described [19]. Although the FFQ underestimated the energy intake, the energy intakes
for breakfast, lunch, afternoon snack, and dinner from the FFQ and the 24-hour dietary recall in the
Bordeaux subsample were significantly correlated (range: 0.20 to 0.53).
2.2.5 Mediterranean-like diet score
To take into account the diet quality, a Mediterranean-like diet score was calculated. Items were
grouped according to the nine components of the Mediterranean-like diet score [24,25]. For fruits,
vegetables, legumes, cereals, and fish, one point was assigned when the participant’s consumption
participant’s consumption was below the median, zero otherwise. For alcohol, one point was
assigned when consumption was below 20 g of ethanol per day for men and 5.7 g for women (i.e.,
low-to-moderate alcohol consumption in this population). For the ratio of monounsaturated fatty
acids to saturated fatty acids, one point was assigned when the ratio was above the sex-specific
median, zero otherwise. The total Mediterranean like diet score ranged from zero (lowest
adherence) to nine (highest adherence).
2.3 Diagnosis of dementia
The diagnosis of dementia and its classification was made at each follow-up by the Three-City Study
local clinical investigators, following standardized procedures. Then, an independent committee of
neurologists examined all potential cases of dementia to obtain a consensus on the diagnosis and
etiology based on the Diagnostic and Statistical Manual of Mental Disorders, Fourth Edition [26].
Cases of dementia, including AD, were classified according to the National Institute of Neurological
and Communicative Disorders and Stroke/Alzheimer’s Disease and Related Disorders Association
criteria [27], and cases of mixed/vascular dementia according to the National Institute of
Neurological Disorders and Stroke/Association Internationale pour la Recherche et l’Enseignement
en Neurosciences criteria [28]. Mixed dementia was defined as an AD-type cognitive profile with
either cerebrovascular lesions on brain imaging, or a documented history of stroke and presence of
prominent executive function deficits, attested by the Trail Making Test [29].
2.4 Covariates
Education level was defined as no school, primary school, high school, or graduate level. The
Mini-Mental State Examination [30] was used as an index of global cognitive performance. Body mass
index (BMI) was calculated as weight (kg) / height (m²). Hypertension was defined by systolic blood
pressure ≥140 mmHg, or diastolic blood pressure ≥90 mmHg, or use of antihypertensive drugs [31].
History of head trauma and stroke was established using standardized questions. Cardiovascular
surgery of the legs for arteritis. Hypercholesterolemia was defined as total cholesterol ≥6.2 mmol.L−1.
T2D was defined as treated diabetes, fasting glycaemia >7 mmol.L−1, and additionally self-reported.
APOE genotyping was described elsewhere [32]. APOE-𝜀4 carriers had at least one 𝜀4 allele.
Information was also obtained on the subjectively evaluated health and smoking status (never, past,
or current). Depressive symptomatology was evaluated with the Center for Epidemiological
Studies-Depression (CES-D) scale [33], using the recommended French cut-off scores at 17 and 23 points for
clinically relevant depressive symptom burden in older men and women, respectively [34]. As
physical activity was assessed in a slightly different manner in the two centers [35], a common binary
variable was defined (none or low/regular).
2.5 Data analysis
2.5.1 Covariates selection
First, the main confounding factors of dementia and potential confounding factors related to
carbohydrates were pre-selected. For the outcome-related covariates (dementia) proportional
hazard models adjusted for center, age, sex, and education were performed. For exposure-related
covariates (daily GL) Pearson correlations (for continuous variables) or analysis of variance (ANOVA;
for categorical variables) were used. In both cases, covariates with a P value < .10 were selected.
2.5.2 Main analyses
Proportional hazards models were used to evaluate the association between the GL and the risk of
all-cause dementia over the 11- to 13-year follow-up (mean follow-up = 11.4 ± 2 years), in five
separated analyses (i.e., daily, breakfast, lunch, afternoon snack, dinner). This modeling considers the
time of dementia onset and the participants out of the study (i.e., death, loss of follow-up). In Model
1, analyses were adjusted for age (at the time of the FFQ), sex, education, APOE-𝜀4 carrier status,
BMI, T2D, hypertension, cardiovascular history, stroke, hypercholesterolemia, head trauma, good
subjective health, and tobacco (i.e., the main confounding factors of dementia) [36]. In Model 2,
the high percentage of missing values (6.7% for the Mediterranean diet–like score and 14.3% for
physical activity). In Model 3, incomplete variables were imputed (see below) and analyses were
adjusted for the same variables as in Model 2. The interaction between GL and APOE-𝜀4 was tested
and was kept in the model when significant. The proportional hazards assumption was tested with
the Schöenfeld residuals method. Kaplan- Meyer survival curves were used to graphically illustrate
survival findings.
2.5.3 Imputation of missing values
The percentage of missing values across covariates varied between 0% and 14.3%. To minimize the
loss of power and selection bias, incomplete variables were imputed using the mice package [37]. To
include a large number of related predictor variables without encountering problems due to
collinearity [38], we used the random forest method. Eight multiply imputed datasets were created
and analyzed. The parameters of interest were estimated in each imputed dataset separately, and
combined using Rubin’s rules. The combined results of the imputed datasets are presented in Model
3.
2.5.4 Sensitivity analyses
First, the main analyses concerning participants from Bordeaux were replicated using the GL values
estimated from the 24-hour dietary recall results. Then, participants (both centers) with T2D were
excluded to confirm that GL effect was not mediated by T2D (T2D participants had reduced GL
values). Finally, analyses were restricted to AD by excluding participants (both centers) with incident
mixed and vascular dementia from the main analyses.
3. Results
A total of 2777 participants (n = 1376 from Montpellier and n = 1401 from Bordeaux) were included
mean age was 75.9 years, 61.1% were women, and 10.1% had T2D. During a mean follow-up time of
11.4 years (SD = 2.0 years), 350 participants developed dementia: 260 cases of AD, 49 cases of mixed
dementia, and 41 cases of vascular dementia were identified.
3.1 The statistical interaction between glycaemic load and APOE-ε4 carrier status is associated with the risk of dementia
We asked whether the GL, as an estimation of refined carbohydrate consumption, was associated
with the risk of dementia during the 11.4 years of follow-up (Table 2). We did not find any direct
association between dementia and the daily GL or GL value of breakfast, lunch, afternoon snack, and
dinner. However, the interaction between afternoon-snack GL and APOE-𝜀4 carrier status was
significantly associated with the dementia risk. APOE-𝜀4 carrier status was also associated with the
dementia risk. After adjustments for Mediterranean-like diet score and physical activity (Model 2),
the interaction remained significant. Significant covariates were APOE-𝜀4 carrier status, age, T2D, and
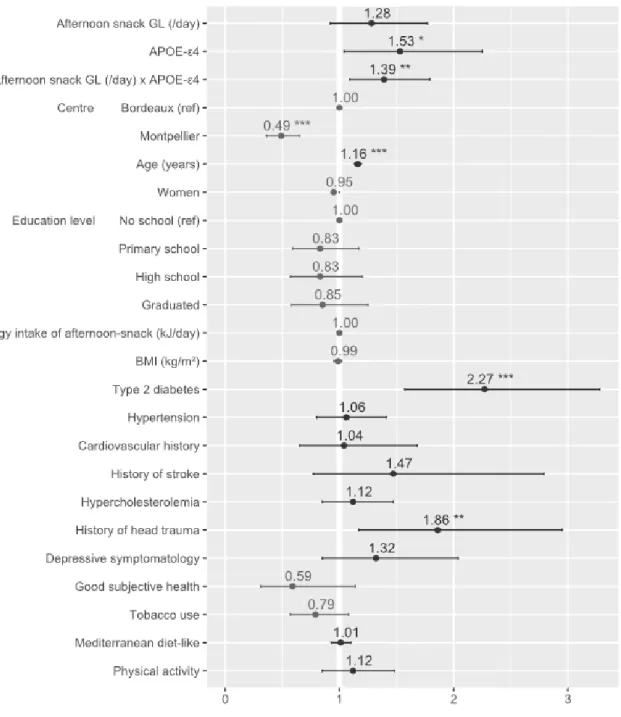
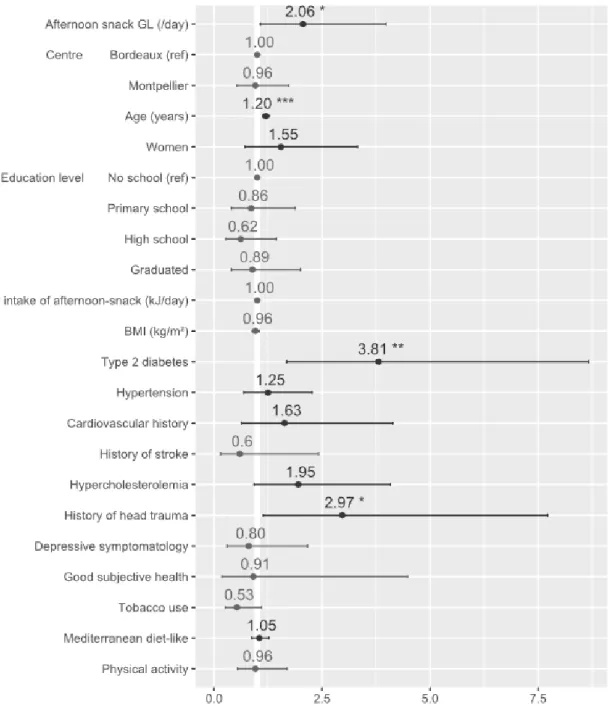
history of head trauma as risk factors and living in Montpellier as protective factor (Figure 3).
Multiple imputations (Model 3) did not change these results showing that the risk of dementia was
higher in APOE-𝜀4 carriers who consumed afternoon snacks with high GL value. To quantify this
association, we stratified by APOE-𝜀4 (Figure S1, S2 in supporting information). In APOE-𝜀4 carriers,
hazard ratio for a 10-point increase in the GL value per day was 2.06 [1.07–4.0]. Finally, in categorical
analyses the interaction between the higher tercile of the afternoon-snack GL and APOE-𝜀4 carrier
status was significantly associated with the dementia risk (Table S3 in supporting information).
Kaplan-Meyer survival curves clearly illustrated it (Figure S3 in supporting information).
3.2 Sensitivity analyses
By estimating the GL on the basis of the FFQ results, we hypothesized that participants consumed
standard serving sizes, leading to potential measurement errors. To evaluate this potential bias, we
ran a sensitivity analysis in the Bordeaux subsample using the GL values estimated from the 24-hour
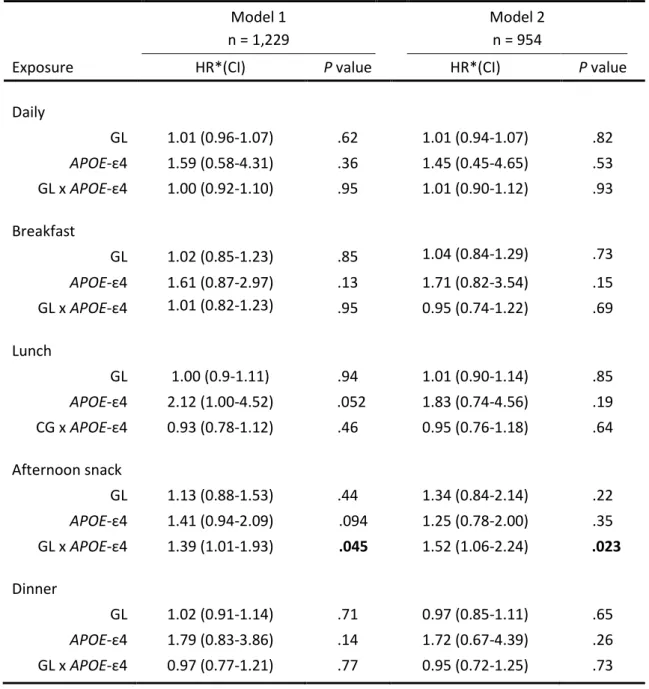
afternoon-snack GL and APOE-𝜀4 carrier status was associated with dementia. Hazard ratios
estimated from the 24-hour dietary recall were comparable to those calculated using the FFQ data.
These analyses validated our results obtained with the GL values estimated from the FFQ. Moreover,
results were not modified by excluding participants with T2D from the analyses (Table S4 in
supporting information). Finally, we showed that the interaction between afternoon-snack GL and
APOE-𝜀4 carrier status was significantly associated with the risk of AD by excluding participants with
incident mixed and vascular dementia (Table S5 in supporting information).
4. Discussion
In this 12-year follow-up study, we found that higher afternoon-snack GL was associated with an
increased risk of dementia and AD in APOE-𝜀4 carriers using two methods for GL evaluation. This
result was independent of energy intake, Mediterranean-like diet, physical activity, and remained
significant after exclusion of participants with T2D. The daily GL and GL values of breakfast, lunch,
and dinner were not associated with the risk of dementia and AD.
Few previous studies have explored the association between refined carbohydrate intake and
dementia or AD. In a cross-sectional analysis, sugar-sweetened beverages were associated with
several markers of preclinical AD, such as low total brain volume, and poor Immediate and Delayed
Logical Memory scores [39]. Similarly, in another study (n = 208 elderly participants), diet with high
GL was associated with poor cognitive performance [12]. The only study on the association between
GL and AD did not find any significant association [15]. As in our study, the authors tested the daily
GL, but not GL by meal. They did not check for an interaction with APOE-𝜀4 and had a shorter
follow-up (6.3 years). In the Framingham Heart Study (10-year follow-follow-up) no association was found between
sugar-sweetened beverages and dementia [40]. Conversely, in the Cardiovascular Risk Factors, Aging
and Dementia study, sugar intake reduction (self-reported) in midlife was associated with lower
carrier status. Specifically, the association between T2D and AD was stronger among APOE-𝜀4
carriers (3.7 times higher) [41].In APOE-𝜀4 carriers, high midlife glycemia was associated with more
serious AD neuropathology [42].Conversely, Schrijvers et al. did not find any significant effect of the
interaction between APOE-𝜀4 carriers and insulin metabolism on AD risk [43].
The statistical interaction between APOE-𝜀4 carrier and afternoon snack GL on the risk of dementia
could be explained in three ways. First, afternoon snacks with high GL could induce oxidative stress, a
favorable environment for insulin resistance. Afternoon snacks tend to have high GL because they
are usually richer in refined carbohydrates, especially sweets, cereal bars, biscuits, and sodas [4]
(Table S6, Figure S4 in supporting information). Snacks are digested more rapidly than full meals
because of their lower content in fat and fiber. Thus, post-prandial glycemia quickly increases and
induces a high peak in insulin secretion. This chronically repeated high and transitory insulin peaks
could promote insulin resistance through oxidative stress and inflammation [44,45] (glucose toxicity
hypothesis). Second, APOE-𝜀4 carriers are more likely to develop insulin resistance. As APOE-𝜀4
carriers have lower antioxidant activity than APOE-𝜀4 non-carriers [46], they are less resistant to
oxidative stress. Evidence from several studies suggests that APOE-𝜀4 carriers are less sensitive to
insulin. Animal experiments provided a molecular explanation of this observation. In mice that
express human APOE-𝜀4, APOE4 impairs insulin signaling in the cortex, and the hippocampus in an
age dependent manner [16]. Moreover, in these mice, the transcription factor peroxisome
proliferator-activated receptor gamma, which increases insulin sensitivity, is downregulated [47,48],
and glucose metabolism in the brain is decreased. The authors found that this lower glucose
metabolism was caused by impaired glucose uptake, glycolytic activity, and mitochondrial
respiration. These results are in agreement with epidemiological studies showing that APOE-𝜀4
carriers have lower brain glucose metabolism (measured by 18F-fluorodeoxyglucose
positron-emission tomography) [49,50].Third, the association between insulin resistance and dementia risk is
stronger in APOE-𝜀4 carriers. In the Uppsala Longitudinal Study of Adult Men, high fasting serum
dementia or cognitive impairment over 32 years [51].The association was stronger in APOE-𝜀4
carriers. We could hypothesize that high intake of refined carbohydrates at afternoon-snack time
induces insulin resistance that in turn promotes dementia development. Alternatively, perhaps
APOE-𝜀4 carriers spontaneously consume more refined carbohydrates to compensate for the lower
glucose metabolism induced by APOE4. However, in our sample carbohydrate-based food groups
were not different between APOE-𝜀4 carriers and non-carriers (data not shown).
On the other hand, the estimated GL values for breakfast, lunch, and dinner might not reflect the real
GL values resulting from the digestion of all food together (i.e., carbohydrates with vegetables, meat,
fish, and fat). During meals, carbohydrates are rarely ingested alone, and their degradation and
absorption rates during digestion are modified by the other macronutrients. For example, adding fat
and/or protein components to a high glycemic index meal decreases the glycemic response [52].
Dietary fibers have a similar effect [53]. The order of food macronutrient intake also changes the
glycemic and insulinemic responses. Indeed, higher postprandial glycemic and insulinemic responses
are observed when high glycemic index carbohydrates (e.g., rice) are eaten first and then vegetables
and meat compared to eating all these foods together [54].
The major strengths of our study are the prospective population-based design, the large number of
participants, and the long follow-up period. Data from the 24-hour dietary recall (Bordeaux
subsample) validated the results obtained with the FFQ. Moreover, we adjusted for numerous
confounding factors. Specifically, our results are independent from energy intake, BMI, diet quality,
physical activity, T2D, and also from a possible protective effect of Mediterranean
lifestyle (living in the Montpellier center). However, our study presents some limitations. First, we did
not repeat the FFQ during the follow-up. Hence, we could not determine the participants’ exposure
duration to the actual diet and we do not know whether participants changed their dietary habits
during the follow-up. Second, the dietary habits, assessed 12 years ago, could have already reflected
overestimated the association between afternoon-snack GL and dementia risk in APOE-𝜀4 carriers.
Third, we did not have access to fasting serum insulin data to calculate the HOMA-IR index and to
test whether there is an interaction between APOE-𝜀4 carriers and insulin resistance. Thus, we could
not verify whether insulin resistance promotes dementia.
In our prospective cohort study, afternoon snacks rich in refined carbohydrates were associated with
dementia risk in APOE-𝜀4 carriers. These results pave the way to new prevention strategies.
However, large-scale studies in different populations and using a homogeneous methodology are
required to replicate this observation. Moreover, the statistical interaction between APOE-𝜀4 status
and refined carbohydrate-rich diet should be assessed in future studies. More investigations are
needed to explain the mechanisms underlying the role of refined carbohydrate intake, glycemic
response, and APOE-𝜀4 in dementia pathophysiology.
Research in Context
1. Systematic review: We searched for relevant literature using online databases PubMed. We
noted the scarcity of published studies dealing with the association between “dementia”
[Mesh] or “cognitive dysfunction” [Mesh] and “sugar(s)”, “carbohydrate(s)”, “glyc(a)emic
index” or “glyc(a)emic load”. We observed that most of these studies were cross-sectional
and/or had a small sample size.
2. Interpretation: Our findings indicate an association between afternoon-snack with a high
refined-carbohydrate diet and the risk of dementia in carriers of Apolipoprotein ε4 allele.
3. Future directions: Prospective studies are required to confirm our results. Experimental
studies are needed to further explore the relationship between refined carbohydrate diet,
Acknowledgements
The 3C Study is carried out under a partnership agreement between Inserm, the Victor Segalen–
Bordeaux II University, and Sanofi-Synthélabo. The Fondation pour la Recherche Médicale funded the
preparation and first phase of the study. The 3C Study is also supported by the Caisse Nationale
Maladie des Travailleurs Salariés, Direction Générale de la Santé, MGEN, the Institut de la Longévité,
Agence Française de Sécurité Sanitaire des Produits de Santé, the Regional Governments of
Aquitaine, Bourgogne and Languedoc-Roussillon, Fondation de France, and the Ministry of
Research-Inserm Programme ‘Cohorts and collection of biological material’.
This study was also supported by Union France Alzheimer.
None of the funding organizations or sponsors played a role in the study design and conduct; in the
data collection, management, analysis, or interpretation; or in the preparation, review, or approval
of the manuscript.
This is contribution ISEM 2020 – 090 of the Institute of Evolutionary Science of Montpellier.
Conflicts of interest
The authors have no conflicts of interest to report.
References
[1] World Health Organization. Dementia. WHO 2019.
https://www.who.int/news-room/fact-sheets/detail/dementia (accessed June 11, 2019).
[2] Scarmeas N, Anastasiou CA, Yannakoulia M. Nutrition and prevention of cognitive impairment.
The Lancet Neurology 2018;17:1006–15. https://doi.org/10.1016/S1474-4422(18)30338-7.
[3] Gross LS, Li L, Ford ES, Liu S. Increased consumption of refined carbohydrates and the epidemic
of type 2 diabetes in the United States: an ecologic assessment. Am J Clin Nutr 2004;79:774–9.
[4] Bellisle F, Dalix AM, Mennen L, Galan P, Hercberg S, de Castro JM, et al. Contribution of snacks
and meals in the diet of French adults: a diet-diary study. Physiol Behav 2003;79:183–9.
[5] Cao D, Lu H, Lewis TL, Li L. Intake of sucrose-sweetened water induces insulin resistance and
exacerbates memory deficits and amyloidosis in a transgenic mouse model of Alzheimer
disease. J Biol Chem 2007;282:36275–82. https://doi.org/10.1074/jbc.M703561200.
[6] Orr ME, Salinas A, Buffenstein R, Oddo S. Mammalian target of rapamycin hyperactivity
mediates the detrimental effects of a high sucrose diet on Alzheimer’s disease pathology.
Neurobiol Aging 2014;35:1233–42. https://doi.org/10.1016/j.neurobiolaging.2013.12.006.
[7] Arnold SE, Arvanitakis Z, Macauley-Rambach SL, Koenig AM, Wang H-Y, Ahima RS, et al. Brain
insulin resistance in type 2 diabetes and Alzheimer disease: concepts and conundrums. Nat Rev
Neurol 2018;14:168–81. https://doi.org/10.1038/nrneurol.2017.185.
[8] Philippou E, Pot GK, Heraclides A, Richards M, Bendayan R. Dietary glycaemic index and
cognitive function: prospective associations in adults of the 1946 British birth cohort. Public
Health Nutrition 2019;22:1415–24. https://doi.org/10.1017/S136898001800352X.
[9] Gilsenan MB, de Bruin EA, Dye L. The influence of carbohydrate on cognitive performance: a
critical evaluation from the perspective of glycaemic load. Br J Nutr 2009;101:941–9.
https://doi.org/10.1017/S0007114508199019.
[10] Taylor MK, Sullivan DK, Swerdlow RH, Vidoni ED, Morris JK, Mahnken JD, et al. A high-glycemic
diet is associated with cerebral amyloid burden in cognitively normal older adults. Am J Clin
Nutr 2017;106:1463–70. https://doi.org/10.3945/ajcn.117.162263.
[11] Staubo SC, Aakre JA, Vemuri P, Syrjanen JA, Mielke MM, Geda YE, et al. Mediterranean diet,
micronutrients and macronutrients, and MRI measures of cortical thickness. Alzheimer’s &
Dementia 2017;13:168–77. https://doi.org/10.1016/j.jalz.2016.06.2359.
[12] Power SE, O’Connor EM, Ross RP, Stanton C, O’Toole PW, Fitzgerald GF, et al. Dietary glycaemic
load associated with cognitive performance in elderly subjects. Eur J Nutr 2015;54:557–68.
[13] Sindi S, Kåreholt I, Eskelinen M, Hooshmand B, Lehtisalo J, Soininen H, et al. Healthy Dietary
Changes in Midlife Are Associated with Reduced Dementia Risk Later in Life. Nutrients
2018;10:1649. https://doi.org/10.3390/nu10111649.
[14] Seetharaman S, Andel R, McEvoy C, Dahl Aslan AK, Finkel D, Pedersen NL. Blood Glucose,
Diet-Based Glycemic Load and Cognitive Aging Among Dementia-Free Older Adults. J Gerontol A Biol
Sci Med Sci 2015;70:471–9. https://doi.org/10.1093/gerona/glu135.
[15] Luchsinger JA, Tang MX, Mayeux R. Glycemic load and risk of Alzheimer’s disease. J Nutr Health
Aging 2007;11:238–41.
[16] Zhao N, Liu C-C, Van Ingelgom AJ, Martens YA, Linares C, Knight JA, et al. Apolipoprotein E4
Impairs Neuronal Insulin Signaling by Trapping Insulin Receptor in the Endosomes. Neuron
2017;96:115-129.e5. https://doi.org/10.1016/j.neuron.2017.09.003.
[17] 3C Study Group. Vascular factors and risk of dementia: design of the Three-City Study and
baseline characteristics of the study population. Neuroepidemiology 2003;22:316–25.
https://doi.org/10.1159/000072920.
[18] Samieri C, Jutand M-A, Féart C, Capuron L, Letenneur L, Barberger-Gateau P. Dietary patterns
derived by hybrid clustering method in older people: association with cognition, mood, and
self-rated health. J Am Diet Assoc 2008;108:1461–71.
https://doi.org/10.1016/j.jada.2008.06.437.
[19] Féart C, Jutand MA, Larrieu S, Letenneur L, Delcourt C, Combe N, et al. Energy, macronutrient
and fatty acid intake of French elderly community dwellers and association with
socio-demographic characteristics: data from the Bordeaux sample of the Three-City Study. Br J Nutr
2007;98:1046–57. https://doi.org/10.1017/S0007114507756520.
[20] Foster-Powell K, Holt SHA, Brand-Miller JC. International table of glycemic index and glycemic
load values: 2002. Am J Clin Nutr 2002;76:5–56. https://doi.org/10.1093/ajcn/76.1.5.
[21] Salmerón J, Manson JE, Stampfer MJ, Colditz GA, Wing AL, Willett WC. Dietary fiber, glycemic
[22] Monro JA, Shaw M. Glycemic impact, glycemic glucose equivalents, glycemic index, and
glycemic load: definitions, distinctions, and implications. Am J Clin Nutr 2008;87:237S-243S.
https://doi.org/10.1093/ajcn/87.1.237S.
[23] van Bakel MME, Kaaks R, Feskens EJM, Rohrmann S, Welch AA, Pala V, et al. Dietary glycaemic
index and glycaemic load in the European Prospective Investigation into Cancer and Nutrition.
Eur J Clin Nutr 2009;63:S188–205. https://doi.org/10.1038/ejcn.2009.81.
[24] Trichopoulou A, Costacou T, Bamia C, Trichopoulos D. Adherence to a Mediterranean Diet and
Survival in a Greek Population. New England Journal of Medicine 2003;348:2599–608.
https://doi.org/10.1056/NEJMoa025039.
[25] Féart C, Samieri C, Rondeau V, Amieva H, Portet F, Dartigues J-F, et al. Adherence to a
Mediterranean diet, cognitive decline, and risk of dementia. JAMA 2009;302:638–48.
https://doi.org/10.1001/jama.2009.1146.
[26] American Psychiatric Association. Diagnostic and Statistical Manual of Mental Disorders, 4th
Edition, Text Revision (DSM-IV-TR). American Psychiatric Association; 2000.
[27] McKhann G, Drachman D, Folstein M, Katzman R, Price D, Stadlan EM. Clinical diagnosis of
Alzheimer’s disease: report of the NINCDS-ADRDA Work Group under the auspices of
Department of Health and Human Services Task Force on Alzheimer’s Disease. Neurology
1984;34:939–44. https://doi.org/10.1212/wnl.34.7.939.
[28] Román GC, Tatemichi TK, Erkinjuntti T, Cummings JL, Masdeu JC, Garcia JH, et al. Vascular
dementia: diagnostic criteria for research studies. Report of the NINDS-AIREN International
Workshop. Neurology 1993;43:250–60. https://doi.org/10.1212/wnl.43.2.250.
[29] Reitan RM. Validity of the Trail Making Test as an Indicator of Organic Brain Damage. Percept
Mot Skills 1958;8:271–6. https://doi.org/10.2466/pms.1958.8.3.271.
[30] Folstein MF, Folstein SE, McHugh PR. “Mini-mental state”. A practical method for grading the
[31] Brindel P, Hanon O, Dartigues J-F, Ritchie K, Lacombe J-M, Ducimetière P, et al. Prevalence,
awareness, treatment, and control of hypertension in the elderly: the Three City study. J
Hypertens 2006;24:51–8.
[32] Dufouil C, Richard F, Fiévet N, Dartigues JF, Ritchie K, Tzourio C, et al. APOE genotype,
cholesterol level, lipid-lowering treatment, and dementia: the Three-City Study. Neurology
2005;64:1531–8. https://doi.org/10.1212/01.WNL.0000160114.42643.31.
[33] Radloff LS. The CES-D Scale: A Self-Report Depression Scale for Research in the General
Population. Applied Psychological Measurement 1977;1:385–401.
https://doi.org/10.1177/014662167700100306.
[34] Fuhrer R, Rouillon F. La version française de l’échelle CES-D (Center for Epidemiologic
Studies-Depression Scale). Description et traduction de l’échelle d’autoévaluation. European Psychiatry
1989;4:163–6.
[35] Letois F, Mura T, Scali J, Gutierrez L-A, Féart C, Berr C. Nutrition and mortality in the elderly
over 10 years of follow-up: the Three-City study. Br J Nutr 2016;116:882–9.
https://doi.org/10.1017/S000711451600266X.
[36] Norton S, Matthews FE, Barnes DE, Yaffe K, Brayne C. Potential for primary prevention of
Alzheimer’s disease: an analysis of population-based data. Lancet Neurol 2014;13:788–94.
https://doi.org/10.1016/S1474-4422(14)70136-X.
[37] Buuren S van. Flexible Imputation of Missing Data, Second Edition. Chapman and Hall/CRC;
2018. https://doi.org/10.1201/9780429492259.
[38] Shah AD, Bartlett JW, Carpenter J, Nicholas O, Hemingway H. Comparison of random forest and
parametric imputation models for imputing missing data using MICE: a CALIBER study. Am J
Epidemiol 2014;179:764–74. https://doi.org/10.1093/aje/kwt312.
[39] Pase MP, Himali JJ, Jacques PF, DeCarli C, Satizabal CL, Aparicio H, et al. Sugary beverage intake
and preclinical Alzheimer’s disease in the community. Alzheimers Dement 2017;13:955–64.
[40] Pase MP, Himali JJ, Beiser AS, Aparicio HJ, Satizabal CL, Vasan RS, et al. Sugar- and Artificially
Sweetened Beverages and the Risks of Incident Stroke and Dementia: A Prospective Cohort
Study. Stroke 2017;48:1139–46. https://doi.org/10.1161/STROKEAHA.116.016027.
[41] Peila R, Rodriguez BL, Launer LJ. Type 2 Diabetes, APOE Gene, and the Risk for Dementia and
Related Pathologies: The Honolulu-Asia Aging Study. Diabetes 2002;51:1256–62.
https://doi.org/10.2337/diabetes.51.4.1256.
[42] Bangen KJ, Himali JJ, Beiser AS, Nation DA, Libon DJ, Fox CS, et al. Interaction Between Midlife
Blood Glucose and APOE Genotype Predicts Later Alzheimer’s Disease Pathology. J Alzheimers
Dis 2016;53:1553–62. https://doi.org/10.3233/JAD-160163.
[43] Schrijvers EMC, Witteman JCM, Sijbrands EJG, Hofman A, Koudstaal PJ, Breteler MMB. Insulin
metabolism and the risk of Alzheimer disease. Neurology 2010;75:1982–7.
https://doi.org/10.1212/WNL.0b013e3181ffe4f6.
[44] Butterfield DA, Di Domenico F, Barone E. Elevated Risk of Type 2 Diabetes for Development of
Alzheimer Disease: a Key Role for Oxidative Stress in Brain. Biochim Biophys Acta
2014;1842:1693–706. https://doi.org/10.1016/j.bbadis.2014.06.010.
[45] Nolan CJ, Ruderman NB, Kahn SE, Pedersen O, Prentki M. Insulin resistance as a physiological
defense against metabolic stress: implications for the management of subsets of type 2
diabetes. Diabetes 2015;64:673–86. https://doi.org/10.2337/db14-0694.
[46] Jofre-Monseny L, Minihane A-M, Rimbach G. Impact of apoE genotype on oxidative stress,
inflammation and disease risk. Mol Nutr Food Res 2008;52:131–45.
https://doi.org/10.1002/mnfr.200700322.
[47] Keeney JT-R, Ibrahimi S, Zhao L. Human ApoE Isoforms Differentially Modulate Glucose and
Amyloid Metabolic Pathways in Female Brain: Evidence of the Mechanism of Neuroprotection
by ApoE2 and Implications for Alzheimer’s Disease Prevention and Early Intervention. J
[48] Wu L, Zhang X, Zhao L. Human ApoE Isoforms Differentially Modulate Brain Glucose and Ketone
Body Metabolism: Implications for Alzheimer’s Disease Risk Reduction and Early Intervention. J
Neurosci 2018;38:6665–81. https://doi.org/10.1523/JNEUROSCI.2262-17.2018.
[49] Reiman EM, Chen K, Alexander GE, Caselli RJ, Bandy D, Osborne D, et al. Correlations between
apolipoprotein E epsilon4 gene dose and brain-imaging measurements of regional
hypometabolism. Proc Natl Acad Sci USA 2005;102:8299–302.
https://doi.org/10.1073/pnas.0500579102.
[50] Rimajova M, Lenzo NP, Wu J-S, Bates KA, Campbell A, Dhaliwal SS, et al.
Fluoro-2-deoxy-D-glucose (FDG)-PET in APOEepsilon4 carriers in the Australian population. J Alzheimers Dis
2008;13:137–46.
[51] Rönnemaa E, Zethelius B, Sundelöf J, Sundström J, Degerman-Gunnarsson M, Berne C, et al.
Impaired insulin secretion increases the risk of Alzheimer disease. Neurology 2008;71:1065–71.
https://doi.org/10.1212/01.wnl.0000310646.32212.3a.
[52] Hätönen KA, Virtamo J, Eriksson JG, Sinkko HK, Sundvall JE, Valsta LM. Protein and fat modify
the glycaemic and insulinaemic responses to a mashed potato-based meal. Br J Nutr
2011;106:248–53. https://doi.org/10.1017/S0007114511000080.
[53] Post RE, Mainous AG, King DE, Simpson KN. Dietary fiber for the treatment of type 2 diabetes
mellitus: a meta-analysis. J Am Board Fam Med 2012;25:16–23.
https://doi.org/10.3122/jabfm.2012.01.110148.
[54] Sun L, Goh HJ, Govindharajulu P, Leow MK-S, Henry CJ. Postprandial glucose, insulin and
incretin responses differ by test meal macronutrient ingestion sequence (PATTERN study). Clin
Figure 1. Time frame of the Three-City Study at the Bordeaux and Montpellier centres. Diagnosis of
dementia is made at each follow-up visit (FU). The food frequency questionnaire(FFQ) was
completed by participants at 1-FU in Bordeaux and at 2-FU in Montpellier. The 24-h dietary recall
(24-R) was only completed by participants at 1-FU in Bordeaux.
Figure 2. Flow chart of the study sample from the Bordeaux and Montpellier centres of the
Three-City Study. Abbreviations: FFQ, Food frequency questionnaire; FU, follow-up; LBD, Lewy Body
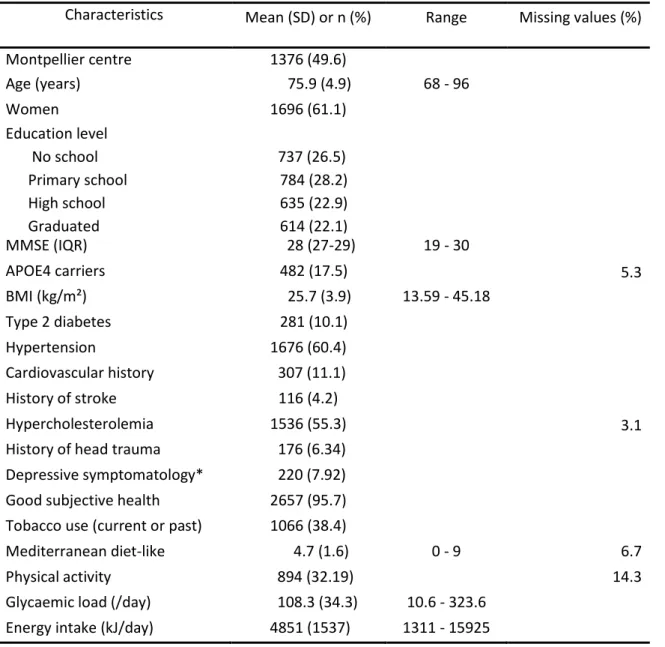
Table 1 Characteristics of the study population
Characteristics Mean (SD) or n (%) Range Missing values (%)
Montpellier centre 1376 (49.6) Age (years) 75.9 (4.9) 68 - 96 Women 1696 (61.1) Education level No school Primary school High school Graduated 737 (26.5) 784 (28.2) 635 (22.9) 614 (22.1) MMSE (IQR) 28 (27-29) 19 - 30 APOE4 carriers 482 (17.5) 5.3 BMI (kg/m²) 25.7 (3.9) 13.59 - 45.18 Type 2 diabetes 281 (10.1) Hypertension 1676 (60.4) Cardiovascular history 307 (11.1) History of stroke 116 (4.2) Hypercholesterolemia 1536 (55.3) 3.1
History of head trauma 176 (6.34)
Depressive symptomatology* 220 (7.92)
Good subjective health 2657 (95.7)
Tobacco use (current or past) 1066 (38.4)
Mediterranean diet-like 4.7 (1.6) 0 - 9 6.7
Physical activity 894 (32.19) 14.3
Glycaemic load (/day) 108.3 (34.3) 10.6 - 323.6
Energy intake (kJ/day) 4851 (1537) 1311 - 15925
*evaluated with the Center for Epidemiological Studies-Depression scale. Abbreviations: APOE-ε4, apolipoprotein E 4 allele; BMI, body mass index; MMSE, Mini Mental State Examination; SD, standard deviation.
Table 2. Association between glycaemic load and risk of dementia over 11.4 ± 2 years of follow-up. Model 1 n = 2,572 Model 2 n = 2,145 Model 3 n = 2,777
Exposure HR*(CI) P value HR*(CI) P value HR*(CI) P value
Daily GL 0.99 (0.91-1.08) .86 1.00 (0.91-1.11) .97 1.01 (0.94-1.10) .73 APOE-ε4 1.12 (0.44-2.90) .81 1.14 (0.38-3.40) .82 1.32 (0.53-3.29) .56 GL x APOE-ε4 1.05 (0.97-1.14) .21 1.05 (0.96-1.16) .28 1.04 (0.96-1.13) .32 Breakfast GL 0.97 (0.81-1.15) .72 0.99 (0.80-1.21) .90 1.03 (0.87-1.21) .75 APOE-ε4 1.46 (0.79-2.70) .23 1.80 (0.89-3.64) .10 1.58 (0.88-2.85) .12 GL x APOE-ε4 1.13 (0.92-1.40) .25 1.05 (0.82-1.34) .72 1.10 (0.90-1.35) .34 Lunch GL 0.91 (0.72-1.15) .43 0.91 (0.69-1.21) .53 0.99 (0.80-1.24) .96 APOE-ε4 2.07 (0.82-5.2) .12 2.65 (0.90-7.84) .078 2.16 (0.88-5.29) .093 CG x APOE-ε4 0.99 (0.76-1.29) .96 0.92 (0.67-1.27) .62 0.98 (0.76-1.27) .91 Afternoon snack GL 1.18 (0.89-1.55) .24 1.28 (0.92-1.77) .14 1.13 (0.87-1.46) .36 APOE-ε4 1.59 (1.14-2.22) .007 1.53 (1.04-2.25) .03 1.65 (1.20-2.28) .002 GL x APOE-ε4 1.31 (1.05-1.63) .015 1.39 (1.09-1.79) .009 1.27 (1.03-1.57) .027 Dinner GL 0.92 (0.74-1.13) .42 0.94 (0.73-1.22) .65 0.88 (0.72-1.09) .25 APOE-ε4 2.73 (1.25-5.96) .012 2.65 (1.03-6.86) .044 2.84 (1.33-6.08) .007 GL x APOE-ε4 0.91 (0.73-1.14) .42 0.92 (0.71-1.20) .56 0.91 (0.73-1.12) .36
Abbreviations: APOE-ε4, Apolipoprotein E 4 allele; CI, confidence interval; GL, glycaemic load; HR, hazard ratio. NOTE. Proportional hazard models. Model 1 was adjusted for inclusion centre, age, sex, education level, energy intake,
APOE-ε4 status, BMI, type 2 diabetes, hypertension, cardiovascular history, history of stroke, hypercholesterolemia, history
of head trauma, depressive symptomatology, subjective health, and tobacco. Model 2 included additional adjustments for Mediterranean diet-like score and physical activity. Model 3 is Model 2 with multiple imputations
* HR for a 10-point increase in the GL value per day that is equivalent to eating an additional 30 g of a French baguette at each corresponding meal.
Figure 3. Estimated hazard ratios of all covariates from Model 2 (n = 2,145). The hazard ratio of the
afternoon-snack GL is expressed as a 10-point increase of the GL value per day that is equivalent to
eating an additional 30 g of French baguette at each corresponding meal. Abbreviations: APOE-ε4,
apolipoprotein E 4 allele; BMI, body mass index; GL, glycemic load.* P value < .05; ** P value < .01;
Table 3. Association between the glycaemic load, estimated from the 24-h dietary recall interview
(Bordeaux centre), and the risk of dementia during 13 years of follow-up.
Model 1 n = 1,229
Model 2 n = 954
Exposure HR*(CI) P value HR*(CI) P value
Daily GL 1.01 (0.96-1.07) .62 1.01 (0.94-1.07) .82 APOE-ε4 1.59 (0.58-4.31) .36 1.45 (0.45-4.65) .53 GL x APOE-ε4 1.00 (0.92-1.10) .95 1.01 (0.90-1.12) .93 Breakfast GL 1.02 (0.85-1.23) .85 1.04 (0.84-1.29) .73 APOE-ε4 1.61 (0.87-2.97) .13 1.71 (0.82-3.54) .15 GL x APOE-ε4 1.01 (0.82-1.23) .95 0.95 (0.74-1.22) .69 Lunch GL 1.00 (0.9-1.11) .94 1.01 (0.90-1.14) .85 APOE-ε4 2.12 (1.00-4.52) .052 1.83 (0.74-4.56) .19 CG x APOE-ε4 0.93 (0.78-1.12) .46 0.95 (0.76-1.18) .64 Afternoon snack GL 1.13 (0.88-1.53) .44 1.34 (0.84-2.14) .22 APOE-ε4 1.41 (0.94-2.09) .094 1.25 (0.78-2.00) .35 GL x APOE-ε4 1.39 (1.01-1.93) .045 1.52 (1.06-2.24) .023 Dinner GL 1.02 (0.91-1.14) .71 0.97 (0.85-1.11) .65 APOE-ε4 1.79 (0.83-3.86) .14 1.72 (0.67-4.39) .26 GL x APOE-ε4 0.97 (0.77-1.21) .77 0.95 (0.72-1.25) .73
Abbreviations: APOE-ε4, Apolipoprotein E 4 allele; CI, confidence interval; GL, glycaemic load; HR, hazard ratio.
NOTE. Proportional hazard models. Model 1 was adjusted for age, sex, education level, energy intake, APOE-ε4, BMI, type 2 diabetes, hypertension, cardiovascular history, history of stroke, hypercholesterolemia, history of head trauma, depressive symptomatology, subjective health, and tobacco. Model 2 included additional adjustments for Mediterranean diet-like score and physical activity.
* HR for a 10-point GL increase per day that is equivalent to eating an additional 30 g of French baguette at each corresponding meal.
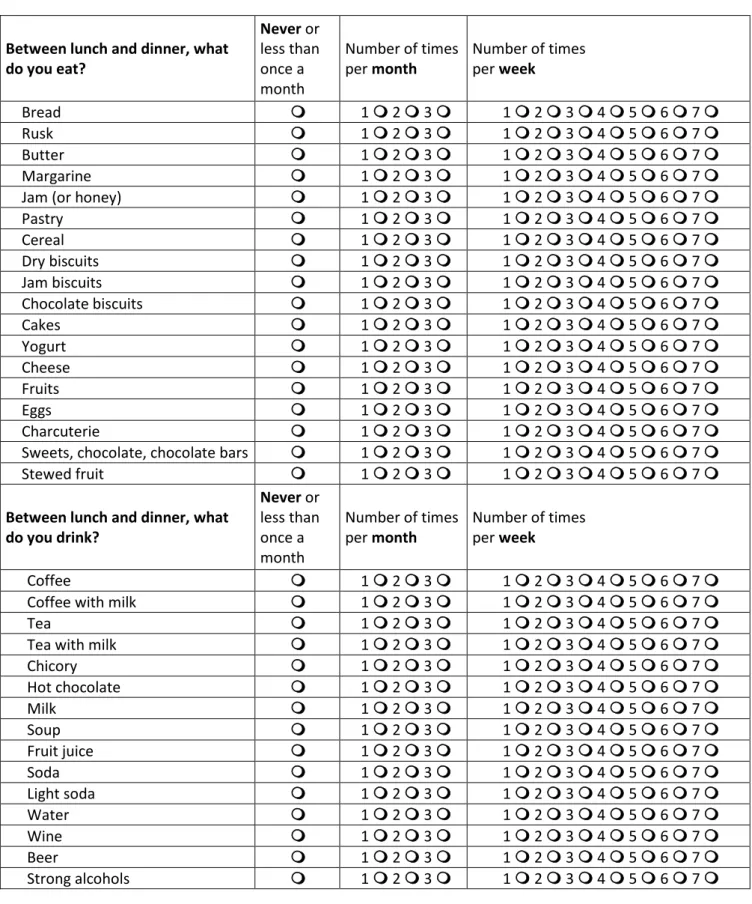
Table S1. Extract from the FFQ used at 1-FU (Bordeaux) and 2-FU (Montpellier), translated from
French version. FFQ items from the afternoon snack (between lunch and dinner) are presented.
Between lunch and dinner, what do you eat? Never or less than once a month Number of times per month Number of times per week Bread 1 2 3 1 2 3 4 5 6 7 Rusk 1 2 3 1 2 3 4 5 6 7 Butter 1 2 3 1 2 3 4 5 6 7 Margarine 1 2 3 1 2 3 4 5 6 7
Jam (or honey) 1 2 3 1 2 3 4 5 6 7
Pastry 1 2 3 1 2 3 4 5 6 7 Cereal 1 2 3 1 2 3 4 5 6 7 Dry biscuits 1 2 3 1 2 3 4 5 6 7 Jam biscuits 1 2 3 1 2 3 4 5 6 7 Chocolate biscuits 1 2 3 1 2 3 4 5 6 7 Cakes 1 2 3 1 2 3 4 5 6 7 Yogurt 1 2 3 1 2 3 4 5 6 7 Cheese 1 2 3 1 2 3 4 5 6 7 Fruits 1 2 3 1 2 3 4 5 6 7 Eggs 1 2 3 1 2 3 4 5 6 7 Charcuterie 1 2 3 1 2 3 4 5 6 7
Sweets, chocolate, chocolate bars 1 2 3 1 2 3 4 5 6 7
Stewed fruit 1 2 3 1 2 3 4 5 6 7
Between lunch and dinner, what do you drink? Never or less than once a month Number of times per month Number of times per week Coffee 1 2 3 1 2 3 4 5 6 7
Coffee with milk 1 2 3 1 2 3 4 5 6 7
Tea 1 2 3 1 2 3 4 5 6 7
Tea with milk 1 2 3 1 2 3 4 5 6 7
Chicory 1 2 3 1 2 3 4 5 6 7 Hot chocolate 1 2 3 1 2 3 4 5 6 7 Milk 1 2 3 1 2 3 4 5 6 7 Soup 1 2 3 1 2 3 4 5 6 7 Fruit juice 1 2 3 1 2 3 4 5 6 7 Soda 1 2 3 1 2 3 4 5 6 7 Light soda 1 2 3 1 2 3 4 5 6 7 Water 1 2 3 1 2 3 4 5 6 7 Wine 1 2 3 1 2 3 4 5 6 7 Beer 1 2 3 1 2 3 4 5 6 7 Strong alcohols 1 2 3 1 2 3 4 5 6 7
Table S2. Characteristics of the study population according to daily glycaemic load tercile (per day)
Characteristics Mean (SD) or n (%)
Lower (<90) Middle (90 to <115) Upper (≥115)
Montpellier centre 377 (40.7) 418 (45.2) 581 (62.6) Age (years) 75.98 (4.9) 75.52 (4.9) 76.28 (4.9) Women 600 (64.9) 542 (58.7) 554 (59.7) Education level No school Primary school High school Graduated 260 (28.1) 267 (28.9) 203 (22.0) 194 (21.0) 245 (26.5) 270 (29.2) 207 (22.4) 199 (21.5) 232 (25.0) 247 (26.6) 225 (24.3) 221 (23.8) MMSE 28 (27-29) 28 (27-29) 28 (27-29) APOE4 carriers 156 (16.9) 172 (18.6) 154 (16.6) BMI (kg/m²) 26.3 (4.2) 25.81 (4.0) 24.9 (3.4) Type 2 diabetes 129 (14.0) 84 (9.1) 68 (7.3) Hypertension 596 (64.4) 555 (60.1) 525 (56.6) Cardiovascular history 115 (12.4) 103 (11.2) 89 (9.6) Stroke 41 (4.4) 32 (3.5) 43 (4.6) Hypercholesterolemia 501 (54.2) 537 (58.1) 498 (53.7) Head trauma 54 (5.84) 53 (5.7) 69 (7.4) Depressive symptomatology* 81 (8.76) 59 (6.4) 80 (8.6)
Good subjective health 887 (95.9) 885 (95.8) 885 (95.4)
Tobacco use (current or past) 384 (41.5) 349 (37.8) 333 (35.9)
Mediterranean diet-like 4.14 (1.5) 4.75 (1.6) 5.2 (1.5)
Physical activity 256 (27.7) 295 (31.9) 343 (37.0)
Energy intake (kJ/day) 3533 (686) 4660 (652) 6355 (1464)
*evaluated with the Center for Epidemiological Studies-Depression scale. Abbreviations: APOE-ε4, apolipoprotein E 4 allele; BMI, body mass index; MMSE, Mini Mental State Examination; SD, standard deviation.
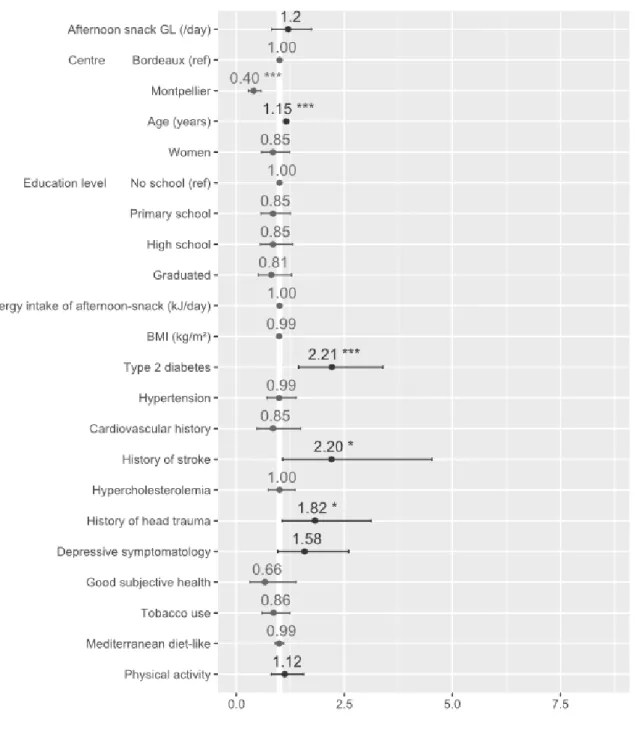
Figure S1. Stratified analysis on participants with APOE-ε4 status. Estimated hazard ratios of all
covariates from Model 2 (n = 391). The hazard ratio of the afternoon-snack GL is expressed as a
10-point increase of the GL value per day that is equivalent to eating an additional 30 g of French
baguette at each corresponding meal. Abbreviations: APOE-ε4, apolipoprotein E 4 allele; BMI, body
Figure S2. Stratified analysis on participants without APOE-ε4 status. Estimated hazard ratios of all
covariates from Model 2 (n = 1,754). The hazard ratio of the afternoon-snack GL is expressed as a
10-point increase of the GL value per day that is equivalent to eating an additional 30 g of French
baguette at each corresponding meal. Abbreviations: APOE-ε4, apolipoprotein E 4 allele; BMI, body
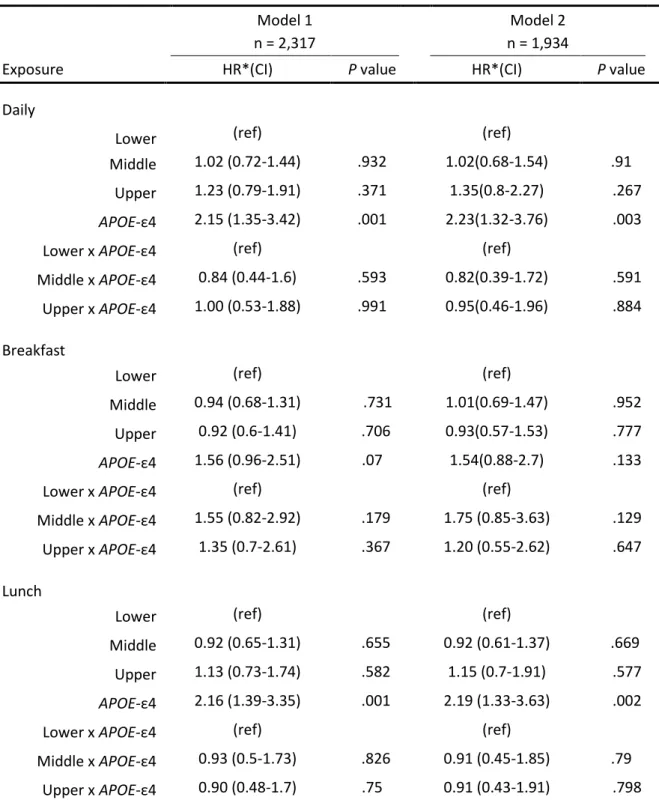
Table S3. Association between glycaemic load terciles of each meal and risk of dementia over 11.4 ±
2 years of follow-up. Daily GL terciles was GL<90, 90<GL<115 and GL≥115 per day. Breakfast GL
terciles was GL<20, 20<GL<30 and GL≥30 per day. Lunch GL terciles was GL<30, 30<GL<37 and GL≥37
per day. Afternoon-snack GL terciles was GL=0, 0<GL<10 and GL≥10 per day. Dinner GL terciles was
GL<29, 29<GL<38 and GL≥38 per day.
Model 1 n = 2,317
Model 2 n = 1,934
Exposure HR*(CI) P value HR*(CI) P value
Daily
Lower (ref) (ref)
Middle 1.02 (0.72-1.44) .932 1.02(0.68-1.54) .91
Upper 1.23 (0.79-1.91) .371 1.35(0.8-2.27) .267
APOE-ε4 2.15 (1.35-3.42) .001 2.23(1.32-3.76) .003
Lower x APOE-ε4 (ref) (ref)
Middle x APOE-ε4 0.84 (0.44-1.6) .593 0.82(0.39-1.72) .591
Upper x APOE-ε4 1.00 (0.53-1.88) .991 0.95(0.46-1.96) .884
Breakfast
Lower (ref) (ref)
Middle 0.94 (0.68-1.31) .731 1.01(0.69-1.47) .952
Upper 0.92 (0.6-1.41) .706 0.93(0.57-1.53) .777
APOE-ε4 1.56 (0.96-2.51) .07 1.54(0.88-2.7) .133
Lower x APOE-ε4 (ref) (ref)
Middle x APOE-ε4 1.55 (0.82-2.92) .179 1.75 (0.85-3.63) .129
Upper x APOE-ε4 1.35 (0.7-2.61) .367 1.20 (0.55-2.62) .647
Lunch
Lower (ref) (ref)
Middle 0.92 (0.65-1.31) .655 0.92 (0.61-1.37) .669
Upper 1.13 (0.73-1.74) .582 1.15 (0.7-1.91) .577
APOE-ε4 2.16 (1.39-3.35) .001 2.19 (1.33-3.63) .002
Lower x APOE-ε4 (ref) (ref)
Middle x APOE-ε4 0.93 (0.5-1.73) .826 0.91 (0.45-1.85) .79
Afternoon snack
Lower (ref) (ref)
Middle 1.06 (0.76-1.46) .745 1.06 (0.73-1.52) .773
Upper 0.99 (0.63-1.58) .978 0.96 (0.57-1.63) .881
APOE-ε4 1.42 (0.89-2.25) .141 1.16 (0.67-2.01) .598
Lower x APOE-ε4 (ref) (ref)
Middle x APOE-ε4 1.27 (0.65-2.46) .481 1.73 (0.8-3.74) .162
Upper x APOE-ε4 2.25 (1.21-4.18) .01 3.26(1.57-6.79) .002
Dinner
Lower (ref) (ref)
Middle 0.95 (0.67-1.35) .763 1.13 (0.75-1.69) .568
Upper 0.82 (0.51-1.32) .42 0.89 (0.51-1.55) .67
APOE-ε4 2.69 (1.75-4.12) <.0001 2.77 (1.65-4.64) <.0001
Lower x APOE-ε4 (ref) (ref)
Middle x APOE-ε4 0.64 (0.33-1.21) .167 0.59 (0.28-1.25) .166
Figure S3. Kaplan-Meier survival curves according to afternoon-snack GL terciles and APOE-ε4
carriers status. Time to diagnosis of dementia for APOE-ε4 carriers participants (solid line) or
non-APOE-ε4 carriers participants (dashed line) with GL=0 (light grey), 0<GL<10 (dark grey) or GL≥10 per day (black). Abbreviations: APOE-ε4, apolipoprotein E 4 allele; GL, glycaemic load.
Table S4. Association between glycaemic load and risk of dementia during 11.4 ± 2 years without
participants with type 2 diabetes.
Model 1 n = 2,317
Model 2 n = 1,934
Exposure HR*(CI) P value HR*(CI) P value
Daily GL 0.99 (0.90-1.09) .84 0.99 (0.89-1.10) .83 APOE-ε4 1.03 (0.37-2.91) .95 0.89 (0.26-3.03) .85 GL x APOE-ε4 1.07 (0.98-1.16) .15 1.08 (0.97-1.19) .17 Breakfast GL 1.01 (0.84-1.22) .93 1.01 (0.81-1.25) .95 APOE-ε4 1.46 (0.74-2.87) .27 1.55 (0.70-3.42) .28 GL x APOE-ε4 1.15 (0.92-1.44) .22 1.1 (0.85-1.44) .46 Lunch GL 0.80 (0.62-1.04) .091 0.81 (0.60-1.10) .17 APOE-ε4 2.29 (0.84-6.23) .11 3.21 (0.97-10.6) .056 CG x APOE-ε4 0.98 (0.74-1.30) .88 0.87 (0.61-1.23) .43 Afternoon snack GL 1.15 (0.86-1.54) .35 1.19 (0.84-1.69) .33 APOE-ε4 1.58(1.09-2.29) .016 1.43(0.92-2.21) .113 GL x APOE-ε4 1.38 (1.01-1.75) .008 1.47 (1.11-1.93) .007 Dinner GL 0.94 (0.75-1.19) .62 0.96 (0.73-1.26) .78 APOE-ε4 2.74 (1.17-6.40) .02 2.29 (0.78-6.78) .13 GL x APOE-ε4 0.93 (0.73-1.17) .53 0.96 (0.71-1.29) .80
Abbreviations: APOE-ε4, Apolipoprotein E 4 allele; CI, confidence interval; GL, glycaemic load; HR, hazard ratio. NOTE. Proportional hazard models. Model 1 was adjusted for inclusion centre, age, sex, education level, energy intake,
APOE-ε4, BMI, hypertension, cardiovascular history, history of stroke, hypercholesterolemia, history of head trauma,
depressive symptomatology, subjective health, and tobacco. Model 2 included additional adjustments for Mediterranean diet-like score and physical activity.
* HR for a 10-point GL increase per day that is equivalent to eating an additional 30 g of French baguette at each corresponding meal.
Table S5. Association between glycaemic load and risk of Alzheimer’s disease (exclusion of
participants with mixed dementia and vascular dementia) during 11.4 ± 2 years of follow-up.
Model 1 n = 2,489
Model 2 n = 2,078
Exposure HR*(CI) P value HR*(CI) P value
Daily GL 1.02 (0.92-1.12) .73 1.06 (0.94-1.19) .33 APOE-ε4 0.86 (0.29-2.56) .79 0.89 (0.25-3.18) .86 GL x APOE-ε4 1.09 (0.99-1.19) .072 1.08 (0.97-1.20) .16 Breakfast GL 0.99 (0.80-1.21) .89 1.03 (0.81-1.30) .82 APOE-ε4 1.26 (0.62-2.56) .52 1.59 (0.70-3.62) .27 GL x APOE-ε4 1.24 (0.98-1.56) .075 1.12 (0.85-1.47) .43 Lunch GL 0.96 (0.73-1.27) .78 1.07 (0.77-1.49) .69 APOE-ε4 2.02 (0.69-5.87) .20 2.68 (0.74-9.63) .13 CG x APOE-ε4 1.03 (0.76-1.39) .85 0.94 (0.65-1.35) .72 Afternoon snack GL 1.30 (0.95-1.76) .10 1.41 (0.97-2.04) .07 APOE-ε4 1.72 (1.16-2.54) .007 1.60 (1.01-2.52) .043 GL x APOE-ε4 1.32 (1.04-1.68) .03 1.39 (1.05-1.84) .02 Dinner GL 0.91 (0.71-1.17) .45 0.99 (0.73-1.34) .95 APOE-ε4 2.88 (1.17-7.10) .02 2.97 (0.98-9.00) .054 GL x APOE-ε4 0.93 (0.72-1.19) .56 0.91 (0.67-1.24) .54
Abbreviations: APOE-ε4, Apolipoprotein E 4 allele; CI, confidence interval; GL, glycaemic load; HR, hazard ratio. NOTE. Proportional hazard models. Model 1 was adjusted for inclusion centre, age, sex, education level, energy intake,
APOE-ε4, BMI, type 2 diabetes, hypertension, cardiovascular history, history of stroke, hypercholesterolemia, history of
head trauma, depressive symptomatology, subjective health, and tobacco. Model 2 included additional adjustments for Mediterranean diet-like score and physical activity.
* HR for a 10-point GL increase per day that is equivalent to eating an additional 30 g of French baguette at each corresponding meal.
Table S6. Number of servings per week for each meal.
Food groups Breakfast Lunch Afternoon snack Dinner
Mean (standard deviation)
Cereals, bread 6.2 (3.04) 6.1 (3.04) 0.4 (1.45) 5.6 (2.62)
Starchy foods 4.2 (2.32) 2.6 (2.55)
Meat, poultry 4.5 (3.84) 1.7 (1.88)
Fish and seafood 2.2 (3.05) 0.9 (1.23)
Eggs, charcuterie 0.2 (1.12) 1.6 (3.28) 0.04 (0.39) 1.9 (1.79) Vegetables, legumes 7.6 (1.12) 3.5 (3.21) Fruits 1.0 (2.32) 5.1 (3.24) 0.7 (1.76) 4.0 (2.95) Biscuits, cakes 4.2 (3.84) 1.0 (3.04) 1.5 (2.69) 1.3 (1.94) Sweets, chocolate, sweetened-beverages 1.8 (3.05) 0.3 (2.32) 1.2 (2.43) 0.2 (0.86) Dairy products 1.8 (3.28) 6.3 (3.84) 0.5 (1.55) 7.3 (3.76) Coffee, tea 5.3 (3.24) 4.1 (3.05) 1.6 (2.71) 0.4 (1.60)
Figure S4. Servings per week of the FFQ items according to their glycaemic load values: no GL value
(e.g., meat, fish, fat) and GL values. Abbreviations: FFQ, Food Frequency Questionnaire; GL,