APOCENTER GLOW IN ECCENTRIC DEBRIS
DISKS: IMPLICATIONS FOR FOMALHAUT AND
The MIT Faculty has made this article openly available.
Please share
how this access benefits you. Your story matters.
Citation
Pan, Margaret; Nesvold, Erika R. and Kuchner, Marc J. “APOCENTER
GLOW IN ECCENTRIC DEBRIS DISKS: IMPLICATIONS FOR
FOMALHAUT AND # ERIDANI.” The Astrophysical Journal 832, no. 1
(November 2016): 81 © 2016 The American Astronomical Society
As Published
http://dx.doi.org/10.3847/0004-637x/832/1/81
Publisher
IOP Publishing
Version
Final published version
Citable link
http://hdl.handle.net/1721.1/109817
Terms of Use
Article is made available in accordance with the publisher's
policy and may be subject to US copyright law. Please refer to the
publisher's site for terms of use.
APOCENTER GLOW IN ECCENTRIC DEBRIS DISKS: IMPLICATIONS FOR FOMALHAUT AND
ò ERIDANI
Margaret Pan1,2,3, Erika R. Nesvold4,5, and Marc J. Kuchner31
MIT Department of Earth, Atmospheric, and Planetary Sciences, Cambridge, MA 02139, USA
2
Department of Astronomy and Astrophysics, University of Toronto, Toronto, Ontario M5S3H4, Canada
3
NASA Goddard Space Flight Center, Exoplanets and Stellar Astrophysics Laboratory, Greenbelt, MD 20771, USA
4
Department of Applied Physics, University of Maryland Baltimore County, Baltimore, MD 21250, USA
5
Department of Terrestrial Magnetism, Carnegie Institution of Washington, Washington, DC 20015, USA Received 2016 February 2; revised 2016 September 15; accepted 2016 September 15; published 2016 November 18
ABSTRACT
Debris disks often take the form of eccentric rings with azimuthal asymmetries in surface brightness. Such disks are often described as showing “pericenter glow,” an enhancement of the disk brightness in regions nearest the central star. At long wavelengths, however, the disk apocenters should appear brighter than their pericenters: in the long-wavelength limit, wefind that the apocenter/pericenter flux ratio scales as + e1 for disk eccentricity e. We produce new models of this “apocenter glow” to explore its causes and wavelength dependence and study its potential as a probe of dust grain properties. Based on our models, we argue that several far-infrared and(sub) millimeter images of the Fomalhaut andòEridani debris rings obtained with Herschel, JCMT, SHARC II, ALMA, and ATCA should be reinterpreted as suggestions or examples of apocenter glow. This reinterpretation yields new constraints on the disks’ dust grain properties and size distributions.
Key words: planetary systems – planets and satellites: dynamical evolution and stability – protoplanetary disks
1. INTRODUCTION
More and more high-resolution images show that debris disks often take the form of rings, sometimes narrow, sometimes eccentric. Well-resolved examples include HR4796 (Schneider et al. 2009; Thalmann et al. 2011; Lagrange et al. 2012), Fomalhaut (Stapelfeldt et al. 2004; Kalas et al. 2005), HD 181327 (Schneider et al. 2006),
z2 Reticuli(Eiroa et al.2010), HD 202628 (Krist et al.2012), and HD 115600(Currie et al.2015). These rings may indicate
the presence of hidden planets, which can clear the central cavities in the rings and also excite the ring eccentricities via secular perturbations (Roques et al. 1994; Wyatt et al. 1999; Kuchner & Holman 2003; Quillen 2006; Chiang et al. 2009; Rodigas et al.2014; Nesvold & Kuchner2015).
At shorter wavelengths, regions of an eccentric disk near pericenter appear brighter because they receive moreflux from the host star. Wyatt et al. (1999) named this phenomenon
“pericenter glow” and developed a model for an eccentric debris ring interacting with a single planetary perturber. Their model disk consists of massless particles whose eccentricities differ only in the direction of the free eccentricity. The resulting ring suffices to explain the offset in the solar zodiacal cloud from the Sun and to fit observations of several debris disks, yielding constraints on the disks’ forced eccentricity and the masses of the hidden planetary perturbers.
However, variations in the disk surface density also affect its apparent brightness, and in a steady-state disk the density should peak at apocenter simply because typical orbit velocities are slowest there. Though modeling done by Wyatt et al. (1999) predicted a brightness enhancement at pericenter for HR
4796 at 18.2μm, their disk model showed a 2% density enhancement at apocenter. Analogous apocentric density enhancements occur in more recent dynamical models of eccentric planets interacting with disks (see, for example, Nesvold et al. 2013; Pearce & Wyatt 2014). Indeed,
submillimeter observations of the very well-observed eccentric Fomalhaut disk consistently suggest apocentric brightness
enhancements. JCMT images of Fomalhaut by Holland et al. (2003) show slight enhancements of the flux near apocenter;
these enhancements are less than the quoted uncertainty in the photometry, but they appear in both 450 and 850μm bands. When Marsh et al. (2005) imaged the Fomalhaut disk at
350μm using the SHARC II (Submillimeter High Angular Resolution Camera II) at the Caltech Submillimeter Observa-tory, they found that the ring has an apocentric enhancement of approximately 14% in integrated column density. More recently, Ricci et al. (2012) imaged Fomalhaut’s disk at
7 mm with the ATCA and noted that the lobe of the disk near apocenter “...appears to be more extended, showing two possible asymmetric structures toward east and south.” The highest resolution ALMA images of Fomalhaut by Boley et al. (2012) at 350GHz (1 mm) also show enhanced flux near
apocenter in the maps corrected for the single-dish beam. Here we describe a new model for debris rings that illustrates the wavelength dependence in the apocenter/pericenter flux ratio due to the competing effects of azimuthal asymmetries in dust density and stellar illumination. Our primary interest here is mid-infrared and longer wavelengths, so we focus on dust particles and planetesimals large enough to avoid radiation pressure effects and consider only absorbed and reradiated, rather than scattered, emission. In Section 2, we begin by describing a semi-analytic model for estimating the surface density of a steady-state distribution of collisionless planetesimals and show that the density of a dust ring varies with longitude and peaks at apocenter. In Section3, we verify this result for a collisional ring using SMACK (Nesvold et al. 2013), a numerical model of debris disk evolution that
incorporates both collisions and dynamics in 3D. Finally, in Section4, we combine a simple dust reradiation model with our models of surface density to simulate the brightness of the Fomalhaut andò Eridani rings, and demonstrate that the ratio between pericenter and apocenterflux varies with wavelength. We summarize our results and discuss the implications for future observations of eccentric rings in Section5.
2. SEMI-ANALYTIC MODEL
The surface brightness of an optically thin debris disk depends on the underlying spatial distribution of the dust as well as on the dust particles’ absorption, reradiation, and scattering properties. In this section, we use basic orbit geometry and a simple Monte Carlo simulation to estimate the surface density of aneccentric ring of collisionless particles and its dependence on longitude from pericenter.
2.1. Disk Density Calculations
Wefirst estimate the linear number density, ℓ, of an eccentric ring of particles as a function of longitude, f, in the ring. ℓ f( ) is the most relevant quantity for the many images of disks that are unresolved in the radial direction. We assume that the particles form an annulus about the star, and that their eccentricity, inclination, and semimajor axis distributions are centered, respectively, on values e, 0, a and have widths of D <e e1, DiDe, Da a eD . Because we are considering a ring that appears eccentric overall and has a fractional radial width no larger than De, we must constrain the longitude of pericenterϖ to a distribution centered on v = 0 with width
v
D 1-e2 De e. ( )1 Also, we assume the particles’ orbital phases and longitudes of the ascending node are distributed uniformly.
For a single particle in a stable elliptical orbit given by
= -+ r a e e f 1 1 cos , 2 2 ( ) ( )
the time-averaged linear number density along the orbit is inversely proportional to the local Keplerian velocity:
µ
ℓsingle( )f 1 v f( ), where v( f ) is given by
⎛ ⎝ ⎜ ⎞ ⎠ ⎟ ⎛ ⎝ ⎜ ⎛⎝⎜ ⎞⎠⎟⎞ ⎠ ⎟ * * = + + -+ + -= v f GM a e f e e v e f e f v GM a 1 2 cos 1 1 cos 1 cos 8 . 3 2 2 1 2 0 2 2 0 ( ) ( ) Here v0is simply the orbital velocity of a circular orbit with the
same a. We consider only mildly eccentric disks ( e 1), so to lowest order in e the linear number density in the disk scales as
µ µ -ℓ f v f e f 1 1 cos . 4 single( ) ( ) ( )
In short, because particles orbit faster at pericenter and slower at apocenter, their number density decreases at pericenter and increases at apocenter by the same fractional amount e. Marsh et al. (2005) also calculated ℓ f( ) by a somewhat different method and found a similar enhancement at apocenter.
In a disk of such particles, the overall linear density ℓ f( ) is the sum of all the individual densitiesℓsingle(f-v). For a disk
with particle orbit elements within the ranges given above, the linear density dependence on f should remain close to that of
ℓsingle( ), that is,f
µ -~
ℓ f( ) 1 ecos ,f ( )5
with slight variations due to the finite widths of the distributions of orbit elements.
2.2. Monte Carlo Simulations
To check our scaling argument above, we performed each Monte Carlo disk simulation by randomly drawing 5 ´104 disk particle orbits from orbit element distributions as follows. The semimajor axes, eccentricities, longitudes of pericenter, and inclinations were drawn from Gaussian distributions with center values and widths(σ) given by
1. typical eccentricity e and eccentricity width De chosen for each disk;
2. typical semimajor axis a=1 and semimajor axis width D = Da e;
3. typical longitude of pericenter v = 0 and corresponding widthDv given by Equation (1);
4. typical inclination i=0 and inclination width D = Di e. The particles’ longitudes of the ascending node and mean anomalies were chosen from uniform distribu-tions over[0, 2p).
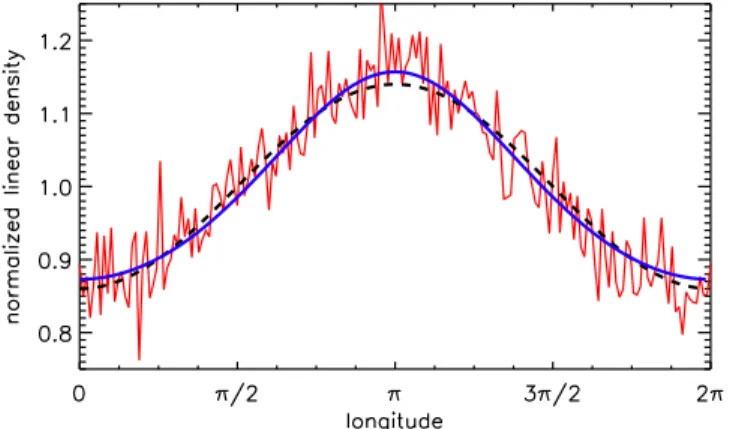
We then measured the linear density as a function of longitude for each simulation, an example of which is shown in Figure1. As expected,ℓ varies nearly sinusoidally with f with amplitude about equal to the eccentricity.
In the above calculations we neglected short-term density variations. In particular, we ignored azimuthal variations in dust production caused by differences in the frequency and severity of collisions between larger planetesimals induced, for example, by perturbations from planets orbiting in the system (see, for example, Nesvold & Kuchner2015). These should be
unimportant in our work here on gravitationally bound particles in a steady-state disk, since any effects of azimuthal variations in their production rate should smear out within an orbit
Figure 1. Linear number density ℓ as a function of longitude f in our simulated debris disks. SMACK model data is the thin red line; MC model data is the solid blue line; the1- ecosf we predict analytically is the dashed black line. The median eccentricity of the SMACK model disk is e=0.14 and its eccentricity width is D =e 0.07; the samee and De were used in the MC model disk shown here. Both sets of model data were normalized to their respective mean values. e=0.14 was also used for the1- ecosf curve. While the MC model appears to be a very slightly better match to the SMACK model data than the cosine curve—the root mean square deviation between the SMACK and MC models is about 2% smaller than that between the SMACK model and the cosine—all three agree well overall. Note that no fitting was performed; the normalized model data are simply overplotted along with the cosine.
period.6In the next section, we describe a numerical test of this effect.
3. NUMERICAL MODEL WITH SMACK
The semi-analytic model described in Section2assumes that the given ranges of orbit elements accurately represent a steady-state disk. To test these assumptions and the results of the semi-analytic model, we simulated the collisional and dynamical evolution of the planetesimals using SMACK (Nesvold et al. 2013). SMACK uses an N-body integrator to
track the orbits of superparticles, clouds of parent bodies with a range of sizes. When two superparticles collide, SMACK updates the superparticles’ trajectories and size distributions to account statistically for collisions between their planetesimals and tracks the mass of dust (<1 mm in size) produced in the collision.
We modeled the evolution of a ring of planetesimals in orbit around a solar-mass star. The planetesimals were represented by 10,000 superparticles of uniform size whose orbital elements were initially uniformly distributed with the ranges in Table1. Each superparticle represented a size distribution of planetesimals with range and slope given in Table1. We set the initial vertical optical depth of the ring to 10−4. While the semi-analytic model includes the eccentric ring alone, in order to induce and maintain an eccentricity in the SMACK model, we added a 3 MJupiter planet to the system at a semimajor axis
of50 au with eccentricity 0.1, then evolved the system for 107years.
A snapshot of the simulation at this point shows that most of the superparticle eccentricities are distributed in a single roughly symmetric peak with half-width D e 0.07, while perhaps 10% form a tail extending to larger eccentricities (0.3 to 0.5). The peak eccentricity value is about 0.12, the median is about 0.14, and the mean is about 0.15. This distribution is broadly similar to our semi-analytic model assumptions except in that D e e rather than D e e. The
corresponding normalized disk linear density is shown in Figure1and is roughly sinusoidal with a peak at apocenter and amplitude about equal to the median eccentricity. Again, this is broadly consistent with our semi-analytic and MC model predictions. As we would expect, the inclusion of collisions in the SMACK model does not strongly affect the normalized linear density. By definition, the eccentric disk has some
steady-state finite eccentricity e that persists regardless of the collisions; the Keplerian orbit shape required by this e sets the linear density variation with longitude. Also, because the optical depth is much less than unity, any non-uniformity in dust production spreads around the disk much faster than dust can accumulate at a given longitude.
4. DUST RERADIATION MODEL
We have used semi-analytic and SMACK modeling to simulate the density of the dust ring produced by an eccentric parent body ring and showed that the orbital geometry of the dust produces a peak in surface density at apocenter. The observed flux from the dust is therefore subject to two competing effects: this higher number density at apocenter and the higher temperature at pericenter discussed in detail by Wyatt et al. (1999). We now combine our semi-analytic and
SMACK results with a simple radiative equilibrium model for dust emission to study the disk emission as a function of longitude at different wavelengths. We apply this surface brightness model to two well-observed disks: Fomalhaut and ò Eridani.
4.1. Dust Model Framework
We assume a passively heated disk containing dust of sizes
s
{ } with size distributiondN dsµs-q. We assume the disk is
optically thin so that the thermal equilibrium condition for each grain is *
ò
l l pò
p = l l p s d A s L s r d A s s T s f , 4 , 4 , 6 2 2 2 SB 4 ( ) ( ) ( ) ( )wherer=a(1-e2) (1+ecosf) is the orbital radius, T is
the dust’s effective temperature, and the absorptivityA s,( l) is 1 when s>l and scales as (s l) otherwise. We solve thisb iteratively for sizes s over a grid of wavelengths λ including the star’s blackbody peak and sum over the sizes s, with weights assigned according to dN/ds, to find the flux at each of the desired wavelengths.
4.2. Fomalhaut
Because it is so well-observed at wavelengths from UV to millimeter-wave radio, the Fomalhaut disk(eccentricity ∼0.1, Kalas et al.2005) provides an excellent test for our models. As
discussed in Section1, previous works have consistently found that Fomalhaut exhibits pericenter glow—i.e., is brightest at its southeast limb—at wavelengths shorter than about 250 μm (see, for example, Kalas et al. 2005; Acke et al. 2012, and references therein). However, observations at longer submilli-meter wavelengths consistently suggest that the northwest limb appears brighter than would be expected in a uniform ring (Holland et al.2003; Marsh et al.2005; Boley et al.2012).
We applied our dust reradiation model to the Fomalhaut system using stellar temperature * =T 8590 K, stellar radius
* = ´
R 1.28 1011cm, disk semimajor axis a=133 au, radial width∼20 au, and eccentricity 0.1. To approximate the results of our semi-analytic model, we vary the linear mass density of the disk sinusoidally with longitude with amplitude 0.1 (simulating a disk with eccentricity ∼0.1). We explored a grid of absorptivity laws1.0b2.0 and dust size distributions
q
3 4 to predict the apocenter/pericenter glow from visual to millimeter wavelengths. Figure 2 shows some
Table 1
Initial Conditions for the SMACK Model
Parameter Initial Disk Values
Semimajor axis(a) 50–100 au
Eccentricity(e) 0.0–0.2
Inclination(i) 0.0–0.1
Longitude of ascending node(Ω) 0– p2
Argument of pericenter(ω) 0– p2
Mean anomaly 0– p2
Size distribution index(q) −3.5
Planetesimal sizes 1 mm–10 cm
Optical depth 10−4
Number of superparticles 104
6
While azimuthal variations in production rate might indeed affect the steady-state distribution of unbound dust small enough to be affected by radiation pressure, we leave studies on their behavior to future work.
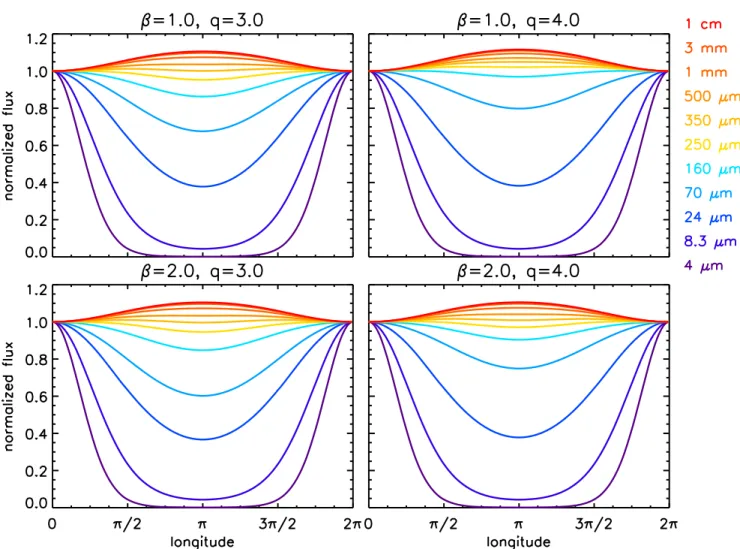
examples of our results. Each panel shows the flux as a function of longitude, integrated over the radial width of the disk and normalized to pericenter, for 12 different wavelengths shown as different-colored curves. At the longer wavelengths, the simulated ring exhibits apocenter glow rather than pericenter glow. The location of the peak in flux shifts from apocenter (longitude=π) to pericenter (longitude=0) with decreasing wavelength. The shortest wavelength to show apocenter glow in Figure 2is typically 160 or 70μm.
We show a summary view of the apocenter/pericenter flux contrast in Figure 3, which displays the range of apocenter/ pericenterflux ratios occurring across our grid of models as a function of wavelength. Again, the modeled fluxes were integrated over the radial width of the disk, since azimuthal width variations are not well resolved in the images. Here, models exhibiting pericenter glow lie below the black dotted line while models with apocenter glow lie above it. At short wavelengths, all of our models exhibit pericenter glow, while at long wavelengths, they all exhibit apocenter glow. This illustrates the competition between higher temperatures at pericenter discussed in detail by Wyatt et al.(1999), which for
Fomalhaut affect smaller particles more strongly and dominate in the shorter-wavelength emission, and the higher densities at apocenter, whose signature emerges strongly in the
long-wavelength emission. Far-infrared and submillimeter observa-tions of Fomalhaut appear broadly consistent with the range of apocenter/pericenter flux ratios our models predict, though flux ratio values based on ALMA and ATCA observations long-ward of 350μm are currently not precise enough to include in Figure3.
A sufficiently large beam can dilute the effect of apocenter glow or blur it with background galaxies or other disk features like clumps, or even disk ansae, which themselves can be limb-brightened if the disk is not face-on. For example, in their discussion of pericenter glow in the Keck image of HR4796 from Telesco et al. (2000), Wyatt et al. (1999) calculate the
effects of beam size and study the disappearance of disk asymmetry as pericenter/apocenter moves away from the disk ansae. Because the beam size in the Fomalhaut images is much smaller relative to the disk size than in the Telesco et al.(2000)
HR 4796 observations, we believe these dilution/confusion effects are less important for the Fomalhaut data of Acke et al. (2012) and Marsh et al. (2005).7 Indeed, both sets of disk images appear ring-shaped rather than dumbbell-shaped/
Figure 2. Examples of results of our dust reradiation simulations of the Fomalhaut disk. Each panel shows the radially integrated disk flux as a function of longitude, normalized to pericenter, for 12 different wavelengths, shown as different-colored curves. The top row shows results for absorptivityµ s( l) and the bottom row1
corresponds to(s l) . The left and right columns show results for q=3 and q=4, respectively. These represent the extremes of the λ–q grid we explored in our dust2
reradiation simulations. Shorter wavelengths demonstrate pericenter glow, but longer wavelengths exhibit apocenter glow instead. Note the qualitative variation from apocenter to pericenter in the 160μm flux (light blue curve) across the panels.
7
We refer here to the deconvolved image of Marsh et al. (2005); the deconvolution method uses knowledge of the PSF to extract extra resolution information from strongly overlapped individualfields of view.
double-lobed as in the earlier HR 4796 images. Also, for Fomalhaut Acke et al. (2012) measure the disk major axis to
coincide within 1° with the line of nodes in the sky plane, so it is highly unlikely that pericenter orientation masks the pericenter/apocenter flux ratio.
In these relatively well-resolved images,we believe we can reasonably estimate the uncertainty in the flux ratio due to beam size by convolving a one-dimensional Gaussian of width equal to the beam radius with a cosine representing the sinusoidal flux variation with longitude and quoting the difference in the pre- and post-convolution amplitudes. In order to compensate here for the apparent increase influx at the disk ansae due to Fomalhaut’s 66° inclination, we convolve the cosine with a one-dimensional Gaussian of width equal to the beam radius divided by cos 66 . For the Herschel data this gives an extra flux uncertainty of ∼5% of the difference between the pericenter and apocenter fluxes at 70 μm and ∼13% of this difference at 160 μm, smaller than the size of the plot symbols. Marsh et al. (2005) incorporated
beam/orienta-tion effects in their data analysis,so we infer they are included in the quoted uncertainties.8
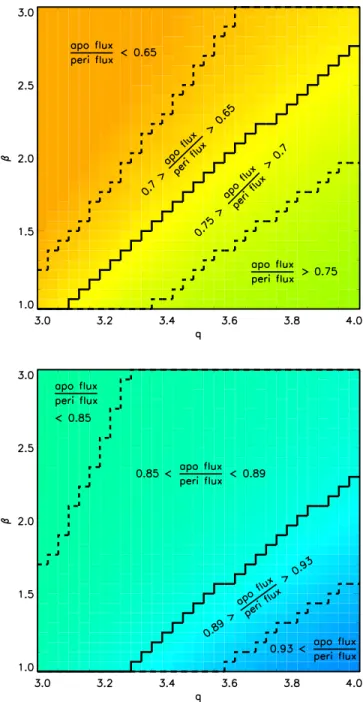
Precisely where the observed flux ratios fall among our models can be a revealing diagnostic of disk properties. Figure4shows the pericenter to apocenterflux ratio at 70 and at 160μm for our Fomalhaut models as a function of β and q.
A Herschel image of the Fomalhaut disk at 70 μm shows pericenter glow with an apocenter/pericenter flux ratio of about 0.7(Acke et al.2012). This value corresponds approximately to
the line b1.9q-3.2. At 160μm, the Fomalhaut ring also shows pericenter glow (Acke et al. 2012), but the derived
apocenter/pericenter flux ratio is about 0.89, corresponding approximately to the lineb1.8q -4.7.
Observations of Fomalhaut at 7 mm by Ricci et al. (2012)
provide an additional constraint:q =3.480.14. Combining these constraints with ourfindings above from the Herschel70 and 160μm data and our models yields the range b 1.4 to 1.7, somewhat higher than the b =1.1 obtained by Dent et al.
Figure 3. Apocenter to pericenter flux ratios (ratio of the radially integrated diskflux at apocenter to that at pericenter) as a function of wavelength for our grid of Fomalhaut dust reradiation models. The red solid curve follows the maximum flux ratio values, which consistently occur at q=4, b = 1; the purple dashed/dotted curves follow the flux ratios occurring at q=3 and b = 2 (dashed) or b = 3 (dotted). The q=3, b = 3 flux ratios are the minimum attained on our parameter grid: extending our upper bound onβ from twoto threemakes little difference in the overall range of model flux ratios. Blue points correspond to measuredflux ratios from Herschel data at 70 and 160μm (Acke et al.2012) and from CSO/SHARC II data at 350 μm (Marsh et al. 2005). The observed results show broad agreement with our dust reradiation model output. Uncertainties on the Acke et al.(2012) points are smaller than the plot symbols.
Figure 4. Fractional amplitudes (referenced to the pericenter flux) of the 70 μm (top) and 160 μm (bottom) fluxes in our grid of Fomalhaut dust reradiation models. All values in our parameter range produce pericenter glow at these wavelengths. The solid contours correspond to apocenter/pericenter flux ratios of 0.7(top) and 0.89 (bottom), the values extracted from Herschel observations by Acke et al.(2012). The dashed contours mark nearby values of the flux ratio and give an idea of how the ratio changes as a function of the size distribution slope q and the absorptivity slope β.
8
For the deconvolved SHARC II image our one-dimensional estimation method gives an uncertainty of ∼3%, which is comparable to that of Marsh et al.(2005). Nonetheless, in our modeling and analysis we simply adopt the result and uncertainty reported by Marsh et al.(2005); we assume their analysis correctly accounted for any effects the deconvolution may have had on the relativeflux, as necessary.
(2000) in their Fomalhaut model. Large values of β often point
to a lack of larger, millimeter-sized grains in the grain distribution. For example, in the outer regions of TTauri disks, where grain growth has not yet occurred,β is often in the range of 1.7–2 (Pérez et al.2012). The millimeter dust opacity
slope for the ISM yields b »1.7 (Li & Draine 2001).
However, the Fomalhaut system is too old for lack of grain growth to be likely. Explaining the Fomalhaut disk’s strong pericenter glow may require additional physics not included in our models, for example radiation from unbound grains or planet–disk interactions more complex than those we con-sidered (e.g., resonant dynamics). Indeed, Acke et al. (2012)
find that unbound grains contribute about a quarter of the non-stellarflux in their 70 μm Fomalhaut system simulations.
Finally, 350μm observations by Marsh et al. (2005) using
SHARC II at the CSO indicate somewhat stronger apocenter glow than our models predict. Either a very steep size distribution ( >q 4), a very shallow absorptivity law (b < 1)
or, perhaps least unlikely, a larger eccentricity e>0.1 is required in our models to reproduce the Marsh et al. (2005)
result. In fact,Acke et al. (2012) measure e=0.125 and
e=0.17, respectively, from their 70 and 160 μm images.
4.3. ò Eridani
Resolved images of theò Eridani cold dust disk ( a 61 au Greaves et al. 2014) were recently obtained at several
submillimeter/millimeter wavelengths with Herschel, SCUBA, and MAMBO (Greaves et al.2014; Lestrade & Thilliez 2015).
These images also display azimuthal asymmetry, providing an independent constraint on our models. Because òEridani (K2V, T* 5084 K, R*5.12´1010cm, Kovtyukh et al. 2003) is much cooler than Fomalhaut, none
of its associated dust is subject to radiation pressure or stellar wind blowout (Reidemeister et al. 2011). Small grains may
potentially provide much of the disk’s surface area. Following Reidemeister et al.(2011), we included grains down to 0.1 μm
in our models ofòEridani . As with Fomalhaut, we produced a grid of models with 3 q 4 and 1b3. For òEridani, we also examined a range of disk eccentricities
e
0.02 0.25, allowing the amplitude of the surface density variation with longitude to scale linearly with eccentricity, as demonstrated in our semi-analytic model.
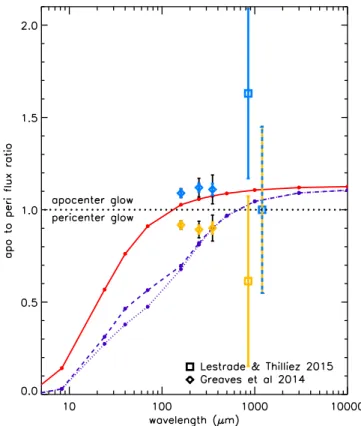
Figure 5 shows our modeling results of òEridani with e=0.1, the disk eccentricity favored by Greaves et al. (2014),
plotted together with the observed south to northflux ratios. As these fluxes were reported in a variety of formats in the discovery papers, we converted them as follows. Greaves et al. (2014) report that their 160, 250, and 350 μm flux ratios differ
from unity by 3.0, 3.7, and 2.5 times the spread measured in a 9 pixel grid around each point. Assuming a roughly Gaussian distribution of pixelfluxes, the spread among 9 pixels would be ;2σ,where σ is the Gaussian width parameter. We produced our plotted uncertainties by assigning an uncertainty of tos the north and the southfluxes and propagating errors. Although òEridani is nearly face-on, with an inclination of ∼26°, we estimate using the convolution method described in Section4.2
that the large Herschel beam size relative to the disk size adds uncertainties of 27%, 42%, and 71% of the pericenter-apocenter flux difference for 250, 350, and 500 μm, respec-tively. Lestrade & Thilliez(2015) report in their Figure5 the 850 and 1200μm fluxes as a function of azimuth. For each wavelength, we took the fivepoints closest to due north and
due south, averaged them to get the north and southfluxes, and took the larger of the spread in the points or the uncertainties plotted by Lestrade & Thilliez(2015) as the overall uncertainty
in the north/south fluxes. We then propagated errors to get the uncertainties plotted in Figure 5. These overwhelm the flux uncertainties due to beam size.
Because the òEridani disk has no independent pericenter direction determination, theflux asymmetry may be interpreted as either pericenter or apocenter glow. A pericenter glow interpretation of the Herschel 160, 250, and 350 μm observa-tions is consistent with the range of flux ratios given by our models as long ase0.02. However, plots analogous to those in Figure4 indicate that with a pericenter glow interpretation, the 160μm data consistently favors large q (a steep size distribution) and small β (a shallower absorptivity law), while the 350μm favors the opposite end of our parameter range, small q and larger β. By contrast, an apocenter glow interpretation of the Herschel measurement is compatible with our models only ife0.2. In this case, all three Herschel flux
ratios are consistent with a steep size distribution(large q) and a shallower absorptivity law (small β). While our models consistently predict apocenter glow only longwardof 850 μm, the precision of the flux ratios gleaned from the Lestrade &
Figure 5. Same as Figure 3, but for the outer disk of ò Eridani (K2V, * =
T 5084 K, a = 61 au; Kovtyukh et al.2003; Greaves et al.2014). The dust reradiation models represented here use the disk eccentricity favored by Greaves et al.(2014), e=0.1. Plotted points correspond to south to north flux ratios derived from Herschel (crosses Greaves et al.2014) and SCUBA and MAMBO (squares Lestrade & Thilliez 2015) observations. Because the pericenter direction has not been independently determined, the measuredflux ratios may be interpreted as pericenter (orange points) or apocenter (blue points) glow. Thin black error bars on the Herschel data correspond to flux uncertainties due to confusion within the beam. Note that the pericenter glow interpretation of the Herschel measurements at 350 μm is inconsistent with all of our models by about 3s (see thetext for adiscussion of plotted uncertainties): to reproduce that scenario, we would require a size distribution significantly shallower than q=3 and/or an absorptivity slope much steeper than b =3.
Thilliez (2015) data are such that our models appear broadly
consistent with either a pericenter or an apocenter glow interpretation.
4.4. Warmer Disks
Figure 4 suggests that with its maximum operating wavelength of 28.3μm, the James Webb Space Telescope ( JWST) may not be able to add much to our understanding of pericenter/apocenter asymmetries in Fomalhaut: our Fomalhaut models are degenerate in this band. However, JWST could play an important role for warmer disks. As a final application for our dust reradiation model, we studied disks with semimajor axes of 10, 20, and 30 au around a Fomalhaut-like Astar. Figure6shows a summary of the results. Due to the higher effective temperature of the dust, we expect the transition wavelength between pericenter and apocenter glow to occur in the far-infrared rather than the submillimeter bands that are important for Fomalhaut andò Eri. The longest JWST MIRI bands are well-placed to constrain β and q in such disks around A stars by measuring pericenter/apocenter asymmetries. Even barely resolved observations at 24–30 μm could constrain the size distribution and eccentricities of those disks.
5. SUMMARY AND DISCUSSION
Using both semi-analytic and numerical modeling of the azimuthal dust distribution in an eccentric ring of colliding planetesimals, we have studied the wavelength dependence of surface brightness variations using simple assumptions about dust radiative properties and size distributions. We argued that several far-infrared and (sub)millimeter images of Fomalhaut and ò Eridani obtained with Herschel, JCMT, SHARC II,
ALMA, and ATCA (Holland et al. 2003; Marsh et al. 2005; Boley et al.2012; Ricci et al.2012; Greaves et al.2014) should
be reinterpreted as suggestions or examples of apocenter glow. This reinterpretation also yields new constraints on the grain properties and size distributions from the existing data.
Our modeling work also has implications for future observa-tions of debris disks. JWST will be a powerful new source of debris disk images, observing at 5–28 μm with the MIRI instrument. Figure 6 illustrates that this wavelength range is particularly sensitive to pericenter glow. We predict apocenter/ pericenter flux ratios as small as 0.1 in this range for dust emitting via the highly temperature-sensitive Wien law.
ALMA, on the other hand, will operate at wavelengths from 3 mm to 400μm, primarily continuing to detect apocenter glow. ALMA images will be especially useful because, as Figures 3, 5, and6 show,the apocenter/pericenter flux ratio becomes insensitive to dust properties at millimeter wave-lengths. For afixed disk mass, changes in q and β mostly affect the flux contributed by the smallest particles: increasing q increases the number of very small particles, while increasingβ decreases the flux reradiated at wavelengths larger than the particle size. However, for the longest wavelengths, l s, the flux from small particles becomes negligible. To lowest order, the millimeter apocenter/pericenter flux ratio therefore depends only on the apocenter/pericenter temperature and density contrasts. The largest bodies radiate efficiently and have effective temperature
* *
~ µ
T T R( r)1 2 1 e 2 ( )7 where we assume the star is a blackbody with effective temperature T* and radius R* and, in the last step, apply Equation(2) with f=0 (top sign) for pericenter and f=pfor apocenter(bottom sign). Together with Equation (4) evaluated
at f=0 and π, this gives
-+ + - + 8 e e e e e
apocenter pericenter flux ratio 1 2
1 2
1
1 1
( ) ·
where, as before, we take only lowest order terms in the eccentricity. The millimeter apocenter/pericenter flux ratio thus provides a direct estimate of the disk eccentricity.
Some systems, like ò Eridani, no doubt contain additional structures that will complicate interpretation of their images. However, with this new understanding of apocenter glow and its wavelength dependence, we can begin future studies of debris disk images pointed in the right direction.
M.P. was supported by NSERC funds and by an NPP fellowship at Goddard Space Flight Center administered by ORAU through a contract with NASA. M.P. and M.J.K. were partially supported by NASA grant NNX15AK23G. We thank an anonymous referee for knowledgeable comments that improved our writeup. M.P. thanks Yoram Lithwick and Yanqin Wu for helpful conversationsand Bok Tower Gardens for their warm hospitality in the later stages of writing.
REFERENCES
Acke, B., Min, M., Dominik, C., et al. 2012,A&A,540, A125 Boley, A. C., Payne, M. J., & Ford, E. B. 2012,ApJ,754, 57
Chiang, E., Kite, E., Kalas, P., Graham, J., & Clampin, M. 2009,ApJ,693, 734 Currie, T., Lisse, C. M., Kuchner, M., et al. 2015,ApJL,807, L7
Figure 6. Apocenter/pericenter flux ratios as a function of wavelength for model debris disks of sizes 10 au(solid purple), 20 au (dashed blue), and 30 au (dashed–dotted red) around a Fomalhaut-like A star. As before, our grid of dust reradiation models covered parameter ranges1b3,3 q 4. The top curve of each color/line style follows the maximum flux ratio values in our grid of models, while the bottom curve follows the minimum values. The wavelengths at which the greatest range offlux ratios occur are 24–70 μm. This suggests that observations of pericenter vs. apocenter asymmetries at the longest JWST bands are well-placed to constrain β and q in close-in disks around A stars.
Dent, W. R. F., Walker, H. J., Holland, W. S., & Greaves, J. S. 2000,MNRAS, 314, 702
Eiroa, C., Fedele, D., Maldonado, J., et al. 2010,A&A,518, L131 Greaves, J. S., Sibthorpe, B., Acke, B., et al. 2014,ApJL,791, L11 Holland, W. S., Greaves, J. S., Dent, W. R. F., et al. 2003,ApJ,582, 1141 Kalas, P., Graham, J. R., & Clampin, M. 2005,Natur,435, 1067
Kovtyukh, V. V., Soubiran, C., Belik, S. I., & Gorlova, N. I. 2003, A&A, 411, 559
Krist, J. E., Stapelfeldt, K. R., Bryden, G., & Plavchan, P. 2012,AJ,144, 45 Kuchner, M. J., & Holman, M. J. 2003,ApJ,588, 1110
Lagrange, A.-M., Milli, J., Boccaletti, A., et al. 2012,A&A,546, A38 Lestrade, J.-F., & Thilliez, E. 2015,A&A,576, A72
Li, A., & Draine, B. T. 2001,ApJ,554, 778
Marsh, K. A., Velusamy, T., Dowell, C. D., Grogan, K., & Beichman, C. A. 2005,ApJL,620, L47
Nesvold, E. R., & Kuchner, M. J. 2015,ApJ,815, 61
Nesvold, E. R., Kuchner, M. J., Rein, H., & Pan, M. 2013,ApJ,777, 144 Pearce, T. D., & Wyatt, M. C. 2014,MNRAS,443, 2541
Pérez, L. M., Carpenter, J. M., Chandler, C. J., et al. 2012,ApJL,760, L17 Quillen, A. C. 2006,MNRAS,372, L14
Reidemeister, M., Krivov, A. V., Stark, C. C., et al. 2011, A&A, 527, A57
Ricci, L., Testi, L., Maddison, S. T., & Wilner, D. J. 2012,A&A,539, L6 Rodigas, T. J., Malhotra, R., & Hinz, P. M. 2014,ApJ,780, 65
Roques, F., Scholl, H., Sicardy, B., & Smith, B. A. 1994,Icar,108, 37 Schneider, G., Silverstone, M. D., Hines, D. C., et al. 2006,ApJ,650, 414 Schneider, G., Weinberger, A., Becklin, E., Debes, J., & Smith, B. 2009,AJ,
137, 53
Stapelfeldt, K. R., Holmes, E. K., Chen, C., et al. 2004,ApJ,154, 458 Telesco, C. M., Fisher, R. S., Piña, R. K., et al. 2000,ApJ,530, 329 Thalmann, C., Janson, M., Buenzli, E., et al. 2011,ApJL,743, L6 Wyatt, M. C., Dermott, S. F., Telesco, C. M., et al. 1999,ApJ,527, 918