TL552 MIT LIBRARIES DUPL .M41
*F614
n* 3 9080 00678575 9
FLIGHT TRANSPORTATION LABORATORY
REPORT R 90-5
AIRLINE RESERVATIONS FORECASTING:
PROBABILISTIC AND STATISTICAL MODELS
OF THE BOOKING PROCESS
Anthony 0. Lee
September 1990
DEPARTMENT
A ERONAUTICS
AST RONAU TICS
FLIGHT TRANSPORTATION
LABORATORY
AIRLINE RESERVATIONS FORECASTING:
PROBABILISTIC AND STATISTICAL MODELS OF THE BOOKING PROCESS
by
ANTHONY OWEN LEE
Sc.B. Applied Mathematics, Brown University (1984)
S.M. Operations Research, Massachusetts Institute of Technology (1987)
SUBMITTED TO THE DEPARTMENT OF CIVIL ENGINEERING IN PARTIAL FULFILLMENT OF THE REQUIREMENTS
FOR THE DEGREE OF
DOCTOR OF PHILOSOPHY in Transportation Systems
at the
MASSACHUSETTS INSTITUTE OF TECHNOLOGY
September, 1990
© Massachusetts Institute of Technology, 1990. All rights reserved.
Signature of Author... ...
Department of Civil Engineering August, 1990
C e rtifie d b y ... ... . .. ... ... ... Moshe Ben-Akiva Professor, Civil Engineering Thesis Supervisor
A ccepted by... . . . . ...
Ole S. Madsen Departmental Committee on Graduate Studies
AIRLINE RESERVATIONS FORECASTING:
PROBABILISTIC AND STATISTICAL MODELS OF THE BOOKING PROCESS by
ANTHONY OWEN LEE
Submitted to the Department of Civil Engineering in August, 1990 in partial fulfillment of the requirements for the Degree of Doctor of Philosophy in Transportation Systems
ABSTRACT
In this thesis, we develop the necessary statistical framework to produce accurate forecasts of total bookings in a particular fare class on a specific flight number departing on a given date at various points before departure. After an introduction to the basic terminology of the airline
booking process, a rigorous probabilistic model is developed. The booking process is modeled as a stochastic process with requests, reservations, and cancellations interspersed in the time before a flight departs. The key result of the probabilistic analysis is a censored Poisson model of the airline booking process.
A comprehensive statistical framework views the booking process from a data analysis perspective. We describe models based on advance bookings (the traditional booking curve) and historical bookings (a traditional time series model). An important development is the combined model which features a potentially more accurate combination of the advance bookings and historical bookings models. Additionally, we extend the statistical framework to include booking limits, which constrain the observed number of reservations in each fare class. The result is a truncated-censored regression model with truncation from below at zero and censoring from above at the booking limit.
We test the forecasting ability of the censored Poisson model and a combined statistical model with censored Normal errors using actual airline data provided by a major U.S. airline. When compared to industry standard models, the models developed in this thesis produce significant improvements in forecast accuracy. In the appendix, a Monte Carlo simulation is performed to determine the value of accurate forecasting for the airlines. The results demonstrate that each 10% improvement in forecast accuracy can bring about a 0.5% to 3.0% increase in expected revenues.
Thesis Supervisor: Dr. Moshe Ben-Akiva
16
ACKNOWLEDGEMENTS
"vSow for yourselves righteousness; Reap the fruit of unfailing love; and break up your unplowed ground, for it is time to seek the Lord until He comes and showers His righteousness upon you." -- Hosea 10:12.
I would like to thank my thesis supervisor, Professor Moshe Ben-Akiva, for all the help and encouragement that he has given me over the past 3 years. It has truly been challenging working under such a well-respected person in the field of demand modeling. Moshe encouraged me to step out on faith and formulate the probabilistic model presented in this thesis.
My project supervisor, Professor Peter Belobaba, has been a great help in learning the "ins" and "outs" of revenue management and seat inventory control. His intuition and knowledge about airline management were quite helpful in the preparation of this thesis. He managed to keep this research down to earth and relevant to the airline industry.
I would like to thank Prof. Bob Simpson for contributing his vast knowledge of air transportation to this research effort. Also, I owe a great deal to Prof. Haris Koutsopoulos for
reading this thesis and for encouraging me during this entire research effort.
I would also like to thank all the various students in CTS, FTL, and TSD for their support during the preparation of this thesis. Specifically, Biz Williamson and Grace Zabat took time to listen to me when nobody else would. Also, all of my office mates (Ted, Scott, Shangyao, Dharma, and Isam) were generous in their time and patience. Staff member Lisa Magnano was extremely helpful during the final weeks of preparation of this thesis. Thanks, Usa!
My parents and grandparents have been extremely generous and supportive during my entire decade of higher education. I sincerely thank them for all of their encouragement, help, and support. Without them, I would not have been here.
Finally, I dedicate this thesis in memory of two of my favorite people: Professor Stella Dafermos and my grandfather, Mr. Frank Little. Both of them played special roles in my life.
Table of Contents
C hapter 1 Introduction ... . . 10
1.1 M otivation for Thesis ... 1 0 1.2 G o al of T hesis... . 13
1.3 Organization of Thesis ... 14
Chapter 2 Basic Definitions and Economic Analysis of the Booking Process ... 18
2 .1 Introd uctio n ... . . 1 8 2.2 A Description of the Airline Booking Process...18
2.2.1 The Reservation Phase ... 20
2.2.2 The Cancellation Phase ... 22
2.2.3 The Boarding Phase...22
2.3 The Booking Process: A Microeconomic Framework ... 23
2.3.1 Supply of Air Transportation: Schedule of Flights...24
2.3.2 Supply of Air Transportation: Fleet Assignment ... 25
2.3.3 Supply of Air Transportation: Aircraft Cabins and Fare Classes ... 28
2.3.4 The Airline's Perspective: Profit Maximization ... 31
2.3.5 The Consumer's Perspective: Utility Maximization...35
2.3.6 How Bookings Are Made: The Role of Travel Agents and Computer Reservations Systems ... 37
2.3.7 The Result of the Economic Interaction: Booking Data ... 41
2.3.8 The Need for Forecasting the Booking Process ... 45
Chapter 3 Previous Approaches: A Literature Review ... 47
3.1 Introduction...47
3.2 Types of Forecasts in the Airline Industry... 47
3.2.1 Macro-level Forecasting Literature ... 48
3.2.2 Passenger Choice Modeling Literature... 49
3.2.3 Micro-level Forecasting Literature... 49
3.3 Literature on Stochastic Processes in Reservations Forecasting...52
3.4 Current Approach Developed in this Research ... 53
Chapter 4 A Probabilistic Model of the Booking Process ... 55
4.1 Introduction... 55
4.2 Assumption of Stationary and Distinct Demand... 55
4.3 The Booking Process as a Stochastic Process... 58
4.4 The Immigration and Death Process... 59
4.4.1 Case 1: Single Fare Class, Infinite Capacity ... 60
4.4.2 Case 2: Single Fare Class, Finite Capacity... 77
4.5 Applicability of Stochastic Models to Forecasting ... 82
4.6 Estimation and Forecasting in the Stochastic Models ... 83
4.7 The "Ideal" Stochastic Model ... 91
4.8 Conclusions and Implications... 94
Chapter 5 A Statistical Framework for Analysis of the Booking Process ... 97
5.1 Introduction ... 97
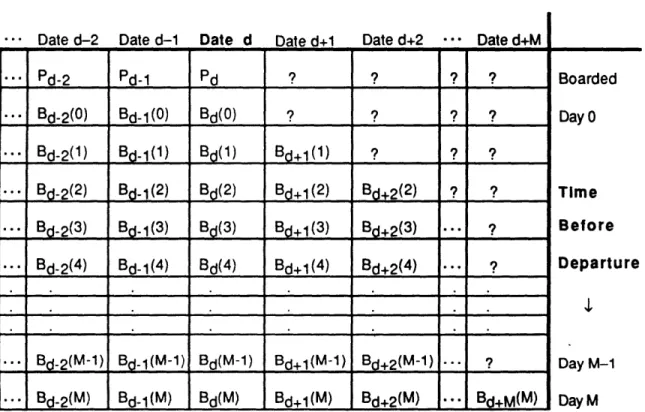
5.2 Terminology of the Booking Process ... 98
5.3 Available Booking Data...102
5.4 Distinction Between Estimation and Forecasting...104
5.5 Three Main Statistical Models...104
5.5.1 Fundamental Relationship ... 105
5.5.2 The Advance Bookings Model ... 106
5.5.3 The Historical Bookings Model ... 110
5.5.4 Combined Models ... 112
5.5.5 Models for Passengers Boarded ... 117 --moh,
5.6 Effect of Booking Limits on Forecasting ... 118
5.6.1 Distinct Booking Limits...119
5.6.2 Nested Booking Lim its...126
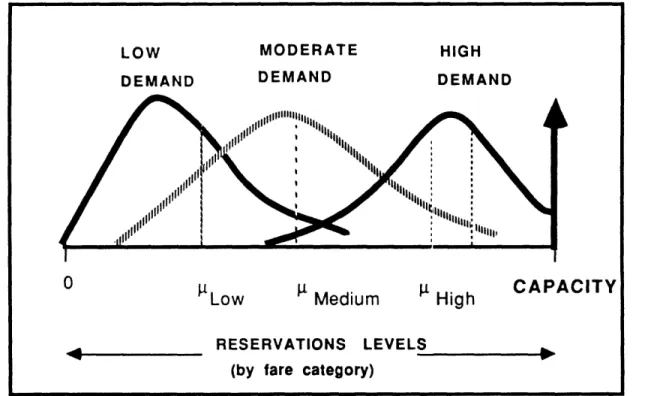
5.7 Analysis of Airline Demand Distributions...129
5.8 Conclusions...135
Chapter 6 Practical Issues in Estimation and Forecasting ... 137
6.1 Introduction...137
6.2 Airline Booking Data...138
6.2.1 Available Booking Data ... 138
6.2.2 Ideal Additional Booking Data...140
6.3 Issues in Estimation and Forecasting...143
6.3.1 The Estimation Phase...143
6.3.2 The Forecasting Phase...154
6.4 Case Study I: Outliers, Seasonality, and Dynamic Modeling...159
6.5 Case Study I: The Effect of Outlier Editing and Model Selection ... 164
6.6 Conclusions...174
Chapter 7 Model Estim ation and Forecasting ... 176
7.1 Introduction ... 176
7.2 Testing of Probabilistic and Statistical Models ... 176
7.2.1 The Censored Poisson Model ... 177
7.2.2 The Full Information Combined Model ... 185
7.3 Case Study Ill: Estimation and Forecasting Results from the Censored Poisson and the Full Information Combined Model...191
7.4 Case Study IV: Estimation and Forecasting Results from the Full Inform ation Combined Model ... 202
7.5 Future Extensions...215
"n lmllwilii-ll~l u1 - 1
Chapter 8 Conclusions and Future Research ... 218
8.1 Introduction...218
8.2 Research Findings and Contributions ... 218
8.2 Future W ork ... 221
8.2.1 Extension of the General Probabilistic Model...221
8.2.2 Extensions of the Statistical M odels...225
8.2.3 Extension to Origin-Destination Forecasting ... 226
8.2.4 The Need for a Forecasting System ... 228
Bibliography ... :...232
List of Figures
Figure 1.1 The Seat Inventory Control Process... 12
Figure 2.1 The Booking Process ... 19
Figure 2.2 Partial Route Map of a Major U.S. Airline ... 26
Figure 2.3 Sample Booking Curve ... 41
Figure 2.4, Sample Booking Curves of High Fare Class and Low Fare Class... 43
Figure 2.5 Sample Booking Curve Limited by a Booking Limit... 43
Figure 2.6 Booking Curve with a Decrease in Bookings... 45
Figure 5.1 Normal Distribution Censored from above at Booking Limit ... 121
Figure 5.2 Truncated Normal Distribution from below at zero ... 121
Figure 5.3 Conceptual Model of Distribution Patterns...122
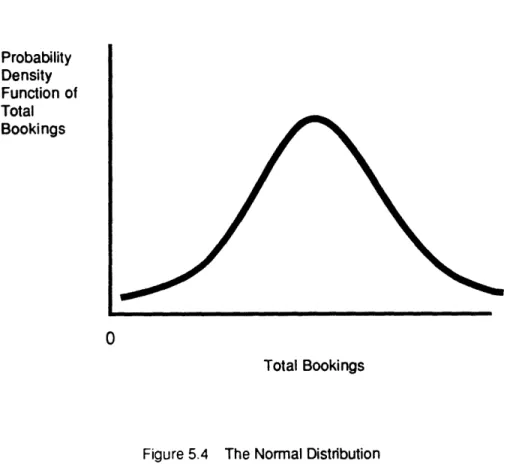
Figure 5.4 The Normal Distribution ... 131
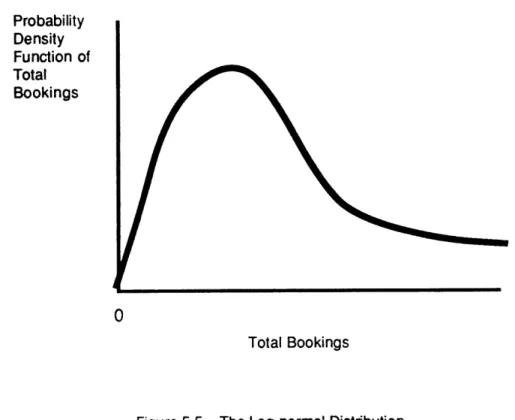
Figure 5.5 The Log-normal Distribution ... 132
Figure 5.6 The Poisson Distribution ... 133
Figure 5.7 The Gamma Distribution ... 134
Figure 8.1 The Proposed Forecasting System...229
Figure A.1 Percentage Change in Average Expected Revenue Varying the Forecast -Standard Deviation Only...258
Figure A.2 Percentage Change in Average Expected Revenue Varying the Forecast M e a n O nly ... 2 5 8 Figure A.3 Percentage Change in Average Expected Revenue Varying the Forecast Mean and Standard Deviation...259
List of Tables
Table 2.1 Aircraft Types of a Major U.S. Carrier... 27
Table 2.2 Fare Classes of a Major U.S. Airline ... 30
Table 5.1 Available Booking Data in Class c on Flight f on Date d...103
Table 6.1 Percentage Improvement of Best Model with Outlier Editing over Best M odel w ithout O utlier Editing ... 161
Table 6.2 Percentage Improvement of Best Model with Deseasonalized Data over Best Model without Deseasonalized Data...162
Table 6.3 Percentage Improvement of Best Dynamic Model over Best Static Model...163
Table 6.4 Comparison of Moving Average, Regression without Model Selection, and Regression w ith M odel Selection...173
Table A.1 Inputs and EMSR Results for 200 Seat Aircraft ... 260
Table A.2 Inputs and EMSR Results for 200 Seat Aircraft ... 262
Table A.3 Inputs and EMSR Results for 200 Seat Aircraft ... 264 WIN1111101111,141IN11 Im
Chapter 1 Introduction
1.1 Motivation for Thesis
The need for accurate reservations forecasting in the U.S. airline industry is a direct result of the U.S. Airline Deregulation Act of 1978. In 1978, the United States government gave up
authority over domestic fares and routes, allowing U.S. airlines to enter and leave domestic markets freely and to charge whatever fare the market would bear. Two immediate results of deregulation were increased competition on many routes and pricing freedom. In the late 1970's and early 1980's, the entrance of new, low-cost airlines into traditionally profitable markets threatened the established, high-cost carriers. Often, the entrance of new airlines into a market brought about substantially lower fares. In order to remain profitable, airline managers of the established carriers recognized the need to match the lower fares of the newer carriers on a limited basis, while still retaining many seats for sale at higher fares.
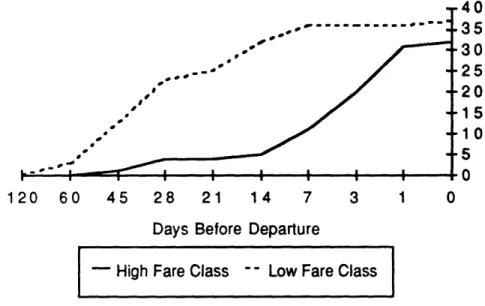
Pricing freedom, the second key result of deregulation, allowed airlines to charge whatever fare the market would bear. Airlines were able to change their pricing structure to take into account the fundamental differences between leisure travelers and business travelers. Leisure travelers tend to price sensitive and book well before the day of departure. By contrast, business travelers are generally time sensitive and make reservations closer to the day of departure. The airlines began to offer low fares with many restrictions to price sensitive leisure travelers while maintaining higher fares with fewer, if any, restrictions for the time sensitive business traveler. In order to protect space for the higher paying, late booking business
travelers, airline managers needed to limit the space available to the early booking, low fare paying leisure travelers.
Thus, on two dimensions, the U.S. airlines recognized the need to limit seats available to lower fare paying passengers and protect seats for high fare paying passengers. In essence, the airlines desire to closely control their inventory of seats, making intelligent decisions of how many seats to sell in each fare class. The process of seat inventory control (also called "yield management') attempts to find the optimal allocation of spaces to each fare class by maximizing revenue. With the deregulation of Canadian domestic airlines, the planned liberalization of European markets in 1992, and the effect of the U.S. "free market" philosophy in international aviation treaties, the interest in seat inventory control is no longer limited primarily to U.S. airlines but is spreading to many airlines throughout the world.
The goal of the seat inventory control process is to maximize revenue by optimally allocating the seats on the aircraft among the various fare classes. One of the most critical inputs of an effective seat inventory control system is historical reservations data. Then, for future flight departures, the seat inventory control process:
1. Produces accurate forecasts of the total number of bookings in each fare class. 2. Optimizes the allocation of seats among fare classes, given the forecasts of total
bookings.
The output of a seat inventory control system is the optimum allocation of seats for each fare class on a future departure. Figure 1.1 illustrates a seat inventory control system.
Much research has been done on the second step, the optimal allocation of seats among fare classes. However, relatively little attention has been paid to airline reservations forecasting. In Appendix A, we attempt to quantify the potential benefits of accurate forecasting methods. A
FORECASTING
PROCEDURE
SEAT
OPTIMIZA TION
ALGORITHM
ALLOCATIONS OF
SPACES AMONG
FARE CLASSES
Figure 1.1 The Seat Inventory Control Process
HISTORICAL
BOOKING
simulation of the change in expected revenues brought about by more accurate forecasts is performed. The results demonstrate that increased forecast accuracy does indeed bring about increased revenues, particularly on high demand flights. Furthermore, we show that each 10% improvement in forecast accuracy on high demand flights can potentially result in a $10 to $60 million increase in total annual revenue for a major U.S. airline. Thus, the benefits of pursuing accurate forecasting methods are quite clear. This thesis will address many of the fundamental issues related to accurate airline reservations forecasting.
1.2 Goal of Thesis
The goal of this thesis is to develop the necessary statistical framework to produce accurate forecasts of total bookings in a particular fare class on a specific flight number departing on a given date at various times before departure. In order to attain this goal, we have three primary objectives in this thesis. First, we develop a rigorous probabilistic model, which describes the booking process as a stochastic process with requests, reservations, and cancellations interspersed in the time before departure of a flight. The probabilistic model emphasizes the dynamic nature of the airline booking process. The key results of the probabilistic analysis are a relatively straightforward model based on the Poisson distribution and a starting p6int for developing simulations of the airline booking process.
The second objective is to create a comprehensive statistical framework from the data analysis perspective. We introduce models based on advance bookings (the traditional booking curve) and historical bookings (time series of bookings). An important development is the concept of a combined model, which combines the advance bookings and historical
bookings models to produce a potentially more accurate forecasting model. In addition, we introduce the concept of booking limits, which constrain the observed number of reservations in each fare class. When the booking limits enter into the analysis, the combined model is extended to a truncated-censored combined model with truncation from below at zero and censoring from above at capacity. We investigate a truncated-censored combined model based on the Normal distribution.
After the development of a probabilistic model and
a
rigorous statistical framework, the third objective of this thesis is to demonstrate the effectiveness of the probabilistic and statistical models on actual airline data. When compared to industry standard models, we show that the models developed in this thesis can produce significant improvements in forecast accuracy. The results validate the application of these probabilistic and statistical methods to airline reservations forecasting.1.3 Organization of Thesis
The rest of this thesis is organized in the following manner. Chapter 2, entitled Basic
Definitions and Economic Analysis of the Booking Process, introduces the terminology of the
airline booking process in the context of a microeconomic framework. The booking process is a series of interactions between a potential air traveler and an airline. Detailed descriptions of the three phases of the booking process, which include the reservation phase, the cancellation phase, and the boarding phase, are given. The second part of the chapter focuses specifically on a microeconomic framework for the airline booking process. In microeconomic terms, the booking process is an interaction between a utility-maximizing consumer and a profit-maximizing airline. We formulate the profit maximization problem which the airline faces and the utility
maximization problem that the consumer confronts. Then, we examine the forum in which airline reservations are made, specifically discussing the roles of the travel agent and the computer reservations system. Finally, the booking data which results from the interaction between the consumer and the airline is described.
Chapter 3, Previous Approaches: A Literature Review, surveys the relevant literature devoted to airline forecasting problems. We point out that, while most of the literature discusses macro-level models or passenger choice models, the area of primary interest in this thesis is micro-level forecasting. First, we examine the area of macro-level forecasting, which is the most heavily studied area. Macro-level forecasting includes aggregate forecasts such as the annual number of U.S. to Europe passengers or the number of passengers who board at a certain airport. Second, we briefly detail the small amount of work which has been done on passenger choice modeling. Finally, we discuss the literature on micro-level forecasts. This literature examines forecasting at the fare class and flight level. However, we find that the scope of the previous work in micro-level forecasting is quite limited.
Chapter 4, entitled A Probabilistic Model of the Booking Process, analyzes the booking process from a probabilistic standpoint. First, we discuss the assumptions of stationary and distinct airline booking data. Next, the airline booking process is described as a stochastic process. This stochastic process includes no-shows, go-shows, and waitlists, usually regarded as special cases, in a straightforward and natural manner. After simplifying assumptions are made, the booking process is modeled as an immigration and death process. Then, this chapter discusses the applicability of stochastic models to forecasting and the practical issues of estimation and forecasting for stochastic models. Chapter 4 concludes with a description of the "ideal" stochastic model, which incorporates the more subtle aspects of the booking process.
The topic of Chapter 5 is the development of a comprehensive statistical framework for analysis of the airline booking process. Chapter 5 examines the booking process from the statistical data analysis viewpoint. First, we investigate the available airline data on-hand at any time during the booking process of a particular flight. Then, we make the fundamental distinction between estimation, which fits a model to historical data, and forecasting, which uses the estimated model to predict future bookings. Three types of statistical models naturally arise from the data: advance bookings, historical bookings, and combined models. We show that the combined models provide an intuitive view of the booking process. The second part of Chapter 5 addresses the issues of booking limits and demand distributions. First, the effect of booking limits on airline booking data is considered. The presence of booking limits leads to a truncated-censored demand distribution and a set of truncated-truncated-censored regression equations. The chapter concludes with a discussion of the strengths and weaknesses of several possible demand distributions, such as the Normal, Log-normal, Poisson, and Gamma.
Chapter 6, Practical Issues in Estimation and Forecasting, addresses the practical issues involved in estimation and forecasting of the airline booking process. First, the types of booking data generally available to airlines are outlined. Also, we discuss the types of data not generally available which would be of value in analyzing the airline booking process. This chapter continues with the important issues in the estimation and forecasting of airline bookings. For example, we investigate issues such as the amount of historical data to use in estimation, the frequency of re-estimating the models, the detection and removal of outliers from the booking data, the effect of seasonal variation, and model selection. Key issues in forecasting include how to measure forecast performance and how to avoid "bad" forecasts. Two case studies illustrate the importance of the above issues in estimation and forecasting.
Chapter 7, entitled Model Estimation and Forecasting, involves the formulation and testing of probabilistic and statistical models on actual airline booking data provided by a major U.S. airline. We formulate the likelihood functions of a statistical model based on the Normal distribution and a probabilistic model based on the Poisson distribution. Two case studies apply the models to actual booking data and report significant improvements in forecasting accuracy over simple linear regression and moving average models.
Chapter 8 contains conclusions and topics of further research in airline reservations forecasting. The chapter begins with a summary of the major contributions and results of this thesis. Then, extensions of the probabilistic and statistical models are discussed. We briefly address the issue of origin-destination forecasting. Finally, this chapter examines the practical issues surrounding the implementation of an airline reservations forecasting system.
Chapter 2 Basic Definitions and Economic Analysis of the
Booking Process
2.1 Introduction
This chapter describes the airline booking process in the context of a microeconomic framework. First, the booking process is described in detail. The next section introduces the microeconomic analysis of the booking process, focusing on the supply of air transportation by the airline firm and the generation of demand by the consumer. The computer reservations system (CRS) is the forum in which the transactions between the consumer and the airline take place and are recorded. Finally, this chapter examines the interaction between the consumer and the firm in light of their respective goals and demonstrates the role of forecasting from the airline's perspective.
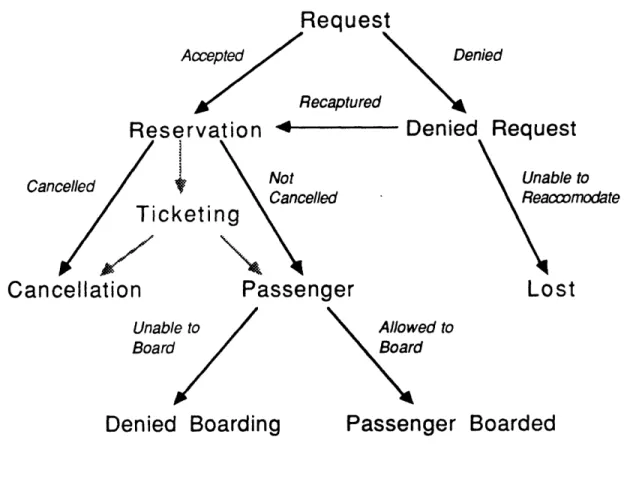
2.2 A Description of the Airline Booking Process
This section follows an individual reservation through the booking process and defines the relevant terms. The booking process consists of three phases: the reservation phase, the cancellation phase, and the boarding phase. In the reservation phase, a potential air traveler makes a request for air travel and the airline attempts to satisfy the request. In the cancellation
of the booking process is the boarding phase, which occurs at the airport on the day of the flight. Figure 2.1 illustrates the entire booking process.
Request
Accepted RecaptuReservation
4
Not Cancelled CancelledTicketing
Cancellation
Passenger
Unable to Board Den redDenied
iedRequest
ReacoLost
Allowed to BoardDenied Boarding
Passenger Boarded
Figure 2.1 The Booking Process
to
modate
2.2.1 The Reservation Phase
In the reservation phase, a request for air travel services enters the computer reservations system. A request is defined as a call to a travel agent or airline reservations agent for air travel services between an origin city and a destination city on a certain date. A request usually includes return service from the destination city back to the origin city at a later time. For the purposes of this section, we assume that a request is for a given level of service on a specific itinerary, which consists of one or more flights (aircraft flying between a city pair at a specific time) at a particular fare (the price of travel between the origin and destination cities) on specified dates. Requests are usually made by a potential traveler in the days and weeks before the desired departure date. However, a request may be made at the airport on the day of departure.
A go-show is a traveler who shows up at the airport on the day of departure and makes a last
minute request for air travel on a particular flight.
If space is available on the desired flight at the desired fare, a reservation is made. A
reservation is an accepted request for a space on a specific flight at a particular fare on a given
date. It is important to draw the distinction between a space and a seat on an aircraft. An airline may sell more spaces than physical seats, because some travelers holding reservations may not show up on the day of departure. A flight is said to be overbooked when the total number of reservations exceeds the actual number of seats on the aircraft.
On the other hand, if space is not available between the origin and destination cities on the requested date at the desired fare, the request is denied. A denied request is a request which is rejected by the airline due to lack of availabililty of space. Space is categorized by fare class on each flight. A fare class is a grouping of similar published fares created for the purpose of controlling reservations. Each fare class is assigned a certain number of spaces on each flight. Generally, but not always, the highest fare class contains the highest fares, the next
highest fare class contains the next highest fares, and so forth. The lowest fare class is usually comprised of the lowest fares.
When the spaces corresponding to a certain fare class are filled, we say that the fare class is full or closed. If the corresponding fare class is closed, then the request for travel is denied. The reservations agent usually attempts to accommodate the request in a different fare class on the same flight or in the requested fare class on another flight. If the traveler accepts a different fare class on the same flight, then the airline has made a vertical recapture of the traveler. If the traveler is accommodated on another flight in the requested fare class, then the airline has made
a horizontal recapture of the traveler (Belobaba, 1987). Otherwise, if the traveler opts not to fly
or chooses a different airline, the traveler is lost to the airline.
Ticketing occurs when a traveler pays the fare associated with the reservation to an airline
agent. In exchange, the airline gives the traveler a ticket, which verifies the itinerary of the trip and the fare paid. Ticketing is usually done at one of three points during the booking process depending on the rules associated with the fare paid and the policy of the particular airline. Most frequently, a traveler purchases a ticket between the time that the reservation is made and the time that passengers board the aircraft on the departure date. We should note that a cancellation may still occur after the ticket is issued. However, it is also possible that a reservation is cancelled before a ticket is ever purchased. This might happen because of a change in plans or a traveler's non-compliance with the stated ticketing rules of the airline.
Finally, in isolated cases, a traveler may purchase a ticket after boarding the aircraft enroute to his destination. The Eastern Airlines Boston-New York-Washington Shuttle used to allow enroute purchases of tickets as did the now-defunct PeoplExpress Airlines.
2.2.2 The Cancellation Phase
The second step of the booking process, the cancellation phase, starts after a reservation is made. In the days and weeks before the flight departs, the traveler may cancel a reservation.
A cancellation is a reservation which is cancelled (explicitly or implicitly) before a flight departs.
An explicit cancellation occurs when the traveler cancels a reservation due to a change in travel
plans. From the perspective of a particular fare class on an individual flight, any change in plans is reflected as a cancellation, regardless of where the passenger is re-booked. For example, when a traveler cancels a reservations in fare class 2 and re-books in fare class 1 on the same flight, fare class 2 experiences a cancellation and fare class 1 gains an additional reservation.
An implicit cancellation occurs when the airline cancels a reservation due to a travelers
non-compliance with the airline's stated terms and restrictions for that reservation. For example, many of the lowest fare reservations must be ticketed within 24 hours after the reservation is made. If the traveler does not purchase the ticket within 24 hours, the airline automatically cancels the reservation. A no-show is a last minute cancellation by the traveler. In general, a no-show is a traveler with a reservation who does not show up at the airport on the day of the flight. Each airline has rules regarding the minimum time before departure of a flight by which the traveler must show up. If a traveler does not show up by the minimum time, the reservation may be cancelled. Travelers become no-shows if they do not show up to board the flight.
2.2.3 The Boarding Phase
The boarding phase is the third step of the booking process, which occurs at the airport on the day of the flight. If a reservation is not cancelled before the flight departs, the traveler shows up at the airport and becomes a passenger. A passenger is a traveler holding a reservation who shows up at the airport on the day of departure before the designated minimum
check-in time. If there are sufficient seats on the aircraft, then the passenger is allowed to board the aircraft. A passenger boarded is a passenger who obtains a seat on the aircraft and departs
on the scheduled flight.
On the other hand, the flight may be oversold. That is, the flight is overbooked and more passengers show up at the airport than the capacity of the aircraft. In this case, some passengers will be denied access to the aircraft. A denied boarding is a passenger who is unable to board the aircraft due to a lack of seats. A denied boarding may be voluntary, where the passenger volunteers to not board the aircraft in exchange for some type of compensation. Otherwise, the denied boarding is involuntary, where the airline refuses to allow the passenger to board the aircraft, and compensation is granted to the passenger according to the policies of the airline.
2.3 The Booking Process: A Microeconomic Framework
As described in the previous section, the booking process consists of a series of interactions between a potential air traveler and an airline. In microeconomic terms, the airline booking process is an economic interaction between a utility-maximizing consumer, the potential air traveler, and a profit-maximizing producer, the airline firm. The consumer decides whether to travel by air and creates flow over an airline's network of flights. Taken together, consumers create the demand for air travel services. The producer is the airline which provides a schedule of flights between city pairs and makes available a certain number of spaces in each fare class on every flight. Together, the world's airlines produce the supply of air transportation.
This section first describes the supply of air transportation and the profit maximization goals of an individual airline. Next, consumer demand for air travel and the utility maximization
goals of the consumer are discussed. Third, this section examines the mechanics of how airline bookings are actually made, through an airline agent and on computer reservations systems, and the effect on the interaction between the potential air traveler and the airline. Finally, we discuss the booking data resulting from the economic interaction between the travelers and the airline. In conclusion, we show how the need for forecasting of the booking process arises from this economic interaction.
2.3.1 Supply of Air Transportation: Schedule of Flights
As the producer in the microeconomic context, an airline provides the supply of air transportation. The supply takes the form of a schedule of air services between a set of origins and a set of destinations. Let us define the basic terminology of the air transportation schedule. (Simpson, 1982) A route map is a geographical network of air service connecting the cities to be served. A partial route map of a major U.S. airline is given in Figure 2.2. A market is an origin-destination pair of cities. In Figure 2.2, Boston-Milwaukee is a market, so is Boston-Seattle. A
link connects two cities on the route map with an aircraft flown non-stop. Figure 2.2 shows that
Boston-Milwaukee is a link and Milwaukee-Seattle is a second link in the network. A flight leg is a link flown by an aircraft at a specific departure time. For example, flight 1234 from Boston to Milwaukee at 4:00 p.m. is a flight leg.
A route is a consecutive series of flight legs flown by a single aircraft. For instance,
Boston-Milwaukee-Seattle is a route made up of two flight legs. A flight is a route flown by an aircraft at a specific time. For example, on a Boston-Milwaukee-Seattle route, there might be two flights:' flight 65 at 9:00 a.m. and flight 345 at 6:00 p.m. Finally, a path is a series of flights used by an air traveler from his origin to his destination. If two or more flights are taken by an air traveler, then we say that the air traveler makes connections between flights. To illustrate, if a
Em,-traveler is going from Philadelphia to Phoenix, his path may be Philadelphia-Milwaukee on flight 185 and Milwaukee-Phoenix on flight 225. In this case, the traveler connects from flight 185 to flight 225 at Milwaukee.
2.3.2 Supply of Air Transportation: Fleet Assignment
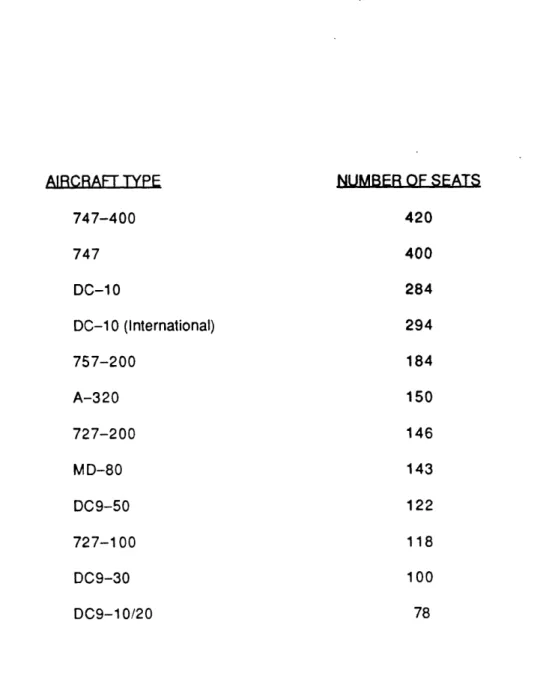
After an airline decides the routes that it wishes to fly, the next major aspect of the supply of air transportation is fleet assignment. In brief, given that an airline has different types of aircraft in its fleet, it must decide which type of aircraft will fly on each route. For example, Northwest has 12 aircraft types in its fleet. Table 2.1 shows the aircraft types. Each aircraft type has a cruising speed, maximum range, one or more seating configurations, and certain performance characteristics, such as noise levels from the engines and minimum required runway length. The length of the flight, the runway length at the origin and destination airports, and any noise abatement rules determine whether an aircraft can feasibly fly on a particular flight leg. The seating configuration, or number of seats on the aircraft, is crucially important to the profit maximization goals of the airline. Aircraft capacity directly determines how many passengers are able to board a particular flight and, hence, places an upper bound on the potential revenues generated from the flight. Furthermore, the type of aircraft used on a
particular flight largely defines the cost of operating the flight. For more detail on the fleet assignment problem, see Simpson (1982).
Minneapolis/St. Paul
San Francisco
Los Angeles
Boston
New York
Philadelphia
Washington
Orlando
Miami
Tampa
a Iwillbi AIRCRAFT TYPE 747-400 747 DC-10 DC-10 (International) 757-200 A-320 727-200 MD-80 DC9-50 727-100 DC9-30 DC9-10/20 NUMBER OF SEATS 420 400 284 294 184 150 146 143 122 118 100 78
Table 2.1 Aircraft Types of a Major U.S. Carrer
2.3.3 Supply of Air Transportation: Aircraft Cabins and Fare Classes
Once the routes of an airline are fixed and the fleet has been assigned, the third major element of the supply of air transportation is how individual seats are sold aboard the aircraft. First, we examine the arrangement of an aircraft cabin. An aircraft is usually physically divided into several cabins, each offering a different level of uon-board service". A typical three cabin aircraft includes a First Class cabin, a Business Class cabin, and an Economy (Coach) Class cabin. The First Class cabin is generally located in the front of the aircraft and offers the highest level of on-board amenities, including more flight attendants per passenger, wide seats, complimentary cocktails and movies, and enhanced meal service. The Business Class cabin typically is located between the First Class cabin and the Economy Class cabin. Business Class offers an intermediate level of in-flight amenities, often with complimentary cocktails and movies as well as better meal service. Finally, the Economy Class cabin is located in the rear of the aircraft and includes a basic level of in-flight amenities. Although a meal is often served, passengers must usually pay for additional amenities, such as cocktails and movies. This three cabin system is common on international routes, as well as on European and Canadian domestic routes. On U. S. domestic flights, most airlines have a two class system with a First Class cabin and an Economy Class cabin.
To complete the description of the supply of air transportation, we must examine the fares charged in the various cabins of the aircraft. In each market, a large number of published fares are available. A published fare in a market includes the price of the trip for a given level of service and any accompanying rules, travel restrictions, and effective dates. Airlines group the published fares into fare classes for the purpose of controlling bookings in their reservations systems. A fare class is designated by a single letter code, such as "F", "C", or "Y". Currently, the major airlines use from 5 to as many as 14 fare classes for seat inventory control purposes.
-im hJ,~,.
Each fare class is assigned to a physical cabin on the aircraft. However, in most cases, there are more fare classes than physical cabins on the aircraft. Thus, travelers booked in two or more different fare classes may sit in the same cabin. Since the Economy Class cabin usually has the largest number of seats and airlines publish a wide variety of Economy fares, the majority of the fare classes are assigned to the Economy Class cabin.
For example, Northwest Airlines currently has 12 fare classes on domestic flights (see Table 2.2). The First Class cabin has two fare classes: F and A. The F fare class remains the full First Class fare designator. The A fare class identifies discounted First Class fares. For example, frequent flyers traveling on free or low cost upgrades in the First Class cabin are booked in the A fare class. Similarly, the Business Class cabin (if available) has two fare classes: C and D. The C fare class remains the full Business Class fare designator. The D fare class has become the designator for discounted Business Class travel.
In the Coach cabin, there are 8 fare classes: Y, B, M, H, 0, V, W and K. The Y fare class corresponds to the full Economy fare. The B fare class is composed of slightly less expensive fares with some minor restrictions. The bottom five fare classes, M, H, 0, V, and, K identify increasingly discounted fares and, usually, increasing service restrictions. These fares all have significant advance purchase, minimum stay, limited change and non-refundability restrictions. Additionally, spaces allocated to these bottom fare classes may be severely restricted or unavailable on some flights. The W fare class is reserved for frequent flyer award tickets.
FARE CLASS CODE DESCRIPTION PERCENTAGE OF FULL COACH FARE
F First Class 150%
A First Class Discount varies
C Business Class 120%
D Business Class Discount varies
Y Full Coach 100%
B Shallow Discount Coach 75%
M Moderate Discount Coach 60%
H Moderately Deep Discount Coach 45%
0 Deep Discount Coach 35%
V Very Deep Discount Coach 25%
W Frequent Flyer Award Coach varies
K Virtually Free Coach 10%
2.3.4 The Airline's Perspective: Profit Maximization
The airlines, like any other industry, seek to maximize profit. Since profit equals revenue minus cost, profit can be increased by decreasing the costs of operating the firm and by increasing the amount of revenue collected. In the years immediately following the U.S. Airline Deregulation Act of 1978, the airline industry attempted to minimize long-run costs by enactment of two-tier labor contracts, acquisition of fuel-efficient aircraft, and improved utilization of employees. More recently, the airlines have become concerned with the shorter run aspects of profit maximization: deciding which aircraft to operate on each flight and how many spaces to allocate to each fare class on each flight.
Since demand is stochastic in nature, the airline's short run goal is to maximize total expected profit (total expected revenue - total cost). First, total expected revenue is a function of fare, quantity of spaces allocated to a fare class, and the probability distribution of selling the spaces. Let the fare on flight f in fare class c departing on date d be Fcfd, the quantity of spaces allocated to flight f in fare class c departing on date d be CAPcfd, and the probability of selling q spaces in fare class c on flight f departing on date d be Pcfd(q). The airline's total expected revenue is the product of the fares paid and the expected number of spaces sold, summed over all classes, flights, and days of the year. Mathematically,
C F D CAPcfd
TER = Y Y Y (Fcfd * Pcfd(q)*q)
c=1 f=1 d=1 q=0
where TER is the total expected revenue of the airline. Note that the probability distribution of selling q spaces is censored at CAPcfd. That is,
00
Pcfd(CAPcfd) = Pcfd(q).
q=CAPcfd
Since the deregulated air travel environment is generally controlled by several large airlines, it is an oligopoly from the microeconomic standpoint. One primary characteristic of many oligopolistic industries is a "kinked" demand curve, which is elastic at points above the equilibrium price and inelastic at points below the equilibrium price. (Baumol and Blinder, 1979) That is, if a firm raises prices, it faces an elastic demand curve and would observe a large loss of demand to its competitors. However, if a firm lowers its prices, it faces an inelastic demand curve. All competing firms would match the lower price and the increase in demand would be comparatively small. Thus, in the airline industry, there is little incentive to change air fares in the short run. Recent experience in the U.S. verifies the relative short run stability of air fares. (Power, 1990) As a result, we assume that the price Fcfd of travel is fixed in the short run. Therefore, the short run revenue decision variable for the airline is CAPcfd, the number of
spaces allocated to fare class c on flight f on date d in order to maximize total expected profit. Two main constraints arise for the airline on the revenue side of the profit maximization process. First, we assume that the schedule of flights is fixed in the short run. Therefore, the capacity on each flight is limited to the total authorized capacity of aircraft a on flight f departing on date d, TCAPafd. The second constraint is that the demand on each flight is probabilistic in nature. An airline never knows with certainty how many requests will be received for a particular flight. We must assume a specific probability distribution of demand (a specified form of Pcfd(q)) in order to calculate the optimal number of seats to sell at each fare.
Total cost is determined largely by the length of the flight and the type of aircraft used on a given flight. Let kafd be the cost of using aircraft a on flight f departing on date d and zafd be a binary variable which equals 1 if aircraft a is used on flight f departing on date d and 0 otherwise. Then,
A F D
TC= I 1 E kaid*zafd
a=1 f=1 d=1 where TC is the total short run cost of the airline.
Several constraints arise on the cost side of the profit maximization process. First, it should be noted that aircraft fly on a network and must be assigned on a network. For instance, if an aircraft arrives at an airport, it also must leave the same airport at a later time. Thus, the fleet assignment must be balanced. In the mathematical formulation, we will call these constraints the
network constraints. Second, there are airport considerations such as maximum available gate
space and minimum turnaround time (time between landing and subsequent takeoff). In the mathematical formulation, these constraints are called the airport constraints. Third, we must assign an aircraft to routes within its performance capabilities. For example, an airline must consider the aircraft's maximum range and the runway length at the origin and destination airports. If a certain aircraft a is unable to fly flight f, we set the cost of operating aircraft a on flight f for all dates d, kafd, to infinity (or a very large cost).
Mathematically, the airline's profit maximization problem can be stated as follows:
C F D CAPcfd A F D
Maximize TER -TC = I I I (Fcfd * Pcfd(q)*q) - Y Y I kafd-zafd
c=1 f=1 d=1 q=0 a=1 f=1 d=1
subject to
C A
1 CAPcfd 1 TCAPafd* zafd for all flights f and dates d
c=1 a=1
NETWORK CONSTRAINTS AIRPORT CONSTRAINTS
zafd = 0 or 1 for all aircraft a, flights f, and dates d
Thus, the airline wishes to maximize expected profit by deciding which type of aircraft to assign to each flight and how many seats to sell in each fare class on every flight. However, the problem is constrained by the network constraints, airport characteristics, aircraft capacity, and the probabilistic nature of demand.
In the very short run, we assume that the airline has already made the fleet assignment for each route. In effect, the z variables are fixed in the above problem. Thus, in the very short run, the airline simply wants to determine how many spaces to allocate to each fare class. We call this problem the revenue maximization problem. It is formulated as follows:
C F D CAPcfd
Maximize TER = Y Y, (Fcfd * i Pcfd(q)*q)
c=1 f=1 d=1 q=O
subject to
C
I CAPcfd s TCAPfd for all flights f and dates d
c=1
CAPcfd > 0 and integer for all classes c, flights f, and dates d
where TCAPfd is the capacity of the aircraft assigned to flight f departing on date d. We note that the network constraints and the airport constraints disappear from the formulation because they are solely related to fleet assignment. In this thesis, we focus primarily on the very short run revenue maximization problem.
- 1 ... -... H.H."
2.3.5 The Consumer's Perspective: Utility Maximization
Classical microeconomic theory assumes that individuals will make choices which are the most favorable to them. The measure of favorability or goodness of a particular alternative is called utility. Thus, rational consumers attempt to maximize their utility. Applying this concept to air travel, a consumer desires to maximize his or her utility function when making a request for travel. The main factors involved in making travel plans are: travel dates, price, service, and restrictions (Belobaba, 1987). From an economic standpoint, the traveler usually has particular travel dates under consideration when calling an airline agent. Denote the desired travel dates by d'. In addition, we expect that a traveler has a certain "target" price that they are willing to pay. Let us call the desired price p .
Third, a potential traveler in general has an expected level of service. The level of service includes both board components as well as routing components. An example of the on-board component is when the consumer desires Business Class service on a particular trip. The routing component measures the quality of the itinerary in terms of the routing of the trip. For example, a business traveler who is time-conscious may prefer a non-stop flight over connecting or multi-stop flights. Denote the desired level of service by s*. Finally, when requesting a flight, a consumer knows the flexibility of the trip. That is, he knows what type of restrictions, if any, he is willing to accept on his trip. For example, a business traveler may opt for a fare which can be changed at the last minute. However, on a leisure trip, a consumer may be willing to accept a lower, non-refundable and non-changeable fare. Let us denote the desired
set of restrictions by r*.
A reservation is an economic bundle characterized by (d,p,s,r). As discussed above, the consumer's desired bundle, or ideal point, is (d',p',s',r'). A consumers utility can be measured
as a function of how a particular reservation (d,p,s,r) differs from the consumers ideal point (d*,p*,s',r). Mathematically,
U=h(d-d' p,p s- s*, r -r*)
where U represents the utility function of an individual and h is a general function. So, to. maximize the overall "desirability" of travel, the consumer maximizes U over all possible reservation bundles. The set of all possible reservation bundles (d,p,s,r) is called the choice set in economic theory.
The choice set in air transportation has four important characteristics. First, as illustrated above, the choice set is multidimensional. A choice of air travel is defined by the travel date, price, level of service, and restrictions. In addition, the choice set is bounded on the travel date and price dimensions. Most air travelers have constraints on departure dates and return dates. For example, a business traveler often has to leave on one particular date and return on another specific date. A leisure traveler may have a limit on the length of a vacation and a specific time frame for the trip, such as a particular month. On the price dimension, there is often an upper bound on the price of the trip. Leisure travelers are usually the most price sensitive, facing underlying budget constraints.
A third important aspect of the choice set of reservation bundles is that the air traveler often does not see the entire feasible set of reservation bundles. Most requests are made through an airline reservations agent or a travel agent. The traveler often relies on the agent to reduce the choice set to the two or three "most appropriate" choices. Therefore, the actual choice set for a particular traveler may be quite limited. Finally, the airline booking process is dynamic. Many additional reservations are made each day interspersed with cancellations of
existing reservations. The airlines are constantly revising the availability of seats in each fare class. Also, restrictions on the lowest fares limit their availability as the day of the flight approaches. Therefore, the available choice set changes over time. In general, the closer the departure date, the smaller the choice set of reservations bundles.
In mathematical terms, the statement of the consumers utility maximization problem is the following:
Maximize U = h(d -d, p - p*, s - s, r -r)
subject to (d,p,s,r) E C(de,di,pmax,ag,t)
where C denotes the choice set which is a function of de, the earliest possible departure time,
di, the latest possible departure time, pmax, the maximum fare that the traveler is willing to pay, ag, the type of airline agent used (determines the number of choices given to the traveler), and t, the time (number of days) before departure at which the reservation is made. In conclusion, the consumer wishes to maximize utility by finding a reservation bundle very close to the desired bundle. However, the choice set is limited due to bounds on travel dates and price, unavailability of information about all possible reservation bundles, and the amount of time before departure.
2.3.6 How Bookings Are Made: The Role of Travel Agents and Computer Reservations Systems
The transaction between the airline and the consumer takes place through an agent of the airline and is recorded in a computer reservations system (CRS). This section examines the
effect of the airline agent and the computer reservations system on the booking process.
An economic agent is a person hired to represent the airline. The principal type of agent for the U. S. air transportation industry is the travel agent. Travel agencies are independent companies which distribute tickets for airlines, prepare travel itineraries, reserve hotel rooms, and arrange many other travel services for the traveler. The airlines pay a commission to the travel agencies for each ticket sold. As of 1984, travel agencies sold over 70% of all airline tickets. (Davis, 1987) In contrast, the airline's own sales representatives handle only approximately 25% of the total airline tickets. Other minor airline agents include tour operators, who coordinate group tours and sometimes deal directly with the consumer, and wholesalers, who in some cases provide the link between the airline and the consumer (Simpson, 1982). By far, travel agents are the dominant force in selling airline tickets.
Travel agents can affect the booking process in several key ways. First, the profitability of a travel agency is dependent on the satisfaction of the consumer. Therefore, a travel agent has an incentive to try to meet the exact needs of each potential air traveler. If a traveler is a regular customer of a travel agency, the travel agent may know the traveler's particular travel requirements. Thus, the travel agent may be able to match the air traveler's utility function more closely than an airline reservations agent. In this case, the travel agency may be aiding the airline and the consumer by closely matching the airline's schedule of flights and the consumers travel needs.
Second, a travel agent may affect the booking process by reducing the consumer's choice set. Rather than presenting a consumer with a large number of alternative itineraries, a travel agent may limit the choice set to two or three alternatives. In addition, an airline may give travel agencies extra compensation, called override commissions, for booking large numbers of travelers on its flights. Thus, the travel agent may try to book as many travelers as possible on this airline, which directly affects the booking process. For example, suppose airline A and
airline B have equivalent non-stop service between Boston and Washington, D. C. If airline A gives local travel agencies incentives for large numbers of bookings, airline B (if it does not immediately match the incentives) may experience a large drop in bookings on its flights in the market.
Third, large travel agencies can sometimes obtain exceptions to the booking limits on fully booked fare classes. In essence, the airline allows the travel agent to book a space in a fare class which is closed. This affects the booking process by increasing the possibility of oversales (and, hence, denied boarding compensation) on fully booked flights and directly thwarts the airline's attempts to maximize revenue. Alternatively, if the desired fare class is closed and an override is not possible, a travel agent may knowingly issue a ticket for a flight without making a reservation. In this case, the traveler is called a "no-rec ", since there is no record of the reservation. No-recs can affect the booking process by increasing the possibility of an oversold flight.
The computer reservations system (CRS) is the computerized system on which reservations are recorded. During the 1960's, all of the major U. S. airlines purchased in-house
computerized reservations systems. The CRS allowed the airlines "... to match passengers to
seats, speed communications among all airlines, contain seat availability on carriers' schedules, and put terminal access in the office of travel agents." (C. R. Smith from Davis, 1987) After several collective attempts to develop a common CRS for travel agencies during the late 1960's and early 1970's, American Airlines, United Airlines, and TWA individually made heavy investments and developed CRS's for travel agencies (and, more recently, consumers on home personal computers). Later, Texas Air and Delta put computer reservations systems in travel agencies. As of 1987, American's SABRE system and United's APOLLO system were by far
the most popular systems among U. S. travel agencies. Together, the two systems were in over two-thirds of the travel agencies in the U. S.
Since two major airlines, American and United Airlines, have control of the major computer reservations systems, there is an inherent conflict of one airline providing information on its competitors' flights. In fact, a number of biases have been found which directly impact the booking process. (Davis, 1987) First, host airlines (owners of the computer reservations systems) can bias the computer screen in order to give their own flights preferential display. This may influence the decision of the travel agent toward the host airline's flights and could result in a decrease in bookings on a competitors flight. As a result of complaints by smaller airlines, the U. S. government has introduced a set of rules which have removed much of the bias from the CRS. Therefore, the impact of these biases has decreased considerably, although some airlines remain concerned about "subtle" biases in the CRS. (Taib, 1990)
Second, host airlines may have access to their competitors' booking data. The host airlines could conceivably use this data to make supply, capacity, and pricing decisions in order to alter the travelers' booking patterns. However, it appears that the vast amount of data has dissuaded any host airline from effectively using competitors' booking data. A third effect of the CRS is that host airlines can have real time communications between the CRS and their in-house seat inventory control system in order to continuously update availability of spaces and fares. Other airlines may have to wait several hours or overnight to update availability on their flights. When spaces are selling quickly, the host airline has an obvious advantage over the other airlines.
Finally, the CRS has allowed airlines to accurately collect booking data, keep track of current bookings on flights which have not yet departed, and impose booking limits on fare
classes. In general, the CRS has increased the accuracy and complexity of the transactions between the airline and the traveler.
2.3.7 The Result of the Economic Interaction: Booking Data
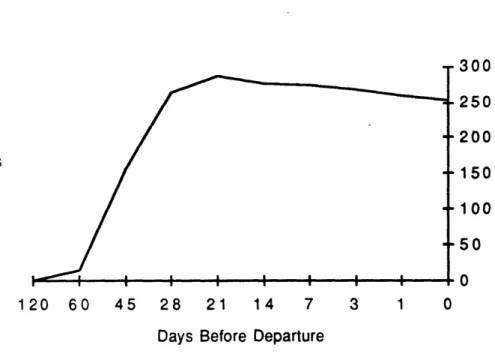
The economic interactions between potential travelers and the airline result in reservations and cancellations in each class on each flight. We define total bookings at any time before departure as the total reservations made up to that time minus the total cancellations made. That is, bookings are the total number of reservations remaining (which have not been cancelled) in the system at any time prior to departure. The booking curve is the graph of total bookings versus the number of days before departure. A sample booking curve is presented in Figure 2.3. In this section, we examine the characteristics of the booking curve and, then, describe the booking data available to the airline.
Total Bookings On-Hand p I I I I 120 60 45 28 Days 21 Before 14 7 Departure
Figure 2.3 Sample Booking Curve