Publisher’s version / Version de l'éditeur:
The Astronomical Journal, 153, 6, p. 264, 2017-06-01
READ THESE TERMS AND CONDITIONS CAREFULLY BEFORE USING THIS WEBSITE. https://nrc-publications.canada.ca/eng/copyright
Vous avez des questions? Nous pouvons vous aider. Pour communiquer directement avec un auteur, consultez la première page de la revue dans laquelle son article a été publié afin de trouver ses coordonnées. Si vous n’arrivez pas à les repérer, communiquez avec nous à PublicationsArchive-ArchivesPublications@nrc-cnrc.gc.ca.
Questions? Contact the NRC Publications Archive team at
PublicationsArchive-ArchivesPublications@nrc-cnrc.gc.ca. If you wish to email the authors directly, please see the first page of the publication for their contact information.
NRC Publications Archive
Archives des publications du CNRC
This publication could be one of several versions: author’s original, accepted manuscript or the publisher’s version. / La version de cette publication peut être l’une des suivantes : la version prépublication de l’auteur, la version acceptée du manuscrit ou la version de l’éditeur.
For the publisher’s version, please access the DOI link below./ Pour consulter la version de l’éditeur, utilisez le lien DOI ci-dessous.
https://doi.org/10.3847/1538-3881/aa6d85
Access and use of this website and the material on it are subject to the Terms and Conditions set forth at
Complex spiral structure in the HD 100546 transitional disk as revealed
by GPI and MagAO
Follette, Katherine B.; Rameau, Julien; Dong, Ruobing; Pueyo, Laurent;
Close, Laird M.; Duchêne, Gaspard; Fung, Jeffrey; Leonard, Clare;
Macintosh, Bruce; Males, Jared R.; Marois, Christian; Millar-blanchaer,
Maxwell A.; Morzinski, Katie M.; Mullen, Wyatt; Perrin, Marshall; Spiro, Elijah;
Wang, Jason; Ammons, S. Mark; Bailey, Vanessa P.; Barman, Travis;
Bulger, Joanna; Chilcote, Jeffrey; Cotten, Tara; De rosa, Robert J.; Doyon,
Rene; Fitzgerald, Michael P.; Goodsell, Stephen J.; Graham, James R.;
Greenbaum, Alexandra Z.; Hibon, Pascale; Hung, Li-wei; Ingraham, Patrick;
https://publications-cnrc.canada.ca/fra/droits
L’accès à ce site Web et l’utilisation de son contenu sont assujettis aux conditions présentées dans le site LISEZ CES CONDITIONS ATTENTIVEMENT AVANT D’UTILISER CE SITE WEB.
NRC Publications Record / Notice d'Archives des publications de CNRC:
https://nrc-publications.canada.ca/eng/view/object/?id=312c9d18-f705-4291-b6b1-1d6af364952f https://publications-cnrc.canada.ca/fra/voir/objet/?id=312c9d18-f705-4291-b6b1-1d6af364952f
Complex Spiral Structure in the HD 100546 Transitional Disk
as Revealed by GPI and MagAO
Katherine B. Follette1,2,30, Julien Rameau3, Ruobing Dong4, Laurent Pueyo5, Laird M. Close4, Gaspard Duchêne6,7, Jeffrey Fung6,30, Clare Leonard2, Bruce Macintosh1, Jared R. Males4, Christian Marois8,9, Maxwell A. Millar-Blanchaer10,31, Katie M. Morzinski4, Wyatt Mullen1, Marshall Perrin5, Elijah Spiro2, Jason Wang6, S. Mark Ammons11, Vanessa P. Bailey1, Travis Barman12, Joanna Bulger13, Jeffrey Chilcote14, Tara Cotten15, Robert J. De Rosa6, Rene Doyon3, Michael P. Fitzgerald16,
Stephen J. Goodsell17,18, James R. Graham6, Alexandra Z. Greenbaum19, Pascale Hibon20, Li-Wei Hung16, Patrick Ingraham21, Paul Kalas6,22, Quinn Konopacky23, James E. Larkin16, Jérôme Maire23, Franck Marchis22, Stanimir Metchev24, Eric L. Nielsen1,22,
Rebecca Oppenheimer25, David Palmer11, Jennifer Patience26, Lisa Poyneer11, Abhijith Rajan26, Fredrik T. Rantakyrö27, Dmitry Savransky28, Adam C. Schneider26, Anand Sivaramakrishnan5, Inseok Song15, Remi Soummer5, Sandrine Thomas21,
David Vega1 22, J. Kent Wallace10, Kimberly Ward-Duong26, Sloane Wiktorowicz29, and Schuyler Wolff19
Kavli Institute for Particle Astrophysics and Cosmology, Department of Physics, Stanford University, Stanford, CA, 94305, USA 2Physics and Astronomy Department, Amherst College, 21 Merrill Science Drive, Amherst, MA 01002, USA
3Institut de Recherche sur les Exoplanètes, Départment de Physique, Université de Montréal, Montréal QC H3C 3J7, Canada 4Steward Observatory, University of Arizona, Tucson, AZ 85721, USA
5Space Telescope Science Institute, Baltimore, MD 21218, USA
6Astronomy Department, University of California, Berkeley, Berkeley CA 94720, USA 7Univ. Grenoble Alpes/CNRS, IPAG, F-38000 Grenoble, France
8National Research Council of Canada Herzberg, 5071 West Saanich Road, Victoria, BC V9E 2E7, Canada 9University of Victoria, 3800 Finnerty Road, Victoria, BC V8P 5C2, Canada
10Jet Propulsion Laboratory, California Institute of Technology, Pasadena, CA 91125, USA 11Lawrence Livermore National Laboratory, Livermore, CA 94551, USA 12Lunar and Planetary Laboratory, University of Arizona, Tucson, AZ 85721, USA
13Subaru Telescope, NAOJ, 650 North A’ohoku Place, Hilo, HI 96720, USA
14Dunlap Institute for Astronomy & Astrophysics, University of Toronto, Toronto, ON M5S 3H4, Canada 15Department of Physics and Astronomy, University of Georgia, Athens, GA 30602, USA 16Department of Physics & Astronomy, University of California, Los Angeles, CA 90095, USA
17Gemini Observatory, 670 N. A’ohoku Place, Hilo, HI 96720, USA 18Department of Physics, Durham University, Stockton Road, Durham DH1, UK 19Department of Physics and Astronomy, Johns Hopkins University, Baltimore, MD 21218, USA
20European Southern Observatory, Alonso de Cordova 3107, Vitacura, Santiago, Chile 21Large Synoptic Survey Telescope, 950N Cherry Avenue, Tucson, AZ 85719, USA 22SETI Institute, Carl Sagan Center, 189 Bernardo Avenue, Mountain View, CA 94043, USA 23Center for Astrophysics and Space Science, University of California San Diego, La Jolla, CA 92093, USA
24Department of Physics and Astronomy, Centre for Planetary Science and Exploration, the University of Western Ontario, London, ON N6A 3K7, Canada
25American Museum of Natural History, Department of Astrophysics, New York, NY 10024, USA 26School of Earth and Space Exploration, Arizona State University, P.O. Box 871404, Tempe, AZ 85287, USA
27Gemini Observatory, Casilla 603, La Serena, Chile
28Sibley School of Mechanical and Aerospace Engineering, Cornell University, Ithaca, NY 14853, USA 29The Aerospace Corporation, 2310 E. El Segundo Boulevard, El Segundo, CA 90245, USA
Received 2016 December 28; revised 2017 April 13; accepted 2017 April 13; published 2017 May 22
Abstract
We present optical and near-infrared high-contrast images of the transitional disk HD 100546 taken with the Magellan Adaptive Optics system (MagAO) and the Gemini Planet Imager (GPI). GPI data include both polarized intensity and total intensity imagery, and MagAO data are taken in Simultaneous Differential Imaging mode at Hα. The new GPI
H-band total intensity data represent a significant enhancement in sensitivity and field rotation compared to previous
data sets and enable a detailed exploration of substructure in the disk. The data are processed with a variety of differential imaging techniques (polarized, angular, reference, and simultaneous differential imaging) in an attempt to identify the disk structures that are most consistent across wavelengths, processing techniques, and algorithmic parameters. The inner disk cavity at 15 au is clearly resolved in multiple data sets, as are a variety of spiral features. While the cavity and spiral structures are identified at levels significantly distinct from the neighboring regions of the disk under several algorithms and with a range of algorithmic parameters, emission at the location of HD 100546 “c” varies from point-like under aggressive algorithmic parameters to a smooth continuous structure with conservative parameters, and is consistent with disk emission. Features identified in the HD 100546 disk bear qualitative similarity to computational models of a moderately inclined two-armed spiral disk, where projection effects and wrapping of the spiral arms around the star result in a number of truncated spiral features in forward-modeled images.
Key words:instrumentation: adaptive optics – planet–disk interaction – protoplanetary disk – stars: individual
(HD 100546)
https://doi.org/10.3847/1538-3881/aa6d85
© 2017. The American Astronomical Society. All rights reserved.
30NASA Sagan Fellow. 31Hubble Fellow.
1. Introduction
Transitional disks were first identified as a circumstellar disk subclass based purely on the peculiar lack of near-infrared (NIR) excess in their spectral energy distributions (SEDs; Strom et al. 1989) relative to full protoplanetary disks. This NIR deficit was hypothesized to result from dust depletion in the inner disk at scales of a few to a few tens of astronomical units, and to be an indication that these disks were in the process of transitioning (through disk clearing) to more evolved debris disks, hence their name. Development of large millimeter interferometers and high-resolution NIR Adaptive Optics (AO) systems have since enabled resolved images of centrally cleared regions in transitional disks at both millimeter and NIR wavelengths. Evidence of ubiquitous disk asymme-tries (e.g., van der Marel et al. 2013; Follette et al. 2015)and recent confirmation of embedded accreting objects in these disks (Close et al. 2014; Sallum et al. 2015a) have lent significant fodder to the hypothesis that transitional disk cavities are a result of ongoing planet formation (Owen2016), at least in some cases.
The disk around the Herbig Ae star HD 100546 (B9Vne, 109 ± 4 pc, 5–10 Myr; van den Ancker et al.1997; Guimarães et al. 2006; Levenhagen & Leister 2006; van Leeuwen2007; Lindegren et al. 2016) was first identified through the large infrared excess and prominent crystalline features in the SED (Hu et al. 1989; Waelkens et al. 1996). The first resolved images of the HD 100546 disk were obtained in NIR scattered light with an early AO system by Pantin et al. (2000). They revealed a smooth, bright, elliptical disk extending to ∼230 au. Subsequent imaging with the Hubble Space Telescope’s NICMOS (Augereau et al. 2001), STIS (Grady et al. 2001), and ACS (Ardila et al. 2007) cameras revealed the disk at increasingly high resolution, and showed for the first time distinct disk asymmetries. Due to its bright central star and complex morphology, HD 100546 has been studied exten-sively, and is the subject of several hundred scientific studies. Therefore, only the most immediately relevant findings to the observations described in this paper are summarized here. We note that the distance to HD 100546 was recently measured by GAIA to be 109±4 pc (Lindegren et al. 2016), which is somewhat larger than the previous estimate of 97±4 pc (van
Leeuwen 2007). We have updated numbers in this paper,
including those from past literature, to reflect this new distance. The HD 100546 disk exhibits complex morphology on a variety of spatial scales. Its features include a large-scale brightness anisotropy along the disk minor axis (Augereau et al. 2001), flaring (Grady et al. 2005), a resolved cavity (Avenhaus et al.2014; Garufi et al.2016), and prominent spiral arms (Boccaletti et al. 2013; Avenhaus et al. 2014; Currie et al.2015; Garufi et al.2016). The moderate disk inclination (42°) further complicates the appearance of the disk, with most features being detected to the north and east of the central star, on the illuminated half (back-scattering) of the disk. Due to its inclination, it is likely that the lack of detected near-side disk features in HD 100546 is a result of a scattering phase function with a relatively low forward-scattering efficiency, though projection effects and obscuration by the disk midplane likely also play a role.
The inner disk cavity has been resolved several times with the VLT Interferometer in the NIR, and extends from 0.8 to 15 au in radius (Benisty et al.2010; Tatulli et al.2011; Panic et al.2014). The outer edge of this inner disk cavity has since
been confirmed by ground-based AO Polarimetric Differential Imaging (PDI; e.g., Kuhn et al.2001)in the NIR and visible (Quanz et al.2011; Avenhaus et al. 2014; Garufi et al.2016) with estimated cavity radii ranging from 12.5 to 17 au. The most recent, highest-resolution measurements, taken with SPHERE by Garufi et al. (2016), suggest that the peak of the inner disk rim may lie slightly farther inward at shorter wavelength (12.5 au at R versus 15 au at H and K ).
A number of studies have uncovered asymmetric structures in the disk beyond the 15 au inner cavity rim. These include spiral arm-like asymmetries, but these features are stationary over five- to nine-year periods, inconsistent with launching by a fast-orbiting inner planet candidate (Boccaletti et al. 2013; Avenhaus et al. 2014; Garufi et al. 2016). Other identified asymmetric disk features include a small-scale spiral arm to the east (Garufi et al.2016)and an arc-like feature (“wing”) along the disk minor axis (Garufi et al. 2016). The nature of these structures is not yet well-understood.
Although visible and NIR observations probe structures in the disk’s surface layers at high resolution, the large particles that make up the disk midplane can only be studied at longer millimeter wavelengths. Millimeter images of the HD 100546 midplane are best reproduced with a two-component model: an outer ring centered at 215 au with a radial extent of 85 au and an inner, incomplete ring (horseshoe) from 30 to 60 au (Pineda et al.2014; Walsh et al. 2014; Wright et al.2015). The inner rim of the thermally emitting millimeter dust cavity is thus a factor of 2–3 more distant than the rim of the NIR-scattered light cavity. Observed variations in cavity radius with wavelength have some precedent in transition disks (Dong et al.2012; Follette et al.2013; Pinilla et al.2015)and can be explained by pressure traps in which large particles are caught while the smallest particles can diffuse closer in (Pinilla et al.2012). This “dust filtration” phenomenon is also predicted from planet–disk interaction models for relatively low-mass planets (Zhu et al.2012).
The disparity between cavity radii derived from NIR and millimeter data, as well as the myriad non-axisymmetric structures observed in the disk suggest, albeit indirectly, that a massive object or objects may be responsible for carving the transitional disk gap in HD 100546. Indeed, a thermal infrared (L′-band, 3.8 μm) planet candidate, HD 100546 b, has been detected with AO observations at 60 au from the central star several times (Quanz et al. 2013, 2015; Currie et al. 2015), although it lies too close to the central star to be responsible for the millimeter-derived outer disk gap at 190 au and too far to be responsible for the cavity interior to ∼15 au. Subsequent Ks-band (2.15 μm) observations of the disk did not reveal a point source at the location of the b candidate (Boccaletti et al.2013), but rather faint extended emission (Garufi et al. 2016). The nature of and physical relationship between the more compact
L′ source and the extended Ks source is a subject for debate, and we discuss this in more detail in the companion to this
paper (Rameau et al. 2017), which is focused on the HD
100546 b planet candidate.
Another candidate object (HD 100546 “c”) was also put forward to explain the spectroastrometry of the CO and OH emission lines in HD 100546 (Brittain et al. 2014), at a separation of ∼15 au, just inside of the NIR inner disk rim. However, the planet explanation for the spectroastrometric signature has been called into question by Fedele et al. (2015). Using the Gemini Planet Imager (GPI; Macintosh et al.2014),
the direct detection of a second planet candidate (HD 100546 “c”) at the H-band has also been put forward (Currie et al.2015), but has yet to be confirmed.
In this paper, we report observations of HD 100546 obtained with GPI as part of the GPI Exoplanet Survey (GPIES) and with the Magellan Visible AO camera (VisAO) as part of the Giant Accreting Protoplanet Survey (GAPlanetS; K. Follette et al. 2017, in preparation). These high-resolution multiwavelength images reveal fine structures that can be compared to images obtained with other AO instruments and to model images to assess their robustness to various processing techniques. A companion paper will focus on GPI and Magellan Adaptive Optics (MagAO) System derived limits on the emission from planet b (Rameau et al.2017), while this paper will focus on the revealed disk structures and limits on planet “c.”
When imaged with AO systems, point sources such as stars are surrounded by a halo of light from uncorrected or miscorrected wavefront errors. Instantaneously and monochro-matically, this point-spread function (PSF) consists of an interference pattern of “speckles” of size similar to the diffraction limit of the telescope. In long exposures, this speckle pattern partially smoothes out as the wavefront changes, but retains some structure on timescales of minutes or longer (“quasistatic speckles”) due to static optical errors, as well as asymmetries, e.g., due to stronger wavefront errors along the direction of wind propagation.
The surface brightness of the HD 100546 disk is lower than that of the stellar halo and hence this halo must be removed through PSF subtraction. The application of these algorithms are discussed in detail in Section2.1.2. It is important to note, however, that PSF subtraction algorithms are typically optimized for point source extraction. Many groups have now demonstrated success at extracting disks with these algorithms (e.g., Milli et al.2012; Rodigas et al.2012; Mazoyer et al. 2014; Perrin et al. 2015); however, the majority of successful extractions have been of debris disks with either edge-on or ring-like morphologies. Young, extended disks, and in particular disks with moderate inclination such as HD 100546, are more problematic because their large angular and radial extent means that disk emission at a given location is present in many (if not most) reference PSFs. This has led some to question the reality of structures visible after aggressive post-processing (e.g., Boccaletti et al.2013).
GPI and VisAO observations and image processing are described in Section 2. Measurements derived from these processed images are presented in Section3. Interpretation of these results, as well as a qualitative comparison of our results to planet-driven spiral disk model images processed in a similar manner, is discussed in Section4. We provide conclusions in Section5. Constraints on the b planet candidate are presented in a companion to this paper (Rameau et al.2017).
2. Observations and Data Reduction
2.1. GPI Data
Initial GPI observations of HD 100546 were taken in H-band spectroscopic mode (hereafter H-spec) using Angular Differ-ential Imaging (ADI; Marois et al.2006)as part of the Gemini Planet Imager Exoplanet Survey (GPIES). Follow-up observa-tions were conducted in both spectroscopic and polarimetric modes based on extended structures suggested by this preliminary data set. A full summary of the GPIES observa-tions is given in Table1. All initial reductions were done using the GPI Data Reduction Pipeline (DRP) version 1.3.0 (Perrin et al.2014,2016). We refer the reader to these papers for full details of the GPI DRP. In brief, the GPI DRP subtracts dark background, interpolates over bad pixels, corrects for DC offsets in the 32 readout channels, and converts from raw 2D IFS frames to 3D datacubes. In the case of spectral data, argon arc lamp exposures taken both at the beginning of the night and immediately prior to the science exposure sequence are used for wavelength calibration, and the locations and fluxes of the four satellite spots created by the apodizer are used to compute and apply astrometric and photometric calibrations. In the case of polarimetric data, the pipeline assembles a full Stokes datacube from the sequence of exposures.
2.1.1. Polarimetric Data
Y-band polarimetric images (hereafter Y-pol) were first
attempted on 2015 January 30; however, the sequence was aborted due to poor conditions. The data set we analyze in this work was collected on 2016 January 28. Data were taken using the shortest GPI filter (Y-band, 0.95–1.14 μm) and accompany-ing Y-band coronagraph because this mode affords the highest angular resolution and has the smallest coronagraphic inner
Table 1
Summary of Gemini and Magellan Data Sets
Instrument Date Observing Mode nimages tint/frame ncoadds tinttotal θrot Avg. seeinga
(sec) (min) (deg) (″)
MagAO 2014 Apr 11 Hα SDI 3423 2.273 1 129.7 73.5b 1.05
MagAO 2014 Apr 12 Hα SDI 4939 2.273 1 187.1 71.6 0.58
GPI 2014 Dec 17a
H-spec 33 60 1 33 12.9 L
GPI 2015 Jan 30a Y-pol 14 60 1 14
L 0.63
MagAO 2015 May 15 Hα SDI 2077 2.273 1 78.7 42.0 0.46
GPI 2016 Feb 27 H-spec 120 60 1 120 51.6 0.66
GPI 2016 Jan 28 Y-pol 62 15 4 62 L 0.69
Notes.Bolded rows represent the three highest-quality data sets, which are used for the bulk of the analyses in this paper.
aThe instrument and method for measuring seeing varies by telescope and observing run. Magellan seeing values are derived from measurements taken at the Baade telescope. Gemini South has both MASS and DIMM seeing monitors; however, only the DIMM was functioning on 2014 April 11, 2014 April 12, and 2015 January 30 and neither was functioning on 2014 December 17. On 2015 February 27 and 2016 February 28, both were online and seeing recorded by the two instruments has been averaged.
bAlthough this data set has a total of 73 . 5 rotation, the space is not evenly sampled and there is a 10° gap in rotational space while the system was pointed at an NIR reference PSF star.
working angle (0 078), allowing us to probe the very inner regions of the disk near the HD 100546 “c” source and inside the inner cavity rim. Standard PDI waveplate cycles of 0 , 22 . 5, 45 , and 67 .5 were employed in order to allow for double difference polarized imaging (Kuhn et al.2001; Perrin et al.2004; Hinkley et al.2009; Hashimoto et al.2011), and the 60 s images were taken as four 15 s coadds in order to avoid saturating the inner region of the images.
Generation of the Stokes cubes was done using the standard polarimetry recipes available in the GPI pipeline and described in detail in Perrin et al. (2014)and Millar-Blanchaer et al. (2015); however, three modifications were made to the standard polarization recipe. First, we assumed a perfect half waveplate rather than the default lab-measured waveplate retardance. We have found in some cases that this improves the final image quality, as measured by the amount of residual signal in the Ur image (see next paragraph). The mean stellar polarization was estimated for each datacube individually from the normalized difference of the two orthogonal polarization slices in the region
r
0< < pixels (r5 < ), which is beneath the focal plane0. 07 mask. Light that lies in this region should be composed primarily of starlight diffracted around the FPM, and any polarized signal is most likely induced by the instrument optics if we assume that the starlight is intrinsically unpolarized. The mean normalized difference in this region is scaled to the total polarized flux in each pixel before removal. For more details about the specifics of this estimation, see Millar-Blanchaer et al. (2016). Finally, we smoothed the processed images with a two-pixel FWHM Gaussian kernel before combining into the Stokes cube (I, Q, U, V) in order to mitigate microphonics noise (Ingraham et al.2014).
The Stokes cube generated by the GPI DRP was transformed to a radial Stokes cube (I, Q Uf, f, V; see Schmid et al.2006) via the same method as in Millar-Blanchaer et al. (2015). Under this convention, all polarized signal oriented parallel or perpendicular to the vector connecting the pixel to the central star is encompassed in the Qf image, and all signal oriented at ±45° is encompassed in the Uf signal. The Qf image thus contains the centrosymmetric polarized disk signal in the case of single scattering, and the Uf image is an approximation of the noise, under the assumption that the contribution of multiple-scattered photons is small.
The final Qf and Uf images are shown in Figure 1 and
discussed in detail in Section3.1.
2.1.2. Spectroscopic Data
The H-spec coronagraphic data set taken on 2014 December 27, while nominally a full GPI sequence, had low overall field rotation (12 . 9 ), and its utility was compromised as a result. For this moderate inclination and highly extended disk, a large amount of field rotation is necessary to minimize disk self-subtraction and extract robust disk structure, therefore we followed up this initial observation on 2016 February 27 with a two-hour on-sky sequence, reaching 51 . 6 field rotation under good weather conditions (see Table 1). Results based on these later observations are presented in this paper.
The GPI DRP processes the raw data through dark subtraction, wavelength calibration based on observations of an argon arc lamp (Wolff et al. 2014), bad pixel identification and interpola-tion, microspectra extraction to create x y( , , l)datacubes (Maire et al. 2014), interpolation to a common wavelength axis, and distortion correction (Konopacky et al. 2014). Astrometric calibration (platescale of 14.166 ± 0.007 mas/pixel, position
angle offset of 0.10- ) was obtained with observations0 . 13 of theq Ori field and other calibration binaries following the1 procedure described in Konopacky et al. (2014).
Further post-processing was also done using the GPI DRP. The 3D datacubes were first aligned using the photocenter of the four satellite spot positions (Wang et al.2014). To remove slowly evolving large-scale structures, the datacubes were high-pass filtered using a smooth Fourier filter with cutoff frequencies between 4 and 16 equivalent-pixels in the image framework, allowing us to investigate disk features on different spatial scales. Since this step strongly affects the apparent geometry of the disk, the two extremes of these cutoff frequencies, as well as images without any high-pass filter applied, are discussed and shown in Section3.2.
The stellar PSF was estimated and subtracted from each image in the sequence using several ADI algorithms: classical Angular Differential Imaging (cADI; Marois et al. 2006), Locally Optimized Combinations of Images (LOCI; Lafrenière et al.
2007), and Karhunen–Loève Image Processing (KLIP, a form of Principal Component Analysis; Amara & Quanz2012; Soummer et al. 2012) via a custom IDL pipeline. Using different ADI algorithms was mandatory in the analysis of this inclined, asymmetric, bright, and extended transitional disk to better assess the robustness of resolved structures against residual speckles, which manifest themselves differently in the post-processed images computed by each algorithm. For all three algorithms, residual images were rotated to align north with the vertical, combined with a 10% trimmed mean (discarding the highest and lowest 5% of pixel values in the temporal sequence), and collapsed over the wavelength axis to create a final broadband image.
cADI processing has no tunable parameters. The stellar PSF subtracted from each image is simply the median of the entire image cube, and the PSF-subtracted images are then rotated to a common on-sky orientation before combining. This method therefore is not capable of removing evolving PSF features, but it provides a good estimate of the most static PSF structures. Though mitigated by the large amount of field rotation, the disk extends azimuthally over more than the 51°.6 of rotation in the data set, so some disk emission survives into the median PSF, resulting in negative “self-subtraction” regions at the edges of the disk.
LOCI analysis was done with annuli of dr=5 pixels, optimization region of NA=500 FWHM (3.6 pixels at the
H-band), geometry factor g=1, and minimum separation
criterion Nd=1FWHM.
KLIP analysis was done on a single image region from 5 to 100 pixels in radius (0 07–1 42) and keeping only the first one to five Karhunen–Loève (KL) modes. Although KLIP is typically used for point-source searches with more zones and a greater number of KL modes, this single-zone, small number of KL-mode approach is standard for minimizing self-subtraction of extended disk features.
The PSF was also subtracted using the Reference Differ-ential Imaging technique (RDI) implemented in the TLOCI quick-look processing pipeline (an evolution of the SOSIE pipeline; Marois et al.2010). A library of reference images was created from 426 H-band datacubes (all GPIES campaign observations taken in pupil-stabilized mode at the H-band at the time of processing). Data from each reference sequence were first reduced with the GPI DRP in the standard manner described previously. Additionally, each image in an object sequence was high-pass filtered using an 11 pixel (0 16, 4 λ/D) square unsharp mask, magnified to align speckles
across wavelength channels, flux normalized so that the satellite spot intensities were the same in each channel, and wavelength collapsed (only slices 5–31 were used to avoid the noisy wavelength slices at the end of every GPI spectral cube). These high-pass filtered, aligned, normalized, and wavelength-collapsed images were then median-combined for each object sequence and scaled to the flux of the target star using the satellite spots, allowing us to gather a homogeneous library of achromatic speckle-limited images with greatly
reduced disk, planet, or background star signals. The HD 100546 DRP images were processed through the TLOCI RDI pipeline using only the 20 most correlated reference images in this PSF library to subtract the speckle noise. Reference images were selected by performing a cross-correlation analysis in a [15–80] pixel (5.4–28.6l D, 0 212–1 133) annular region to
avoid the focal plane mask edge.
RDI, cADI, LOCI, and KLIP images are shown in Figure2
and are discussed in detail in Section3.2.
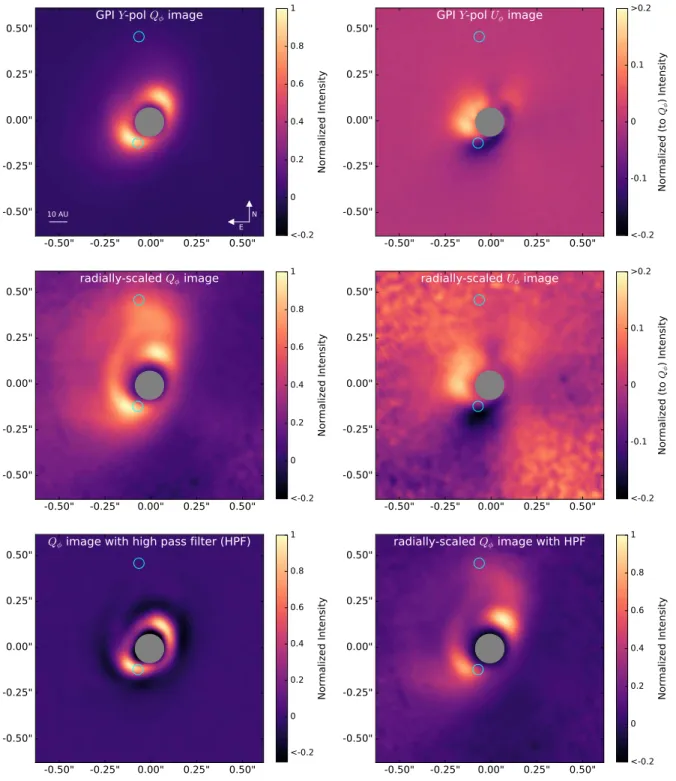
Figure 1.GPI Y-band radial polarized intensity (QR)images. Top left: the GPI Qfimage. Top right: the GPI Ufimage, normalized relative to the peak value of the Qf
image and shown with a tighter stretch so that the structures are visible. Middle left: the Qfimage scaled by r2for a disk inclined at 42° along a P.A. of 145°. Middle
right: the same r2scaling applied to the U
fimage. Lower left: the Qfimage with a four-pixel Fourier high-pass filter applied. Lower right: the r2scaled Qfimage with
a four-pixel Fourier high-pass filter applied. The northeastern spiral is readily apparent extending from the eastern disk rim toward the north in all but the unaltered Qf
image. Cyan circles indicate the locations of the candidate “b” and “c” protoplanets, and the gray circles indicate the GPI Y-band coronagraph occulter. All images have been normalized by dividing by the peak pixel value.
2.2. Magellan VisAO Data
High-contrast, visible light, AO observations were conducted at the Magellan Clay telescope with the MagAO System (Morzinski et al. 2016, 2014) and its visible light camera (VisAO; Males et al. 2014). The observations were conducted in Hα Simulta-neous Differential Imaging (SDI) mode in which a Wollaston prism is used to split the beam into two channels, and each is passed through a separate narrowband filter, one centered on the Hα emission line (656 nm, Δλ=6 nm) and one centered on the nearby continuum (642 nm, Δλ=6 nm). The continuum image serves as a sensitive and simultaneous probe of the stellar PSF.
GAPlanetS data are reduced with a custom IDL pipeline. Raw data frames are bias subtracted and divided by a flat field generated from R-band twilight sky observations. Dust spots in the instrument optics create significant throughput effects and can create point-like artifacts, but are clearly revealed in the flat field. They are not effectively removed by simply dividing by the flat field (why is unclear), and we therefore mask all pixels within 2 pixels of a region with <98% throughput. This mask is applied to all data frames before further analysis.
The bias-subtracted and flat-fielded raw images are then separated into line (e.g., Hα) and continuum channels. Individual channel images are registered against a high-quality
Figure 2.GPI H-band total intensity images of HD 100546 using different algorithms. The reduction algorithms increase in aggressiveness from top to bottom, and are described in detail in the text. The locations of the candidate protoplanets “b” and “c” are marked with cyan circles. All images have been normalized by dividing by the peak pixel value. The RDI image has been log-scaled to reveal faint outer disk structures, but this is impractical for the other images, which have large self-subtraction regions.
individual data frame. The center of rotation is found through a custom centering algorithm that locates the center of circular symmetry in the median collapsed registered datacube by finding the point that minimizes the standard deviation of intensity in annuli centered at that point. We find that this algorithm performs better than radon transform or center of rotational symmetry algorithms for VisAO data, as measured using a binary of well-known separation and P.A.
Although a minimum integration time of 2.273 s was used in all cases, the HD 100546 observations were saturated at radii interior to 7 pixels in all data sets. This was noted during observations; however, we opted to saturate the very inner region rather than decrease detector gains and therefore sensitivity. We apply a software mask of r=8 pixels to all data before centering, and exclude pixels interior to this radius in our KLIP reductions.
It is important to note that although Hα emission is typically thought of as an accretion tracer, disk-scattered light also makes a significant contribution at this wavelength, particularly in cases where the star itself is actively accreting. In fact, disk-scattered light is ubiquitous even in PSF-subtracted images because of the extended and moderately inclined nature of the HD 100546 disk. The MagAO system was designed to utilize the simultaneous nature of our Hα and continuum observations to remove both direct starlight and disk-scattered light contributions that are equivalent in the two filters. We compensate for the difference in stellar (and therefore scattered light) brightness between the two filters by subtracting a scaled version of the simultaneous continuum image from each Hα image before further processing. The scaling factor is determined iteratively as the value that results in minimized noise residuals in the region 8< <r 27 pixels (representing the region between where the saturated images reach linearity and the inner boundary of the AO control radius). Scaling and subtracting the continuum image in this way effectively removes the contribution of scattered-light disk structures and diffracted starlight from the images. Because accreting protoplanets are expected to exhibit Hα excess and to not have a detectable level of continuum emission, this strategy should eliminate starlight and disk-scattered light preferentially, leaving behind pure Hα emission. It is the KLIP-processed versions of these SDI images that we use to place constraints on Hα emission from accreting protoplanets in these data sets.
KLIP images are generated using the MagAO interface of pyKLIP, a Python implementation of the KLIP algorithm (Wang et al.2015). Of particular importance to the discussion in this paper is the fact that the final images are very sensitive to our choice of KLIP parameters, notably zone size and masking parameters. Although not exhaustive, we explore a wide region of this parameter space in order to assess the robustness of the parameters we extract, as reported in Section3. The AO control radius for the MagAO system lies at r=35 pixels in our images, and we find that the region 27< <r 42pixels is particularly noisy as a result, with many short-lived speckles that are not well-subtracted with KLIP. We therefore mask this region in each image before KLIP processing to avoid the appearance of spurious structures in the final reductions.
The moderate inclination of the disk means that disk structures cover wide swaths in azimuth, and aggressive KLIP reductions can be potentially problematic. We find that KLIP reductions with small to moderate exclusion criteria (e.g., allowing images where a planet would have moved by fewer than 8 pixels within a given annulus) result in large heavily
self-subtracted regions and turn extended disk features into spurious point sources.
We elect the least-aggressive exclusion criterion possible for each data set, excluding all images from the reference library where a hypothetical planet located in the center of an annulus would have moved by fewer than a given number of pixels, where that number is as large as possible. For the 2014 data set, this is 12 pixels, corresponding to 33° of rotation in the innermost annulus before an image is included in the reference library. For the 2015 data set, this is 8 pixels, corresponding to 21° of rotation. Since the maximum exclusion criterion is nearly twice as aggressive in the case of the 2015 data set, it is unsurprising that the disk rim is not as cleanly revealed as in the 2014 reductions.
KLIP-processed Hα, Continuum, and SDI images for both
epochs are shown in Figure 3 and discussed in detail in
Section3.3.
3. Results
3.1. GPI Y-band Polarimetric Imagery
GPI Y-pol images, shown in Figure 1, clearly resolve the scattered light cavity rim. There are distinct bright lobes along the disk major axis; however, these are symmetric about the star, and we see no evidence in these data of anything unusual at the location of the purported HD 100546 “c” point source.
The corresponding GPI Uf image shows a non-zero signal, peaking at ∼20% of the value of the Qfimage with most of the signal localized east of the star and just outside the coronagraph. This is potentially an effect of instrumental polarization, but a non-zero signal in UfHD 100546 images has been seen before (albeit with a different signal morphology; Avenhaus et al.2014; Garufi et al.2016), and may be a result of physical rather than instrumental effects. For example, multiple scattering is expected to create non-zero Uf signals (Canovas et al.2015).
In order to compensate for the purely geometric r-2dropoff in stellar scattered light, we scaled the images by r2 for a disk inclined at 42° along a P.A. of 145°, a common practice in the field for revealing fainter extended structures in the outer disk. We note that we apply this scaling only to highlight faint disk features and that any asymmetries in brightness or location of disk features along the minor axis are impacted by the inclined, vertically extended and optically thick nature of the disk, which will tend to artificially enhance the illuminated half of the disk. The r2-scaled images do, however, effectively reveal a faint extended feature connected to the southeastern disk rim and extending to the north, which we will refer to hereafter as the “northeastern spiral.” This feature is also effectively revealed with a simple four-pixel Fourier high-pass filtering of the original image. This and other morphological features revealed in GPI and MagAO imagery are discussed in detail in Section4.1.
Radial profiles taken through the GPI Y-pol images, shown in Figure4, reveal that there is no significant deviation between profiles taken to the east and west along the major axis, despite the proposed existence of a planet candidate along the eastern major axis. The profiles peak at 0 14, suggesting a cavity rim at 15 au. This is marginally inconsistent with the cavity radius estimated with SPHERE at an R of 12.5±1 au, but quite consistent with the range of estimates (15–17 au) in the literature for the NIR cavity rim.
The minor axis profiles are significantly different both in radial extent and in absolute intensity along the northern and southern minor axes; however, this is an expected effect. The greater radial extent and brightness of the northern minor axis profile is consistent with it being the illuminated half of the disk, and is likely affected by both the geometry of the disk and the scattering phase function.
Given the dearth of successful detections of polarized light from young planets in the literature (only upper limits; e.g., Jensen-Clem et al.2016), it is perhaps unsurprising that there is no evidence of a point source at the location of HD 100546 “c” in the Y-pol image; however, there is a clear polarized disk structure at this location, and its smoothness and symmetry with respect to disk features opposite the star are surprising in the context of a planet at or near this location.
3.2. GPI H-band Spectroscopic Imagery
PSF-subtracted H-band images processed through a variety of reduction techniques are shown in Figure 2, and these techniques increase in aggressiveness toward the bottom of the figure. The apparent morphology is somewhat sensitive to the image processing technique. In particular, less aggressive PSF subtraction techniques (RDI, cADI) result in images that are dominated by an arc of emission extending from SE to NW. A number of additional, fainter structures resembling spiral arms are present to the south and east of the star, including several in the RDI and cADI images. Aggressive processing with LOCI and KLIP highlights these features further and reveals additional fainter structures; however, these aggressive techni-ques suppress the more extended arc of emission apparent in the cADI and RDI reductions.
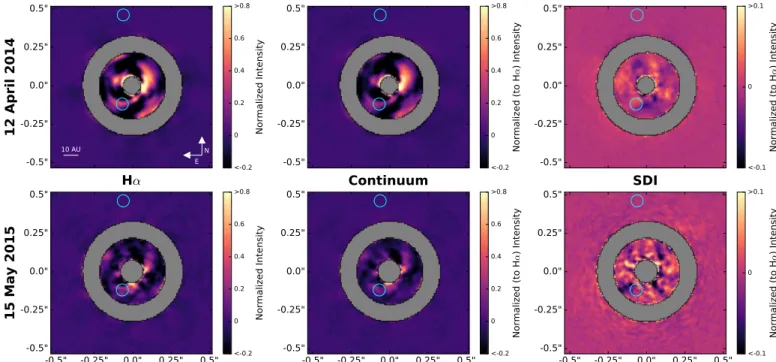
3.3. MagAO Hα SDI Imagery
MagAO images are shown for both the Hα and continuum channels, as well as SDI images (Hα−scale×continuum) in Figure3. The structures in processed continuum images closely mimic the structures in the Hα images, which point to their common origin as disk-scattered light. Both images reveal an arc of emission consistent with the forward-scattering portion of the disk rim.
Figure 3.MagAO Hα SDI images of HD 100546 from 2014 April 12 (top) and 2015 May 15 (bottom). The Hα (left panels) images are dominated by scattered light structures at or near the disk rim. These features are closely mimicked in the continuum images (middle panel), albeit at slightly lower intensity due to stellar Hα excess and their scattered light nature. The rightmost panels represent the SDI images for each data set, generated by scaling and subtracting the continuum images from the Hα images and combining. No Hα excess sources are visible in either SDI image, including at the locations of the HD 100546 “b” and “c” planet candidates. The region surrounding the AO control radius, where spurious speckle structures dominate KLIP reductions, has been masked in all images. All images have been normalized by dividing by the peak pixel value in the Hα image for that epoch.
Figure 4. Radial profiles for the Y-band radial polarization image along the major (black diamonds) and minor (blue stars) axes. In each case, the profile is averaged across the two sides of the disk, but the individual profiles are also shown as dashed lines to assess symmetry. The eastern and western major axis profiles are virtually identical, suggesting that there is no significant asymmetry in the peak brightness or the location of the disk rim along the major axis. The brighter and more distant peak of the northern minor axis profile relative to the southern one is expected given that the north part is the illuminated half of the disk, as explained in the text.
The importance of field rotation in the identification of high-fidelity disk features is apparent in the 15 May 2015 images, which had significantly less field rotation (42°.0) than the 12 April 2014 images (71°.6). The same forward-scattering inner disk rim is seen in this case, but it appears clumpy, and structures along it might even be mistaken for point sources.
The SDI images for both data sets, on the other hand, are free of extended scattered light structures. This points to the effectiveness of the process of scaling and subtracting the continuum image before KLIP processing. The images are also, unfortunately, free of any Hα excess point source candidates. This is perhaps unsurprising at the location of the b candidate, as it is embedded in the disk and very little dusty material is needed to extinct visible light emission. However, it is somewhat surprising at the location of the “c” planet candidate, which should be minimally extincted if it lies interior to the disk rim and inside of the relatively dust-free disk cavity. Quantitative constraints on detectable contrast levels for the “c” planet are discussed in Section4.2.
It is important to note that the MagAO images presented here have markedly lower Strehl ratios than the GPI images, due to the fact that AO correction is significantly more difficult to accomplish in the visible than in the NIR since a given optical path difference will correspond to a larger fraction of a wavelength in visible light and naturally produce lower Strehl ratios. How much lower is difficult to estimate given the difficulty of measuring Strehl ratios in general and in saturated data in particular, but they are on the order of ∼10%–20% with MagAO at Hα, ∼25%–35% for the GPI Y-pol data set, and ∼65%–75% for the GPI H-spec data set. At the same time, the MagAO images benefit from the higher resolution afforded by visible light imaging, which compensates in part for the lower Strehl imagery.
4. Discussion
4.1. Multiwavelength Features
In the previous section, we discussed features revealed in each data set individually. Here, we discuss how these multiwavelength data complement one another. With the exception of polarized data, where post-processing is minimal, it is unclear from a single data set alone whether all apparent disk features are true disk structures or artifacts of overly aggressive PSF subtraction processes. Such techniques have two problems when applied to disks in general, and moderately inclined disks for which significant disk emission survives into reference PSFs in particular. First, surface brightness measure-ments are severely complicated by disk self-subtraction (Milli et al.2012), and we therefore do not attempt them in this work. Second, the morphology of complex disk structures can be compromised and spurious point-like artifacts introduced by self-subtraction. By overlaying the three data sets we have obtained and comparing them with features identified pre-viously in the literature, we attempt to address this second point and identify the most robust disk features.
All three data sets can be seen on the same angular scale in the top panel of Figure5, and the bottom panel shows pairs of images overlaid on one another. The smaller coronagraphic mask in the GPI Y-pol data set and the non-coronagraphic MagAO data allow us to fill in features in the very inner disk region, and the higher sensitivity of the H-spec data allows us to probe features in the outer disk. We have selected the H-spec
cADI processed data set with a four-pixel high-pass filter for this analysis as it is less aggressive than the KLIP and LOCI-processed images, but reveals more of the faint disk features than the other cADI images (the high-pass filter serves to sharpen the disk features and therefore mitigates the azimuthal extent of the self-subtraction). The overlays reveal several very robust features present in multiple data sets, including the inner disk rim and the northeastern spiral arm.
We label the most prominent revealed features from all three data sets in Figure 6 and discuss them below. We aim here simply to identify and name the most robust features and to compare them to features previously identified in the literature. A detailed discussion of the physical nature of these features, and the spiral arms in particular, is beyond the scope of this work, although we do engage in a brief qualitative comparison with spiral disk models viewed at moderate inclination in Section4.3.
Global Near/Far Side Asymmetry—The near side of the disk
(inclined toward the observer, here the SW side) appears mostly featureless in all three images, whereas most of the structures are present on the far side (NE). This is a natural effect of observing an inclined flared disk, wherein the near-side disk geometry causes surface features to be compressed in projection or even shadowed from view by the disk midplane. The H-spec data also reveal a bright lane to the southwest, indicated with an “A” in Figure6. This feature may be the front edge of the bottom (opposite the disk midplane) side of the disk, as discussed in Section4.3. A similarly offset bright lane feature was recently detected by de Boer et al. (2016) in the disk of RXJ1615.3-3255 (Feature A1).
Inner Cavity—The inner cavity rim seen in both our GPI
Y-pol data (Figure1)and MagAO data (Figure3)and indicated with a cyan ellipse in Figure6is extremely robust. Its existence is consistent with the NIR deficit in the SED of HD 100546 and with previous resolved images with VLT/NaCo (Avenhaus et al.2014)and VLT/SPHERE-ZIMPOL (Garufi et al.2016), though its location in the Y-pol radial profiles is marginally inconsistent with the latter. The potential for disk self-subtraction to affect the apparent location of the disk rim, as well as the close proximity to the H-band coronagraph preclude robust measurement of the disk rim location in total intensity at the H-band or Hα. Therefore, we defer discussion of whether the marginal inconsistency of our Y-pol disk rim radius with the shorter-wavelength SPHERE data is a wavelength-dependent effect for future work.
Disk “Wings”—All three of our data sets also reveal an
extended arc of emission that runs through and beyond the southern rim of the disk cavity. With aggressive processing, this rim feature can appear sharp, but less aggressive subtractions suggest that it is in fact quite extended. It coincides with the sharp features labeled S5 and S1 in Figure6, but can best be seen in its extended form in the cADI and RDI images of Figure2. It is unclear whether the sharper features that we have labeled S5 and S1 are spirals embedded in that bright wing of emission or are that same feature made sharper by ADI processing. These “wing” features are the brightest and most distinct features far from the star, and have been identified in several previous studies (Currie et al. 2014, 2015; Garufi et al.2016).
Spiral Arms—The spiral feature labeled S3 in Figure 6 is
clearly visible in the minimally processed Y-pol data, and this also coincides with a brighter region in the Magellan data,
though only a portion of it is visible inside of the masked AO control radius region, as revealed by the lower right panel in Figure 5. The Y-pol structure is also contiguous with H-spec emission that curves toward the feature labeled S2, and it is
likely that these two features are part of the same spiral arm. This S3–S2 arm was also seen, though similarly broken, in the deep SPHERE/ZIMPOL polarimetric imagery reported in Garufi et al. (2016) and by Avenhaus et al. (2014). The geometry of this feature is puzzling if it is contiguous, as the apparent curvature back toward the star would suggest that S2 is at least in part a near-side feature, yet it does not obscure the cavity. Future deep polarimetric imaging is needed to under-stand the nature of this feature.
The inner parts of the S1 and S5 features are coincident with the disk “wings” described above, but the S1 feature curves inward more sharply and is consistent with the “Northern arm” identified in Garufi et al. (2016). It may be contiguous with the feature labeled S4, though, like the apparent S3–S2 spiral, this S4–S1 spiral is broken. The S4 spiral feature is faint and lies in a region near the bright disk wings that is especially heavily affected by disk self-subtraction, but it too has been seen in previous imagery and is labeled “spiral 2” in Currie et al. (2015).
The spiral feature S6 is also apparent in both MagAO and GPI H-spec data, though there is a break in the revealed feature approximately midway along the line labeled S6. This is the only such feature present on the near (SW) side of the disk major axis in our data. It may be a continuation of a spiral originating on the other side of the disk (S3/2 or S4/1), or it may be a secondary spiral arm mirroring a northern spiral. Similar “Southern Spirals” were identified in Garufi et al. (2016), albeit farther out. The Garufi et al. (2016) SPHERE
Figure 5.Top panels (left to right): MagAO Hα, GPI H-band total intensity, and GPI Y-band QRpolarimetric image of HD 100546 on the same physical scale. The
MagAO data were processed using KLIP with five KL-modes and parameters as described in the text, and the unreliable saturated and control radius regions are masked in gray. The GPI H-spec data have been broadband collapsed, combined via classical Angular Differential Imaging, and processed with a four-pixel Fourier high-pass filter to reveal the sharper disk structures. The H-band coronagrapic mask is shown in gray. The GPI Y-band polarized differential image was processed with a four-pixel high-pass Fourier filter to reveal the northeastern spiral arm. Bottom panels: zoomed overlays of the images in the upper panels to allow for feature comparisons. Left: MagAO contours overlain on GPI H-spec data reveal that the southern spiral arm is contiguous between the two data sets. The region of the MagAO image that lies inside the GPI coronagraphic mask is shown with a different colorscale. Middle: GPI Y-pol contours overlaid on the GPI H-spec image show that the innermost arc of emission in the H-spec data is coincident with the disk rim and that the arc of emission stretching to the northeast in the H-spec data is coincident with the northeastern spiral of the Y-pol data. Right: GPI Y-pol contours overlain on the MagAO Hα image.
Figure 6.Sum of GPI Y-pol data (with a four-pixel high-pass Fourier filter), GPI H-spec data (cADI with a four-pixel high-pass Fourier filter), and MagAO Hα data (from 2014 April 12) HD 100546 data sets. Each image was normalized by dividing by the peak pixel value before summation. Identified features are labeled with aqua (S1–6) and green (A) lines while the dotted white line indicates the disk major axis.
K-band total intensity images reveal the same feature we have
identified as S6, though it is not labeled by the authors as a feature of particular note.
We engaged in a brief exploratory modeling effort, described in Section 4.3, in an attempt to understand the identified disk structures and the effect that PSF processing can have on them. However, much work remains to be done in this area.
4.2. Limits on the HD 100546 “c” Planet Candidate
Our MagAO Hα and continuum data and GPI H-spec data reveal a bright apparent point source at r=145 mas and P.A.= 152° after aggressive PSF subtraction and/or aggressive high-pass filtering (see Figure7). This is consistent with the location of the candidate protoplanet put forward by Brittain et al. (2014) and supported by analyses in Currie et al. (2015) using a previous GPI H-band data set, so appears at first glance to be a promising planet candidate detection.
However, it can be seen that this apparent point source is located at the intersection of the disk rim with the northeastern spiral arm and is mirrored by another concentrated knot of emission on the opposite side of the major axis. Although the symmetry of these features and coincidence with spiral arm intersections do not definitively rule out the existence of an underlying point source at the location of the “c” candidate, they do raise questions regarding its nature. The discovery paper by Currie et al. (2015)allowed for the possibility that this feature is a disk artifact, and we explore that scenario in this section.
To assess the hypothesis that the “c” candidate is a disk artifact, we engaged in two lines of inquiry.
GPI Spectra—The contrasts of two knots of emission
(indicated with circles in Figure 7), one at the location of the “c” candidate and the other at the same location on the opposite side of the star, were extracted from our GPI H-band data using aperture photometry with a radius of 0.75×FWHM (3.6 pixels) using the four-pixel high-pass filtered PCA (KL=1) reduced wavelength images. Spectra of these knots were obtained after normalization with the spectrum of the star,
obtained from the average of 10,400 and 10,600 K
BT-NextGen models (Allard et al. 2012) and binned to the
resolution of GPI. Since the two knots lie at the same stellocentric separation, they suffer from equivalent self-subtraction due to ADI and so have the same approximate uncertainties. Since we were only interested in the ratio of the two spectra, we rely on this symmetry to cancel out systematics due to PSF subtraction processing. Results are shown in Figure7(right panel). Not only does the spectrum of the source at the location of candidate “c” closely match the spectrum of the opposing knot of emission, it also shows no significant deviation from the spectrum of the star, pointing to a scattered light disk origin and showing no indication of an underlying planetary photosphere.
MagAO SDI Imagery—If the “c” candidate were indeed a
protoplanet lying inside the disk gap, we might expect it to be actively accreting as gas passes through the dust cavity en route to the still-accreting central star. The cavity is also depleted in small dust grains, and therefore any Hα emission from such an accreting protoplanet should be minimally extincted. Indeed, detecting actively accreting protoplanets through Hα emission is the primary motivation behind the GAPlanetS campaign, and this method has been successful twice before (Close et al.2014; Sallum et al.2015b).
Certain aggressive KLIP reductions of the 2014 April 12 MagAO data also reveal a point source candidate at the location of HD 100546 “c;” however, a similar point source is also present in the continuum image in all cases, which makes the Hα point source immediately suspect, as we do not expect any significant continuum contribution from a substellar object. Scattered light, on the other hand, should appear the same in Hα and the continuum, and, upon correcting for the Hα excess of the primary star (the source of the light to be scattered), should be fully removed by the SDI process. Indeed, as the SDI-processed images for both data sets reveal, there is no excess in the Hα channel at this location.
In fact, the MagAO images shown in Figure 3 provide an excellent demonstration of the effects of aggressive PSF processing on extended disk structures. There is significantly
Figure 7. (Left) GPI H-band residual image after high-pass filter (4 pixels) and PCA (KL=1) showing a knot southeast of the star, previously identified as a “c” protoplanet candidate and its symmetric disk counterpart on the opposite side of the disk minor axis. The central region corresponds to a software mask. (Right) Corresponding normalized H-band spectra of the two knots (“c”: yellow circle, disk: aqua circle) and that of the star (purple line) using a BT-NextGen model at 10,500 K (Allard et al.2012). Contrast of the extracted “c” spectrum with respect to the star is plotted in the bottom panel, as is the ratio between the knot at “c” and the symmetric disk knot on the opposite side of the minor axis. Contrasts and spectra are normalized by their mean value and a constant is added to impose an offset for ease of comparison. Since only the relative comparisons were of interest, errors were not computed.
less rotation in the 2015 May 15 data set than in the 2014 April 12 data set, making the PSF-exclusion criterion necessarily more aggressive (smaller). As a result, structures that appear smooth and extended in the upper panel of the figure appear clumpy and in some cases point-like in the lower panel.
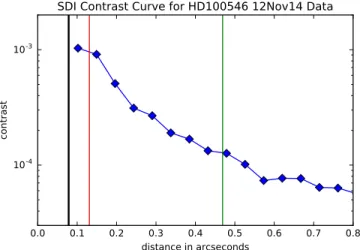
Taken together, these two lines of evidence are consistent with the hypothesis that the source detected at the location of candidate “c” is a scattered-light disk artifact enhanced relative to the disk knot on the opposite side of the major axis by the merger of the eastern inner disk rim with the northeastern spiral arm. Aggressive data processing appears to be the main culprit making this disk feature appear point-like in some reductions. As a further test of the detectability of an Hα point source in this data, we computed an SDI contrast curve, as shown in Figure 8. To compute this curve, we first convolved the final
KLIPed image shown in Figure 3 by a hard-edged circular
aperture with a diameter equivalent to the FWHM of the VisAO optical ghost (6 pixels, 0 04). This ghost serves as an estimate of the unsaturated PSF of the central star and therefore the size of an independently sampled region in the image. The convolved image was divided into annuli with widths equivalent to this measured stellar FWHM. Within each annulus, as many independent apertures as would fit in the annulus without overlapping were placed with a random starting point within the annulus, and the central values in these apertures were recorded. The standard deviation of these central values was taken, multiplied by1 1 +1 n (where n
is the number of independent apertures) to account for small sample statistics following Mawet et al. (2014), and multiplied by 5 to generate the 5σ limit for each annulus.
This procedure was repeated 500 times (for 500 random realizations of aperture placements) for each annulus, and the values averaged together. To translate this 5σ noise value into contrast, each value was divided by the stellar peak. As HD 100546A was saturated in this data set, the stellar peak was estimated from a measurement of the ghost peak. Using Moffat fits to the stellar and ghost peaks in five unsaturated GAPlanetS data sets, the ghost was shown to have an intensity equivalent to 0.42%±0.08% of the stellar peak, and can be scaled by this amount to estimate the stellar peak.
Finally, throughput was computed by injecting fake planets into the raw Hα line images, subtracting the scaled continuum
images, and then processing the SDI images with KLIP and the same parameters as the final SDI image. Throughput at a given location is measured as the ratio of the peak brightness of the recovered false planet to the injected planet. The 5σ contrast values were multiplied by this throughput to create the final curve. The curve suggests that we could have detected planets up to ∼1×10⁻³contrast at the location of the HD 100546 “c”
candidate and ∼1×10⁻⁴ contrast at the location of HD
100546 b.
HD 100546 b is heavily embedded in the disk. Currie et al. (2015) estimate the H-band extinction at the location of the point source candidate to be 3.4 mag, which translates to 22 mag of extinction at R (and therefore Hα) following standard Milky Way extinction laws. This is enough to make any constraints on the accretion luminosity of b meaningless, as we discuss in more detail in the companion to this paper.
The “c” candidate, however, is hypothesized to lie at or near the outer edge of the inner disk rim. If it is heavily embedded in the rim (an unlikely hypothesis given the continuity of disk features at this location), then it suffers from the same problem as b in that dusty material extincts very efficiently at Hα and quickly makes accretion luminosity estimates for embedded protoplanets moot. If the candidate identified by Currie et al. (2015)or hypothesized by Brittain et al. (2014)lies inside the cleared central cavity, however, then the contrast limit at this location can be used to place more meaningful limits on the accretion luminosity and accretion rate of any forming protoplanets, albeit with a number of assumptions as detailed below.
We begin by assuming that the HD 100546 cavity is fully cleared of visible light extincting grains, and indeed the precipitous drop in the Y-pol radial profile approaching the coronagraph supports this assumption somewhat. We take the measured V-band extinction toward HD 100546A (AV=0.15; Sartori et al. 2003) and translate it to AR=0.11 mag following standard extinction laws (Cox2000). Following Close et al. (2014), we use this R-band extinction estimate and measured contrast, the zeropoint and width of the Hα filter, and the distance to HD 100546 to translate the measured contrast to an Hα luminosity of1.57´10-4L
☉. If we then assume that empirically derived LHa to Lacc relationships for low-mass T Tauri stars also apply to lower mass objects, then following Rigliaco et al. (2012), this translates to an accretion luminosity of0.33%L☉. Translation of this quantity to an accretion rate requires assumptions about the mass and radius of the accreting object, and we adopt 1.55RJ and 2MJ in this calculation as reasonably representative of the population of planets we might expect to sculpt the disk rim. Then, following Gullbring et al. (1998), the accretion luminosity translates to an approximate accretion rate of M˙ » ´1 10-8M☉yr-1, corresponding to growth of a Jupiter-mass planet in 100,000 years. The accretion rate onto the primary star is estimated at ~10-7M yr-1
☉ (Mendigutía et al.2015), placing our limit at M˙planet<0.1M˙star. We note that a number of assumptions have gone into this estimate, including that accretion onto protoplanets happens in a steady flow of material and not stochastically, and thus it is likely only accurate to within 1–2 orders of magnitude.
4.3. Disk Modeling
To examine the effects of our data processing procedures on spiral arms, we produce synthetic images of planet-driven spiral arms in disks using combined hydrodynamics and
Figure 8.Contrast curve for the 2014 April 12 MagAO Hα SDI data based and created as described in detail in the text. The thick black line indicates the inner
r=8 pixel saturated region of the PSF. The green and red lines indicate the
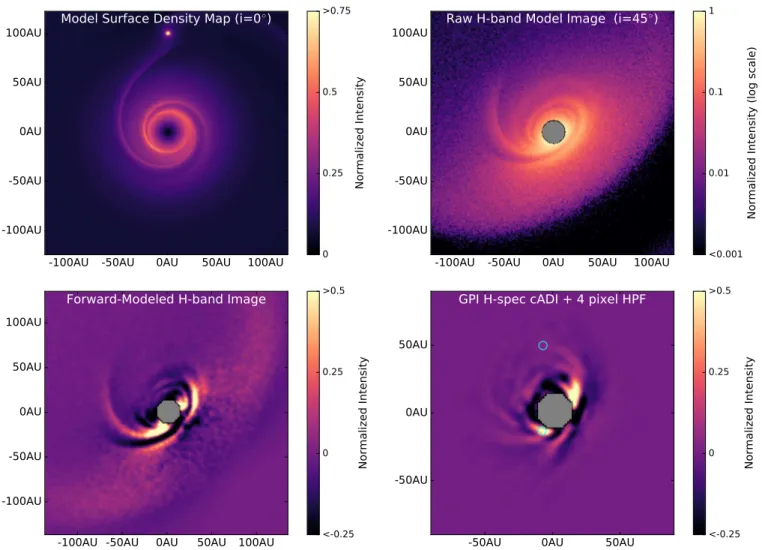
radiative transfer simulations, and process the simulated images using our GPI pipeline. We adopt the 3MJ planet model of Dong et al. (2016a)with only minor modifications, and briefly summarize salient aspects of the models here. The simulations are described in detail in Dong et al. (2016a; see also Dong et al.2015,2016b; Fung & Dong2015). The simulations are of spiral arms driven by an outer planetary perturber and do not include an inner disk cavity, though we note the qualitative similarity of spiral arms driven by inner and outer planets demonstrated in another work (Zhu et al.2015). We note that the disk models were adopted without modification, and the location of the planetary perturber does not coincide with the location of the HD 100546 b protoplanet candidate. We leave more precise reproduction of HD 100546ʼs specific disk features, including the inner cavity and prediction of the location of planetary perturbers, to future work.
The three-dimensional density structure of spiral arms in a disk excited by a 3MJplanet was calculated using the code PEnGUIn (Fung2015). The initial condition of the disk isS µ1 r, and h rµr0.25, where Σ and h/r are the surface density and aspect ratio in the disk, and h/r at the location of the planet is set to 0.15. The viscosity in the simulation is parametrized using the Shakura & Sunyaev (1973)αprescription witha =0.01. The simulation is run for 50 orbits, not long enough for the gap to be fully
opened, but sufficiently long for the spiral arms to reach steady state. The resulting 3D disk density structure is subsequently fed into a Monte Carlo radiative transfer code (Whitney et al.2013)to produce synthetic H-band total intensity images at various inclinations. We convert the gas density as calculated in the hydro simulation to dust density used in the radiative transfer simulation, assuming the dust and the gas are well-mixed, and we adopt the interstellar medium dust model (Kim et al.1994)for the dust. These dust grains are submicron in size, as assumed in previous scattered light spiral arm modeling works (e.g., MWC 758, Dong et al.2015; HD 100453, Dong et al.2016b).
Planet-induced spiral arms are very robust in scattered light imaging independent of the grain properties assumed in the modeling. Qualitative comparisons such as those we are making here are not sensitive to grain models as long as there is small (∼micron-sized) dust present in the disk, as modeling of HD 100546ʼs SED suggests is the case (e.g., Tatulli et al.
2011). Additionally, since small grains dominate the opacity at visible and NIR wavelengths and make up the majority of the dust grains in the surface layers of the disk where scattering originates, the assumption of ISM-like dust properties is reasonable.
To understand the impact of the data processing and to qualitatively assess the reality of features identified around HD
Figure 9.Top panel: density map (left) and Monte Carlo radiative transfer modeled H-band image (right) for a planet-induced spiral disk model. The surface density map is shown face-on, and the H-band image is for a disk inclined at 45° relative to the line of sight and rotated to a major axis P.A. of 152°. Bottom panel: forward-modeled H-band total intensity image generated by injecting the forward-modeled disk into a disk-less GPI data set with equivalent rotation to the HD 100546 H-spec data set (left) and real HD 100546 data (right). Both were recovered with classical Angular Differential imaging and processed with a four-pixel high-pass Fourier filter. Although the real disk shows significantly more complex structure than the forward-modeled image, the qualitative similarity is suggestive.