Analysis of Biological and Chemical Systems
Using Information Theoretic Approximations
by
MASSACHUSETTS INSTITUTE
Bracken Matheny King
OFTECHNOLOGYB.S. Biomedical Engineering
AUG 16 2010
Washington University (2004)
LIBRARIES
Submitted to the Department of Biological Engineering
in partial fulfillment of the requirements for the degree of
Doctor of Philosophy
at the
MASSACHUSETTS INSTITUTE OF TECHNOLOGY
ARCHIVES
June 2010
©
Massachusetts Institute of Technology 2010. All rights reserved.
A
A u th or
...
...
...
Department of Biological Engineering
April 30, 2010
Certified by ...
. . . . . . . . . . . . . . . . . -. . . . . . . . . .Bruce Tidor
Professor of Biological Engineering and Computer Science
Thesis Supervisor
Accepted by ...
Darrell J. Irvine
Associate Professor of Materials Science & Biological Engineering
Chairman, Department Committee on Graduate Theses
Thesis Committee
Accepted by...
Ford Professor of Bioengineering, Accepted by ...
Professor o
Douglas A aiffenburger
Chemical Engineering, and Biology Chairman of Thesis Committee
...
S.
.. B r u c e T i d o rf Biological Engineering and Computer Science
s Thesis Supervisor Accepted by... ... ...
K. Dane Wittrup
Carbon P. Dubbs Professor of Chemical Engineering and Bioengineering Thesis Committee Member
Analysis of Biological and Chemical Systems Using
Information Theoretic Approximations
by
Bracken Matheny King
Submitted to the Department of Biological Engineering on April 30, 2010, in partial fulfillment of the
requirements for the degree of Doctor of Philosophy
Abstract
The identification and quantification of high-dimensional relationships is a major challenge in the analysis of both biological and chemical systems. To address this challenge, a variety of experimental and computational tools have been developed to generate multivariate samples from these systems. Information theory provides a general framework for the analysis of such data, but for many applications, the large sample sizes needed to reliably compute high-dimensional information theoretic statistics are not available. In this thesis we develop, validate, and apply a novel framework for approximating high-dimensional information theoretic statistics using associated terms of arbitrarily low order. For a variety of synthetic, biological, and chemical systems, we find that these low-order approximations provide good estimates of higher-order multivariate relationships, while dramatically reducing the number of samples needed to reach convergence. We apply the framework to the analysis of multiple biological systems, including a phospho-proteomic data set in which we iden-tify a subset of phospho-peptides that is maximally informative of cellular response (migration and proliferation) across multiple conditions (varying EGF or heregulin stimulation, and HER2 expression). This subset is shown to produce statistical mod-els with superior performance to those built with subsets of similar size. We also employ the framework to extract configurational entropies from molecular dynam-ics simulations of a series of small molecules, demonstrating improved convergence relative to existing methods. As these disparate applications highlight, our frame-work enables the use of general information theoretic phrasings even in systems where data quantities preclude direct estimation of the high-order statistics. Furthermore, because the framework provides a hierarchy of approximations of increasing order, as data collection and analysis techniques improve, the method extends to generate more accurate results, while maintaining the same underlying theory.
Thesis Supervisor: Bruce Tidor
Acknowledgments
I would first like to thank Bruce for his mentoring over the years, particularly in
set-ting strong standards for the phrasing, execution, and analysis of principled scientific research. I am extremely grateful for his encouragement in pursing the information theoretic work at the core of this thesis, while constantly examining ways to incorpo-rate it with relevant biological and chemical questions.
Bruce has also collected an outstanding group of lab members, all of whom deserve my thanks. In particular, Jared Toettcher provided invaluable help during the formal derivation of MIST, and throughout the course of this thesis. The minimum span-ning tree formulation was first suggested by Brian Joughin and Mala Radhakrishnan. Shaun Lippow and Michael Altman were excellent mentors during my first years in lab, and were key contributors to the lab software. Nate Silver and Jay Bardhan played crucial roles in adapting MIST to the analysis of configurational entropies.
Josh Apgar and Dave Huggins also contributed considerably to much of my work. The members of my thesis committee, Doug Lauffenburger and Dane Wittrup, have played provided crucial insight and perspective in my time at MIT. The in-formation theoretic approximations at the core of this thesis were first developed in conjunction with Paul Kopesky as part of a course taught by Doug and Pete Dedon.
I have also been fortunate to have a number of excellent collaborators. Ben
Cos-grove, Kristen Naegle, Maya Hasan, Ericka Noonan, Langdon Martin and their advi-sors, Doug Lauffenburger, Forest White, Linda Griffith, Leona Samson, and Barbara Imperiali were instrumental in applications of MIST to a variety of experimental and computational problems. Collaborations with DuPont and my internship at Merck also provided an important complement to my thesis research.
Finally, my family deserve more thanks than can possibly fit on the rest of this page for their love and support before, during, and (presumably) after my graduate studies. My appreciation for science, research, and critical thinking was instilled at as young an age as possible by my dad. My wife, Rachel, has also been a constant source of encouragement and love, particularly over the last few months of my thesis.
Contents
1 Introduction
2 MIST: Maximum information spanning trees for dimension reduc-tion of biological data sets
2.1 Introduction . . . . 2.2 Theory . . . . 2.3 Methods . . . . 2.4 Results . . . . 2.4.1 Direct Validation . . . 2.4.2 Biological Application 2.5 Discussion . . . . 2.6 Conclusion . . . .
3 Analysis of a high-dimensional phospho-proteomic da information theory
3.1 Introduction ...
3.2 M ethods . . . .
3.3 R esults . . . .
3.3.1 Quantifying relationships among phospho-peptides
sponses . . . .
3.3.2 Choosing maximally informative subsets . . . . .
3.3.3 Evaluating the feature sets by PLSR modeling . .
3.3.4 Properties of the optimal MIST set . . . .
9
ta set using
3.3.5 Biological relevance of optimal MIST set . . . . 65
3.4 D iscussion . . . . 65
4 Efficient calculation of molecular configurational entropies using an information theoretic approximation 71 4.1 Introduction . . . . 71
4.2 T heory . . . . 74
4.3 M ethods . . . . 77
4.3.1 Molecular dynamics simulations . . . . 77
4.3.2 Discrete rotameric systems . . . . 79
4.4 R esults . . . . 80
4.4.1 Molecular dynamics simulations of small alkanes . . . . 80
4.4.2 Convergence for small alkanes . . . . 82
4.4.3 Source of differences between MIE2 and MIST2 for small alkanes 86 4.4.4 Discretized drug molecules as an analytical test case . . . . 88
4.4.5 Convergence properties in discrete systems . . . . 91
4.4.6 Source of differences between MIE2 and MIST2 for discrete sys-tem s . . . . 93
4.5 D iscussion . . . . 95
A Supporting materials for Chapter 2 .99
B Supporting materials for Chapter 3 105
Chapter 1
Introduction
For much of scientific history, the examination of biological systems was largely fo-cused on the isolation and direct characterization of individual molecular species or interactions between small sets of species. This mode of investigation proved quite successful, and over time, complex networks of interactions were seen to develop by integrating the results of many, many experiments of relatively small scope. Over the past few decades, remarkable technological advances have provided the ability to interrogate these same biological systems on a near global scale for many classes
of molecular species, including mRNA, proteins, and metabolites [34, 85]. The data
collected from these studies have also highlighted the multivariate nature of biological systems [43, 38].
Given this increasingly popular systems-level view of biology, a growing number of data sets have been, and continue to be, collected to identify and characterize the networks dictated by the molecular interactions. These data sets track species of interest in the context of multiple stimulation conditions, and/or cellular states. Data representing various cellular responses, such as the level of migration, proliferation, differentiation, or apoptosis may also be measured under the same set of experimental conditions. In general, these data sets represent the response of large numbers of signals across a relatively modest number of experimental conditions. From these data, the goal is to identify and quantify the multivariate relationships between the measured species, and to understand how these potentially complex relationships
lead to cellular responses. While mechanistic understanding of such interactions is the ultimate goal, much of the analysis to date has focused on statistical modeling, as it is well suited for the types of data that can be collected on a system-wide scale
[38, 46, 79]. Despite a variety of important advances, the development of techniques
for the analysis of such data remains an active area of research.
The characterization of the statistical relationships between large numbers of vari-ables is also of interest in the analysis of chemical systems. In particular, a variety of important thermodynamic properties, including the molecular configurational en-tropy, can be phrased in terms of the multivariate couplings between the degrees of freedom of the system [44]. A variety of different approaches have been pursued to quantify these relationships in computational models. Methods based upon enumer-ating and characterizing minima in the energy landscape have proved particularly successful in calculating ensemble properties such as free energy and configurational entropy [9]. For larger systems, however, these detailed methods are generally infea-sible, and alternative approaches have been pursued which analyze snapshots of the system as generated from simulation methods such as molecular dynamics (MD) or Monte Carlo search [44, 40, 36]. Within these latter phrasings, the parallels between the biological systems described above and these chemical systems become more clear. In both cases, one is presented with a finite set of multivariate samples from which one tries to extract and characterize the relevant multivariate couplings represented within the system.
Information theory as a general framework for
quan-tifying multivariate relationships
A variety of techniques exist for addressing the type of questions posed above. Of
particular interest to this thesis are methods within the field of information theory, which provides a general framework for quantifying statistical couplings. As originally formulated by Shannon, information theory draws a parallel between the variance of
a random variable - as measured by the information entropy - and the information
contained by the variable
[74].
The rationale for relating variance to information canbe seen in the context of a hypothetical experiment performed to identify the value of a variable. For a variable that is able to adopt any of a number of values (e.g. a pro-tein whose concentration varies over a wide range, or a molecular degree of freedom that permits occupancy of a number of torsional configurations), an experiment to de-termine the exact value of the variable generates a large amount of information (e.g., the concentration of the protein is exactly 100 nM, or a molecular torsion is restricted to 180'). In contrast, performing the same experiment to determine the value of a variable with limited variance does not provide much new information. By computing and combining these information entropies across multiple dimensions, information theory also provides a general framework for quantifying statistical relationships be-tween variables. Of particular note is the mutual information which represents the loss of information entropy of one variable when the value of an associated variable is known [74, 16].
For biological and chemical systems, information theory is attractive due to its ability to identify any arbitrary statistical dependency between variables, unlike variance-based methods which are limited to linear representations of such depen-dencies. Additionally, as can be derived from the conservation of information, many information theoretic statistics, including mutual information, are invariant to re-versible transformations. Information theory can also handle categorical or continu-ous data, as well as mixed systems, and naturally extends to relationships between an arbitrary number of variables [16, 57].
Despite these advantages, the application of information theory can be challenging given the relatively large number of sample points needed to generate converged estimates of the statistics, particularly those involving high-dimensional relationships. As a result, most applications of information theory to the type of data generated from biological systems have focused on first- or second-order information theoretic statistics [79, 22, 60]. Even in the context of chemical systems, where sample sizes tend to be dramatically larger, direct application of high-dimensional information theory
may still be infeasible due to the exponential growth in sample size requirements as a function of system size [44, 35]. As such, the limited application of high-dimensional information theory in biological and chemical applications appears to be a practical one (i.e., the statistics are poorly converged given the available data sizes), as opposed to a theoretical one.
As mentioned above, a variety of analyses employing information theory in the examination of biological and chemical systems have been performed. For the most part, these applications have focused on the information content of single variables, or the shared information between pairs. For example, pairwise mutual information has been used in the context of gene selection [22], clustering [79], network inference [60], sensitivity analysis [55], identification of residue couplings from multiple sequence alignments [26, 31, 49], and a host of other applications. Furthermore, some higher-dimensional phrasings have been proposed for feature selection [22, 68], chemical library design [48], and the calculation of configurational entropies [44, 35], but for most cases, the small quantities of available data have limited the application of information theory to a its full extent.
In this thesis we present a systematic framework to enable the use of high-dimensional information theoretic problem phrasings, even when a limited number of data samples are available. We accomplish this by developing a principled ap-proximation to high-dimensional information theoretic statistics that are constructed using associated statistics of arbitrarily low dimension. The idea that low-order statis-tics could be used to represent the multivariate behavior of biological and chemical systems is rooted in the observation that these systems often consist of modest num-bers of species interacting with each other directly, resulting in a relatively sparse number of direct high-order relationships. Biological and chemical systems seem to build up complex relationships, not through simultaneous coupling of large sets of variables, but by stringing together small sets of interconnected ones.
Through our approximation framework, we enable a variety of high-dimensional information-theoretic phrasings that can elegantly represent key questions in the anal-ysis of multivariate data. For example, a commonly addressed task in the context of
biological data is that of feature selection, in which one aims to identify subsets of variables that maximally explain some output of interest. In early applications, such sets were identified by individually ranking each variable by its relationship with the output [34]. Later work found that sets chosen in such a way tend to include largely redundant information, and that superior feature sets could be identified by simulta-neously weighing the "relevance" and "redundancy" of the selected features [22]. In the context of information theory, feature selection can be simply phrased as identi-fying the subset of species that together have maximal mutual information with the output. This phrasing appropriately weighs the relevance and redundancy of the con-stituent species against each other in a principled manner. Similar high-dimensional phrasings exist for such tasks as representative subset selection, clustering, experi-mental design, and network inference. In all of these cases, pairwise phrasings have primarily been pursued, due to the poor convergence of the high-dimensional statis-tics. In this thesis and in ongoing work, we demonstrate that the general high di-mensional phrasings, when addressed through our approximations, show comparable performance to state of the art pairwise methods developed for specific applications, while providing a framework for incorporating increasingly high-order information as data collection methods improve.
The structure of this thesis
In the work presented here, we start, in Chapter 2, by developing and characteriz-ing our approximation framework. The approximation is developed in the context of an expansion of the full information entropy as a function of increasingly high-order terms, enabling direct inspection of the assumptions made when utilizing the approx-imations. We also demonstrate that the approximation provides a guaranteed upper bound to the full entropy when the lower order terms are known exactly, and that the approximation error decreases monotonically as the approximation order is in-creased. We then validate and examine the approximation framework in the context of synthetic systems where the exact statistics are known analytically, as well as in
application to mRNA expression data extracted from multiple tumor tissues.
In Chapter 3, we extend the information theoretic framework to the analysis of a phospho-proteomic signaling data set. This system represents a common structure of biological data in which the number of signals (68 phospho-peptides, each measured at four separate time points) dramatically exceeds the number of experimental con-ditions (6 total concon-ditions). Using our framework, we identify a subset of 9 phospho-peptides that are shown to provide significantly improved modeling performance in comparison to other selection methods. We also employ a variety of high-dimensional phrasings to examine the relationships between relevant groups of signals, such as the four time points representing each phospho-peptide. In many cases, the relationships identified by our high-dimensional analyses are consistent with known biology, and with previous analysis in the same data set.
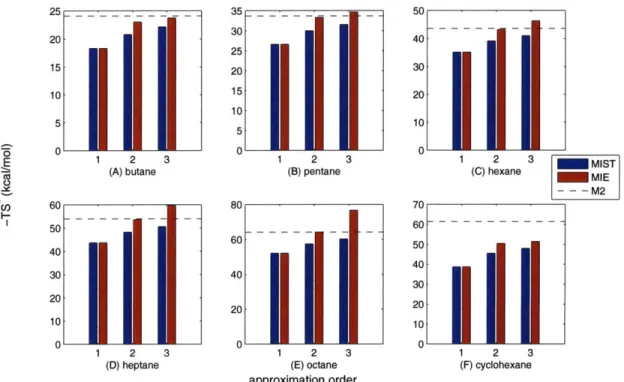
Finally, in Chapter 4, we extend our approximation framework to the calculation of molecular configurational entropies from molecular dynamics simulation data. We compare the performance of our framework against an existing approximation method that represents a similar but distinct expansion and truncation of the full entropy. In the context of simulations of linear alkanes, we observe that while our approxima-tion shows slightly worse agreement with well established methods, it demonstrates considerably faster convergence. As such, we identify sampling regimes in which our approximation provides superior agreement with established methods. We also in-vestigate a series of idealized rotameric systems in which the low-order information terms can be determined exactly. In these systems, we consistently observe low errors with our framework, whereas the comparison method demonstrates erratic behavior. Additionally, we highlight bounding and monotonicity guarantees maintained by our framework that may prove important in future applications.
As discussed above, biological networks and molecular systems share a similar structure that provides both challenges and opportunities for their analysis. For both types of systems, many relevant properties involve the multivariate interaction of large numbers of molecular species (in biological networks) or degrees of freedom (in molecular systems). Extracting these key properties directly from data drawn from
the multivariate distributions representing the systems can be unreliable, given the so called "Curse of Dimensionality" which suggests that the number of samples needed to describe multivariate relationships scales exponentially with the size of the system. In potential mitigation of these challenges is the observation that while large mul-tivariate interactions exist, they may often be decomposable into core relationships involving relatively few species. For biological networks, the vast majority of be-havior is mediated through successive pairwise interactions (binding, catalysis, etc), due at least in part to the vanishingly small likelihood of simultaneous three-body interactions. In chemical systems, many inter-atomic forces can be well approximated as being pairwise-additive, and these forces tend to drop off rapidly with distance, resulting in a similarly decomposable structure.
In this thesis, we have taken advantage of this structure of biological and chemical systems to enable the application of general information theoretic phrasings, even when direct estimation of the high-order statistics is infeasible due to sample sizes. In so doing, we provide a principled, general framework for approximating high-dimensional statistics across a wide range of sampling regimes. Additionally, this framework carries guaranteed bounding properties, as well as monotonic decrease in approximation error with increasingly level of theory. As such, in addition to providing useful approximations for the type of data that is currently being collected, the framework naturally extends to provide increasing accuracy as data collection and analysis methods improve while maintaining a consistent underlying theory.
Chapter 2
MIST: Maximum information
spanning trees for dimension
reduction of biological data setsi
2.1
Introduction
As the size and dimension of biological data sets have grown, a variety of data-mining and machine-learning techniques has been employed as analytical tools. Among these are techniques aimed at a class of problems generally known as dimension
reduc-tion problems [34, 79, 38]. Dimension reduction techniques can improve the
inter-pretability of data, either by representing high-dimensional data in a reduced space for direct inspection, or by highlighting important features of data sets that warrant more detailed investigation. For many biological applications, notably the analysis of high-dimensional signaling data, principal component analysis (PCA) and par-tial least squares (PLS) decomposition are increasingly popular dimension reduction
techniques [38, 46]. Whereas these techniques reduce the number of variables in a
system by including only statistically important linear combinations of the full set of variables, the related techniques of representative subset selection (RSS) and feature 'This chapter has been previously published as: King BM and Tidor B. Bioinformatics
selection (FS) instead aim to identify subsets of variables that are statistically im-portant. These techniques can be used as preprocessing steps prior to application of machine learning methods such as classification [22], and have also been applied in chemical library design [48] and biomarker discovery [54].
While many tools reduce dimensionality to maintain variance (variance-based techniques), recent directions have led to information theoretic phrasings [22, 79]. Compared to variance-based methods, information theory has notable advantages. Information theoretic statistics can capture all relationships among a set of variables, whereas variance-based methods may miss nonlinear relationships. Additionally many information theoretic values are invariant to reversible transformations, limiting the need for such common (and somewhat ad hoc) methods as mean-centering, variance-scaling, and log-transforming. Finally, information theory provides a framework for treating both continuous and categorical data, in contrast to variance-based methods, which are unsuitable for categorical data [57, 16]. This common framework can be especially important when incorporating categorical data, such as the classification of a type of cancer, into the analysis of a continuous data set, such as mRNA expression microarrays.
A variety of dimension reduction problems has already been phrased using
high-dimensional information theoretic statistics [48, 79, 69]. Notably, the maximum-dependency criterion (maximizing the MI between the feature set and the output) has been proposed for feature selection [69]. While the high-dimensional phrasing is theoretically more correct, difficulties in estimating high-dimensional statistics with finite sample sizes have resulted in poor performance when compared to techniques using only lower-order statistics [69]. That is, methods that are better in principle perform worse in practice due to their need for larger sample sizes. While some low-order methods have been shown to be related to the high-dimensional phrasing
[69], they have generally been developed for a specific application, and their utility
in other problems is unclear. To our knowledge, there is no available method for systematically replacing high-order metrics with associated low-order ones. Such a method would enable utilization of the general high-dimensional phrasing but avoid
the sampling issues that plague direct applications.
In this chapter we present a general framework for approximating high-dimensional information theoretic statistics using associated statistics of arbitrarily low order. Due to a relationship to the minimum spanning tree over a graph representation of the system, we refer to these approximations as Maximum Information Spanning Trees (MIST). The framework is demonstrated on synthetic data and a series of microarray data sets relevant to cancer classification, and the performance is compared to other approaches.
2.2
Theory
Information theory is a framework for describing relationships of random variables
[74].
The two most heavily used concepts from information theory with regard to dimension reduction are the concepts of information entropy and mutual information. The entropy of a random variable, H(x), quantifies the uncertainty or randomness of that variable and is a function of its probability distribution, p(x), also called theProbability Mass Function (PMF)
b
H(x) - p(xi) log [p (xi)], (2.1)
i=1
where the summation is over all b bins representing the states of x. To describe the relationship between two random variables x and y, one can consider the condi-tional entropy of x given that y is known, H(xly). If x and y are related in some way, knowledge of y may reduce the uncertainty in x, thus reducing the entropy. Conditioning can never increase the entropy of a variable, so H(x) > H(xly). The difference between the entropy and the conditional entropy of a variable is a measure of the amount of information shared between the two variables. This difference is defined as the mutual information (MI), I(x; y), and is symmetric
All of these concepts are similarly defined for vectors x and y, where they are functions
of the associated higher-order probability distributions [57, 16].
MIST Entropy Approximation Framework
The goal is to find an approximation Hk, to the joint entropy of n variables using entropies of order no greater than some k < n,
H (H1 .. .Hk) ~ Hn (xi... ), (2.3)
where Hi denotes a true entropy of order i and Hi' denotes a jth -order approximation
to an entropy of order i. To arrive at such an approximation, we begin with an exact expansion of the joint entropy of n variables [16]
n
Hn (XI. . .Xz) = Hi (xilzi . .xi_1). (2.4)
i=1
Note that Equation 2.4 produces the same LHS information entropy Hn for all permutations of the indices of the x and that the RHS is a series of terms of increas-ingly higher order. We collect the first k terms on the RHS and identify this as the kth-order information entropy of the first k variables, giving
n
Hn (Xi ... Xn) = Hk (XI... Xk) + Y Hi (xilx1 ... xi_1). (2.5)
i=k+1
We replace each term in the summation by its kth -order approximation. Because conditioning cannot increase the entropy, each approximation term is an upper bound on the term it replaced,
n
Hn (XI ... on) < Hk (X1 ... zk) + 1:Hi (ziliX ... zk_1) = H k. (2.6)
i=k+1
All the terms in this sum are kth-order, providing an approximation, H , which is
formally an upper bound. Note that for k = n this expression returns to the exact
Because the indexing of the variables is arbitrary, there are a combinatorial number of approximations consistent with Equation 2.6, all of which are upper bounds to the true joint entropy. There are actually two levels of arbitrary indexing, one being which
variables make up the first k and the second being the selection of k - 1 variables
used to bound each term beyond the first on the RHS of Equation 2.6. The best of these approximations is therefore the one that generates the minimum H , as this will provide the tightest bound consistent with this framework. To complete the approximation, we therefore desire a method for choosing the indexing that produces the best of these bounds.
For low dimensional problems one can enumerate the space of consistent approx-imations and use the smallest one. To provide a general solution, we first separate out elements that are independent of the indexing. Each conditional entropy term can be divided into an entropy and a MI component, as shown in Equation 2.2.
n
Hn= Hk (x1... xk)+ [H1(xi) - Ik(xi; x1 ... x_1]. (2.7)
i=k+1
Because all individual self entropy terms will ultimately be included in the summa-tion, they are not affected by the indexing, whereas the MI terms do depend on the indexing. For k = 2, we arrive at a compact expression of the best second-order approximation within this framework that depends only upon the indexing of the pairwise MI terms,
n n
H= ZH(xi) - maxZI2(xi;xjg[,13). (2.8)
i=1 j i=2
The goal is to select the ordering of the indices, i, and the conditioning terms,
j,
tominimize the expression. The selection of i and
j
has no effect on the left-hand sum,so it can be ignored during the optimization. We are then left with n - 1 second-order
terms to consider. To phrase the optimization of indices over these terms, consider a graph where the nodes are the variables and the edges are all possible pairwise MI
terms. The result is a fully connected graph of n nodes from which we choose n - 1
such that every node must have at least one edge. Because only n - 1 edges are chosen, this also constrains the graph to be acyclic.
By negating the edge weights and adding a sufficiently large constant to ensure
positivity, the problem is equivalent to the Minimum Spanning Tree (MST) from graph theory. A variety of algorithms has been developed to find the optimal solu-tion, including Prim's algorithm [14], a greedy scheme in which the smallest allowed edge is chosen during each iteration. Using this algorithm, we define a method for efficiently finding the best second-order approximation consistent with Equation 2.8. The computational complexity of Prim's algorithm for a fully connected graph, and
thus of our method, is O(N 2). For the higher-order approximations, we apply the
greedy algorithm to select the best kth-order approximation consistent with Equation
2.6. Although it is not guaranteed to be optimal, in small test systems where
enumer-ation is possible, the greedy scheme resulted in bounds nearly as tight. Note that the MST phrasing, as used here, is merely an optimization method for finding the best approximation consistent with the mathematical framework, and is not necessarily an inherently meaningful representation.
Bias-Estimation and Propagation
The bias associated with computing the MIST approximation can be estimated by propagating the bias associated with estimating each of the low-order terms. For
clarity we focus on the second-order approximation (MIST2) although the method can
be easily extended for arbitrarily high approximation order. The error model we use takes advantage of two properties of entropy estimation: (1) higher entropy variables are more difficult to estimate (have higher errors), and (2) entropy estimates are negatively biased (direct estimates are generally underestimates) [67]. While neither of these properties is guaranteed for any single estimate, they are true on average. We also assume that the estimation errors associated with the first-order entropies are negligible with respect to the errors in the higher-order terms.
We first consider the bias associated with estimating a single second-order entropy. For any pair of variables with fixed self entropies, nonzero MI between them will
reduce the joint entropy of the pair. Because higher entropy variables have higher estimation bias, the highest possible bias comes when the variables are independent.
By forcibly decoupling any pair of variables (by shuffling their order with respect to
each other), we compute an estimate that is greater than or equal to the true bias,
H(x, y) - (H(x, y)) < Hind(x, y) - KHind (XY) (2.9)
< H(x) + H(y) - KHind(x, y
where the angled brackets indicate averages over repeated samples and the overbars indicate entropy estimates. All quantities on the RHS are directly computable, and
by repeating the shuffling procedure, the average estimation bias can be estimated or
confidence limits can be established quantifying the likelihood of the true estimation error being greater than the computed value.
With a reasonable estimate of the bias associated with computing each second-order entropy, we need to propagate the bias through the MIST approximation. We
start by rewriting Equation 2.8 assuming that the indexing i,
j
has been determinedusing the MST approach as described above, and by expanding the MI term into the corresponding difference of entropies
n n
Hn = E H1 (xi) - E [H1 (xi) + H1 (xj) - H2 (xi, xj)] (2.10)
i=1 i=2
n
= H1(x1) - 1 [H1(xj) - H2(xi, xj)].
i=2
Because we assume the bias in estimating first-order entropies to be small with respect to the bias in higher-order terms, the propagated bias in this expression is
dominated by the errors in approximating the n - 1 second-order entropies. Because
all of these terms are negatively biased, we expect that overall propagated error to be negatively biased as well; i.e., the computed H is expected to be an underestimate
of the approximation assuming no estimation errors in the low-order terms. Conse-quently, by summing the second-order bias approximated by Equation 2.9, we arrive at an expected bias for the full approximation:
H -
KH
..
H(xi)
+
H(xj)
-KHind(Xi,
Xj))
.(2.11)
i=2
As with Equation 2.9, repeated shuffling allows one to estimate the expected bias and to compute confidence limits on the calculation.
2.3
Methods
Direct Entropy Estimation
While the framework developed here is equally applicable to continuous phrasings of information theory, all variables in this work were treated as discrete. For continuous data, variables were discretized into three equiprobable bins unless otherwise stated. Similar results were achieved using different binning protocols and numbers of bins. For discrete data no pre-processing was performed. Entropies of arbitrary order were computed from data by approximating the PMF by the frequencies and using the resulting PMF estimate in Equation 2.1. The MI's were then computed from the estimated entropies according to Equation 2.2.
Bias Estimation
Bias estimates were computed as described in Section 2.2. The bias of all pairs of variables was first estimated using Equation 2.9 by shuffling the ordering of samples for each pair and recomputing the entropy directly. This procedure was repeated until the bias estimate computed from two halves of the shuffling samples agreed within 0.01 nats. The pairs' biases were then used to approximate the bias of each high-order approximation according to Equation 2.11. The terms included in the summation were chosen according to the MIST method prior to any error analysis. Two cases were examined for computing the term in angled brackets. Either the converged
mean value was used to compute the expected bias, or 100 samples were drawn and the maximum error from this set was used for each term in the sum, resulting in a
p = 0.01 confidence limit that the true value of the entropy approximation lies below
this max-error value.
Validation Framework
To evaluate the approximation, we developed a framework for generating relational models with analytically determinable entropies from which we could draw sample data. These networks consisted of 5-11 discrete nodes connected by randomly placed unidirectional influence edges. All nodes initially had an unnormalized uniform
prob-ability of 1 for each state. If node A influenced node B with weight w, then B was
favored to adopt the same state as A by adding w to the unnormalized probability
of that state in B. For higher-dimensional influences, the states of all parents where summed and remapped to the support of the child, and the corresponding state in the child was favored by adding the influence weight to that state. Influences including 1-4 parents were included, with 4-19 influences of each order, depending on the num-ber of nodes in the system. Influence weights ranged from 1-10 and all variables had
3 bins. For each system, the joint entropy of all combinations of nodes was computed
analytically and 10,000 samples were drawn from each network.
Feature Selection and Classification Error
For the feature selection task, an incremental method was used in which features were added one at a time to the set of already chosen features either at random or in order to maximize the score of the new feature set according to: (1) maximum dependency
using direct estimation, (2) maximum dependency using MIST of order two (MIST2),
or (3) a second-order approximation proposed elsewhere specifically for feature selec-tion know as minimum-redundancy-maximum-relevance (mRMR) [22]. All feature selection methods were evaluated by training on 75% of the samples and testing on the remaining 25%. This procedure was repeated 200 times and the mean behavior is reported. The data were discretized and the features chosen using only the training
data. The frequency of each gene across the 200 trials was also recorded, and the Bonferroni-adjusted p-value for each gene occurring this many times was computed compared to a null model in which features are chosen at random. The subset of features was then used to train support vector machine (SVM) using a linear kernel, linear discriminant analysis (LDA), 3-nearest-neighbor (3NN), or 5-nearest-neighbor
(5NN) classifiers [33, and references therein]. Additional SVM kernels (polynomials
of order 2 and 3, Gaussian Radial Basis Function, and Multilayer Perceptron) where also examined; while these kernels generally resulted in better fits to the training sets, they performed worse than the linear kernel in cross-validation. To compute the correlation between the metric scores and classification error, 100 subsets each of
1-15 features were chosen at random and the cross-validation classification error was
computed. Additionally, the MI of each feature set was computed using all samples
according to MIST2, mRMR, and direct estimation.
Data Sets
Gene expression data sets relating to the classification of four cancer types were used
for the feature selection task. Samples from prostate [78], breast [83], leukemia
[34],
and colon [2] were analzyed. Additional information on the data sets is available in Table A.1.
2.4
Results
2.4.1
Direct Validation
To validate the method, we examined the performance of the MIST approximation in systems with analytically computable entropies. For real-world applications the entropies of the true distribution are estimated from limited data sets, and the cor-responding numerical experiments were performed here. To serve this function, we developed a framework to generate networks with a variable number of nodes, inter-actions, orders of interaction, discrete states, and weights of influence between nodes.
Exact low-order 10 W 10 8 10 0. 10 6 e 2nd ( C L .8 * 3I~ *,41 10XX a) ' 'A 00 4 6 8 10 10 103 1 . .. exact
analytical joint entropy (nlats) number of samples
10 10 samples . 10 10 Samples 10 10 samples
o L -28 8 .. 8 . 41 4 1 04 CC
. .0
0e
4J MD 0 0 EJ (A 0 4 6 8 10 0 4 6 8 10 0 4 6 8 10 a)analytical joint entropy (nats)
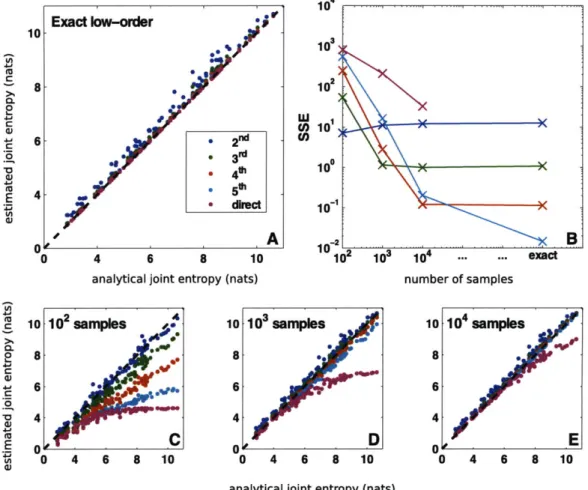
Figure 2-1: Direct validation of MIST entropy approximation. To evaluate the MIST framework, we simulated 100 randomly generated networks with analytically computable joint entropies and applied the metrics using a range of sample sizes. When the analytical entropies are known exactly (A), the higher-order approximations performing increasingly well. When the entropies are estimated from a finite sample, however (C-E), the approximations provide the best estimates, with the higher-order approximations performing better as more data become available. This behavior is quantified by computing the sum-of-squared error of each metric as a function of the sampling regime (B). The best approximation to use depends upon the amount of data available, but for all cases examined with finite sample size, the approximations outperform direct estimation and the second-order approximation provides a good estimate.
For each of these networks, all of the joint entropies were analytically determined for comparison to the approximations (see Methods).
Using this framework we randomly generated 100 networks containing between five and eleven variables each with widely varied topologies, and we sampled 10,000 points from the joint distribution. For each network, we then computed the joint entropy of all variables in the network either (1) analytically, (2) directly from the data, (3) using the the second- through fifth-order MIST approximations with analytical low-order entropies up to and including k, or (4) using MIST after estimating the low-order entropies from the sampled data. Additionally, half of the nodes in each network were randomly chosen and the MI between the chosen set and the unchosen set was computed according to all the metrics. The results for entropy and MI approximation are shown in Figures 2-1 and A-1, respectively.
The scatter-plots show the relationship between each of the MIST approximations and the analytical value. As guaranteed by the theory, when the exact low-order en-tropies are known (panels A), all joint entropy approximations are greater than or equal to the true joint entropy, and the higher-order approximations are increasingly accurate. While there are no guarantees for the behavior of the MI approximation, all approximations tend to underestimate the true MI and the higher-order approxi-mations generally perform better. In some cases the lower-order approxiapproxi-mations are able to fully represent the network, resulting in perfect accuracy and in all cases the MIST approximations tend to be fairly accurate.
For biological applications, the exact low-order terms are not available and must instead be estimated from a finite sample of the underlying distribution (panels
C-D). Because estimating high-order joint entropies requires larger sample sizes than
estimating low-order entropies, the relative performance of the approximations is cru-cially tied to the number of samples available. In the least sampled case shown here
(100 points, panels C), the second-order approximation (MIST2) yielded more
accu-rate results than any of the other methods for computing entropy, while the second-and third-order approximations performed about equally well for MI. As more samples were used to estimate the low-order terms, the higher-order approximations began
-x- MIST, -x BA-N -- C-M --- analyi MIST, 0 102 Number of samples C ,', - 14 e10 samples, 2 4 6 8 10412 10 7 6 5 4 1 12 10 8 6 4 2 102 1 Number of samples 12 E ' 10 8. 6 a'* .MIST2 4 2 10 BA-MIST 2 2 ,' 100 samples 2 4 6 8 10 12
Figure 2-2: Bias-adjusting for the MIST entropy approximation. Networks were generated and simulated as in Figure 2-1. The joint entropy of each network
was computed by the second-order MIST approximation with (BA-MIST 2) or without
(MIST2) bias adjusting. (A) The performance of both metrics as well as a p = 0.01
confidence limit for MIST (CL-MIST 2) approach the analytical MIST2 with increasing
samples. (B) The sum-squared-error (SSE) for estimating the analytical MIST2 is
shown to decrease as a function of sample size. (C-D) MIST2 and BA-MIST2 were
computed using 10, 50, or 100 samples and are plotted against the analytical MIST2.
to outperform the lower-order ones. This trend is quantified in the upper-right plots (B), which show the sum-of-squared error (SSE) for each approximation tested. For all sample-sizes tested here, direct estimation performed the worst, demonstrating the impracticality of estimating high-order information theoretic terms directly.
Fur-thermore as can be seen in panels C-E, the MIST2 approximation is quite accurate
for all sample sizes. When more data are available, the higher-order approximations
can provide even better accuracy than MIST2, but MIST2 itself appears to be a good
metric for all sample sizes tested. D
D
/*
2 / 50 samples
2 4 6 8 10 12 Analytical Joint Entropy ... ...
We also examined the behavior of our bias approximation framework in the same
systems for MIST2. For each pair of variables, we computed the converged bias
and the maximum observed error over 100 shuffling iterations. For each MIST-approximated joint entropy we propagated both error sets through to determine a
bias-adjusted entropy (BA-MIST 2) and p = 0.01 confidence limit. We then compared
these values to the analytically determined ones in different sampling regimes (Figure 2-2).
In these systems, the bias-adjusted entropy proved to be a significantly better estimator of the MIST approximation than the unadjusted estimator. This result is not necessarily expected, as the bias was computed using the different, but related, system in which all variables were forcibly decoupled. That the bias-adjusted values are not strictly greater than the approximation using analytically determined values is likely a result of the approximations made in the analysis: namely, neglecting the errors in first-order terms and adjusting from a single observed value, rather than a mean from repeated samplings. As expected, the bias decreases as more samples are used, resulting in the bias-adjusted and unadjusted approximations converging for higher sampling regimes. Because the BA-MIST is always greater than MIST without bias-adjusting, and the MIST approximation itself is an upper bound to the true entropy, for higher sampling regimes, bias-adjusting actually results in poorer performance with respect to the analytical answer. While the bias is likely to be small in these cases, this result suggests that while BA-MIST is likely more accurate for low-sampling regimes, when more data is available, MIST without bias-adjusting may have lower error with respect to the true joint entropy.
The confidence limit also shows the expected behavior. While it is not as good an estimator as the bias-adjusted metric, it does provide an upper bound to the approx-imation computed with analytical entropies within the resolution of the estapprox-imation techniques. As such, this metric can provide a guide towards the convergence of the MIST approximation techniques and may lend some insight into the selection of the appropriate order of approximation.
2.4.2
Biological Application
To further characterize the MIST approximation and to evaluate performance in tasks relevant to the interpretation of biological data, we employed MIST in the task of
feature selection, which has been previously phrased using information theory
[691.
Feature selection is the task of choosing a subset of available features for use in some learning task, such as classification; the information theoretic phrasing seeks the feature subset with maximal MI with the classification. A well studied example is that of selecting a subset of gene expression levels to use when building classifiers to discriminate among cancer types [22, 32, 25].To explore the performance of the MIST approximation in this task, we analyzed four gene expression data sets (which varied both in the number of samples and the number of genes) that had previously been used to classify cancer type in prostate
[781,
breast [83], leukemia [34], and colon [2]. The rationale behind using MI to choose gene subsets comes from the relation-ship between MI and classification error [65]. To evaluate the relationrelation-ship betweenMIST2 and the true relationships in these biological data sets, we therefore computed
the cross-validated classification error using 100 randomly chosen subsets including
1-15 genes and a range of classifiers. We also computed the MI of the same feature
sets with the class variable according to MIST2 and direct estimation, as well as an
existing incremental feature selection metric that has been shown to be an approxi-mation of high-dimensional MI known as minimum-redundancy-maximum-relevance (mRMR) [69]. The Pearson correlation coefficient between the SVM cross-validation classification error and the MI metrics for each set size is shown in Figure 2-3. Re-sults using 3NN, 5NN, or LDA classification error showed similar trends, as did those using the fit error rather than the cross-validation error (data not shown). The SVM classifier was chosen due to its superior performance across the four data sets.
For all four systems, all three metrics have a strong negative correlation coef-ficient for the feature sets of size one, indicating that high MI corresponds to low classification error, as expected. For larger numbers of features, however, while the
0.2 '.2
OA
x MIST2
0-B X mRMR -0.2 - X direct -0.2--0.4- -0.4 -0.6- -0.6-0 --0.6-0.8 -- 0.8-breast leukemia C) -1 i -1 0 5 10 15 0 5 10 15 C 0.2 0.2 0 0--0 .2 -- 0.2--0.4 -0.4 -0.6 -0.6--0.8 -0.8 colon prostate -1 ''' -1 0 5 10 15 0 5 10 15feature set size
Figure 2-3: Correlation of MI metrics with classification error. The classifi-cation error of randomly chosen subsets of 1-15 genes was computed through
cross-validation with an SVM based classifier. The same sets were then scored by MIST2,
MI computed with direct estimation, and mRMR. The Pearson correlation between each metric and the error was computed for gene expression data sets collected in (A)
breast, (B) leukemia, (C) colon, and (D) prostate tissue. For all cases, MIST2 shows
strong negative correlation with CV error, meaning high MI is associated with low error. While correlated in some cases, both mRMR and direct estimation show poor
correlation for some set sizes and data sets
sets, the direct estimation has virtually no correlation with classification error for sets
larger than five. For breast (A) and leukemia (B), MIST2 and mRMR are relatively
close though MIST2 generally exhibits slightly better correlation. For colon (C) and
prostate (D), however, MIST2 exhibits significantly better correlation for larger
fea-ture sets. The correlation across sets of different size was also computed and is shown in Figure A-4. While correlation between different sizes is not necessary for standard
FS phrasings, the strong negative correlation of MIST2, even across sets of varied size
is further evidence that the approximation reflects the underlying relationships of the system.
In practice, for feature selection the MI metric would be used to select a single subset of features that is expected to have low classification error. In this task, correlation across all sets is not necessary as long as the top ranked set is a good one. To evaluate the utility of MIST in this application, we included it, as well as direct estimation and mRMR, in an incremental feature selection task to choose subsets of genes with which to build a classifier for each of the four tissue types. For each data set, 75% of the samples were used to select the best set of size 1-15 (or 1-10 for direct estimation) according to each metric in an incremental fashion. SVM classifiers were then trained on the same 75% and used to predict the class of the remaining 25% of the samples. This procedure was repeated 200 times to determine the average cross-validation error of the feature selection/classification methods. The performance of randomly chosen feature sets was also computed and in all cases was significantly worse than all tested methods (Figure A-2). Parallel studies were performed using
3NN, 5NN, and LDA classifiers (Figure A-3), as well as ones in which features were
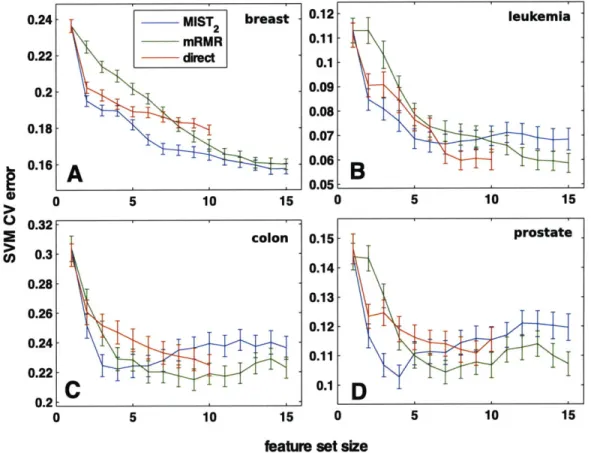
preselected using the full data set rather than only 75% (data not shown). Leave one out cross-validation schemes were also examined (data not shown). While the results in all cases showed similar trends, the SVM classifier consistently outperformed the other classifiers and the 75% cross-validation scheme seemed to be the most stringent test. The mean SVM classification errors are shown in Figure 2-4.
For all cases, the MIST2 feature sets showed lower classification errors relative to
is consistent with the better correlation with the classification error for MIST2 shown
in Figure 2-3. For the breast data, this improvement was maintained for feature sets of all sizes. For the other three systems, however, both direct estimation and mRMR generated sets with lower classification errors for sets including more than 5-7 genes. This result is particularly surprising given that this is the regime in which MIST showed improved correlation with classification error relative to the other metrics. Regardless, while MIST appears to select superior subsets of size 2-5, this behavior does not generally appear to extend to large set sizes and deserves further study.
In the above validation scheme, many different feature sets were chosen using different subsets of sample data so as to characterize the expected performance of the metric for predictive tasks. In application however, the features would be selected using all the samples available for training. We therefore incrementally selected the
set of 10 most informative genes according to MIST2 for each of the data sets. An
ordered list of these genes along with references demonstrating the relevance to cancer biology or cancer diagnosis for a subset of the genes can be found in Table A.2.
All of the selected feature sets contained genes that have been either statistically
or functionally related to cancer. Many of the genes have also been identified in other computational studies. The most informative gene for all four datasets had previously been identified in multiple studies. For the highly studied leukemia and colon datasets, nearly all of the genes have been identified in some study, though not, always in the top 10 ranked genes. Notably, three of the genes identified in the breast dataset (NM_003981, AI918032, and AF055033) consistently appeared in the globally optimal feature sets of size 2-7 in [11].
We also evaluated the robustness of the chosen genes by observing how often they were chosen in the 200 CV trials. The p-value for having at least this frequency for each of the chosen genes is shown in Table A.2. While some of the globally chosen genes are not robustly re-selected, the majority (32/40) of the genes appear in the 200 trials more often than expected at random (Bonferroni-corrected p-value
< 0.01), particularly for the breast (8/10) and prostate (10/10) datasets which have
0. 0. 0 24 MIST2 breast mRMR 22 dkec .2 .18 .16 .A.1 0 5 10 15 0.32-0.3 0.28 0.26 0.24-0.22 0.2 0 5 10 0.12 0.11 0.1 0.09 0.08 0.07 0.06 0.05 0.15 0.14 0.13 0.12 0.11 0.1 15 0
feature set size
Figure 2-4: Gene subset selection for cancer classification. Subsets of gene expression levels were chosen incrementally to maximize the information with the
cancer class according to MIST2, direct estimation of MI, or mRMR and scored by
the cross-validation error of an SVM classifier. For all data sets, 75% of the data was separated and used to select features and train the model; the classifier was then used to classify the remaining 25%. The mean classification error and standard error of the mean for 200 training/testing partitionings are reported. Genes were selected for data sets relating to (A) breast, (B) leukemia, (C) colon, and (D) prostate cancer. The performance of randomly chosen feature sets along side these methods can be seen in Figure 2-4 . leukemia -colon 0 5 10 15 prostate I .... ... ... ... ..... ... .... ..... ... .. ... .... . ... I ... . ... . ... -- -
-2.5
Discussion
Here, a novel framework for approximating high-order information theoretic statistics with associated statistics of arbitrarily low order has been developed and validated. Due to the generality of information theory, the MIST approximation should allow the use of high-dimensional information theoretic phrasings for a variety of problems, even in cases when data quantities are limited. Information theoretic phrasings exist for such tasks as feature selection (shown here), representative subset selection [48], clustering [79], network inference [52], and other applications where relationships of multiple variables are important. Though high-dimensional phrasings are theoreti-cally correct, difficulties in estimating these terms has led to low-order approximations having better performance. While these approximations have been applied to many problems, task-specific metrics were usually developed that are not generally usable across multiple applications. By instead developing a principled approximation to joint entropy and MI, we propose a general method for application to many
prob-lems.
In regards to the feature selection task shown here, while MIST2 correlates well
with the classification error and generates low-error sets when picking a small number of genes, the overall behavior for choosing larger sets could still likely be improved. For incremental feature selection, MIST and mRMR are similar with the primary difference being that MIST selects a subset of MI terms to consider, whereas mRMR averages all gene-gene terms to compute the redundancy. While both have been shown to relate to the maximum dependency criterion, MIST represents a more gen-eral framework for extension to different problems phrasings. In contrast, mRMR has been well calibrated for feature selection, and some features of mRMR may be useful in improving the performance of MIST in feature selection. In particular, preliminary work on incorporating weighting factors to influence the relative importance of the relevance and redundancy suggests that such a scheme may result in a better feature selection method. Additionally, while the current work has focussed on incremental feature selection, the generality of MIST and the good correlation with classification