Publisher’s version / Version de l'éditeur:
Vous avez des questions? Nous pouvons vous aider. Pour communiquer directement avec un auteur, consultez la
première page de la revue dans laquelle son article a été publié afin de trouver ses coordonnées. Si vous n’arrivez
Questions? Contact the NRC Publications Archive team at
[email protected]. If you wish to email the authors directly, please see the first page of the publication for their contact information.
https://publications-cnrc.canada.ca/fra/droits
L’accès à ce site Web et l’utilisation de son contenu sont assujettis aux conditions présentées dans le site LISEZ CES CONDITIONS ATTENTIVEMENT AVANT D’UTILISER CE SITE WEB.
Student Report (National Research Council of Canada. Institute for Ocean Technology); no. SR-2008-01, 2008
READ THESE TERMS AND CONDITIONS CAREFULLY BEFORE USING THIS WEBSITE.
https://nrc-publications.canada.ca/eng/copyright
NRC Publications Archive Record / Notice des Archives des publications du CNRC :
https://nrc-publications.canada.ca/eng/view/object/?id=245a3e84-b4eb-426a-8e12-4dfa17e2480a https://publications-cnrc.canada.ca/fra/voir/objet/?id=245a3e84-b4eb-426a-8e12-4dfa17e2480a
NRC Publications Archive
Archives des publications du CNRC
For the publisher’s version, please access the DOI link below./ Pour consulter la version de l’éditeur, utilisez le lien DOI ci-dessous.
https://doi.org/10.4224/8894891
Access and use of this website and the material on it are subject to the Terms and Conditions set forth at
The iceberg sightings database: its purpose and some initial analysis
National Research Council Canada Institute for Ocean Technology Conseil national de recherches Canada Institut des technologies oc ´eaniques
Student Report
SR-2008-01
The Iceberg Sightings Database: Its Purpose and Some
Initial Analysis
Kilah Ivany
April 2008
DOCUMENTATION PAGE
REPORT NUMBER
SR-2008-01
NRC REPORT NUMBER DATE
April 18th, 2008
REPORT SECURITY CLASSIFICATION
UNclassified
DISTRIBUTION
Unlimited
TITLE
THE ICEBERG SIGHTINGS DATABASE; Its Purpose and Some Initial Analysis
AUTHOR(S)
Kilah Ivany
CORPORATE AUTHOR(S)/PERFORMING AGENCY(S)
Institute For Ocean Technology - National Research Council of Canada
PUBLICATION
SPONSORING AGENCY(S)
Institute For Ocean Technology - National Research Council of Canada
IOT PROJECT NUMBER NRC FILE NUMBER
KEY WORDS
Iceberg, IIP, ISD
PAGES 31 FIGS. 29 TABLES 3 SUMMARY
This report details the Iceberg Sightings Database, created by Brian T. Hill of the Institute for Ocean Technology (IOT) in St. John’s, Newfoundland. The database is a detailed historical log of all iceberg sightings recorded since the 1890’s for the North Atlantic waters surrounding the island of Newfoundland. The purpose of the database is to provide an accurate and
comprehensive log of ice movements surrounding the island. From this log it is possible to gain insight relating to the frequency patterns and quantity of the icebergs witnessed throughout the past century.
This report focuses on providing the background information on icebergs needed to fully appreciate their fatalistic potential. This information includes iceberg origin, various iceberg classifications, and the destructive ability of icebergs. Information is also given on the specifics surrounding the foundation of the International Ice Patrol (IIP), what the IIP has accomplished, and how iceberg tracking technology has progressed in the past century. From this information it is easy to recognize the necessity for foundations such as the IIP, and databases such as the Iceberg Sightings Database (ISD).
The other major section of this report deals with the structure and classification of the Excel files that formulate the initial stages of the ISD. The preliminary analysis of the derived statistics associated with these files is also included.
Finally, a conclusion summarizing what has already been done and commenting on what has yet to be accomplished is included at the end of this report.
ADDRESS National Research Council
Institute for Ocean Technology Arctic Avenue, P. O. Box 12093 St. John's, NL A1B 3T5
National Research Council Conseil national de recherches
Canada Canada
Institute for Ocean Institut des technologies Technology océaniques
THE ICEBERG SIGHTINGS DATABASE;
Its Purpose and Some Initial Analysis
SR-2008-01
Kilah Ivany
TABLE OF CONTENTS
……….Page #1.0 Introduction ………...1
2.0 Background Information ……….2
2.1 Iceberg Origin ………...2
2.2 Iceberg Descriptions and Classifications ……….4
2.3 The Dangers Associated with Icebergs ………6
2.4 Establishment of the International Ice Patrol (IIP) ………..7
2.5 Accomplishments of the SOLAS Conferences ………...……9
2.6 Progression of Iceberg Tracking Technology ………...10
3.0 The Iceberg Sightings Database ……….13
3.1 Contents of the Excel File ………13
3.2 Using the Information Stored in the Excel Files ………17
4.0 Databasing the 1920’s ………..…18
4.1 Information Sources ………..……18
4.2 Importance of the Hydrographic Bulletin (HB) ………..20
4.3 Comparing Our Statistics to Those Provided by the IIP ………..…20
4.4 Implications of the Analyzed Data ………..…22
5.0 Conclusion ..………23
6.0 References ……….…24
LIST OF FIGURES
. ……….………Page #1 A large iceberg floating in the North Atlantic ………...………1
2 A calving glacier in Northwest Greenland ………2
3 Strait of Belle Isle ……….3
4 An ice island with multiple melt pools ………...4
5 A tabular iceberg ………..…5
6 Recently discovered picture of the iceberg believed to have sunk the titanic ………..…..….7
7 U.S. Coast Guard plane similar to those used for ice patrol purposes ….12 8 The first ten columns of the database file for 1921 ……….15
9 Excerpt from the Comments Coulmn in the Excel Database File for 1928………..16
10 Google Earth image depicting the iceberg dispersion of 1925 …………..17
11 The image created by VMAP for all of the iceberg sightings during 1928………..18
12 Graph of the data obtained from the IIP ………21
13 Graph of the data collected in the Iceberg Sightings Database ………….21
14 Graph of solely the IIP data collected in the Iceberg Sightings Database………..22
15 Graph comparing the number of iceberg sightings from the HB and the IIP for all locations during the decade of 1920 ………26
16 Graph comparing the number of iceberg sightings from the HB and the IIP for locations South of 48° during the decade of 1920 ……….26
17 Graph of the ice islands seen during the decade of 1920 ………..26
18 Graph comparing the number of iceberg sightings from the HB and the IIP for all locations from August to December during the decade of 1920 ….27 19 Graph comparing the number of iceberg sightings from the HB and the IIP for locations south of 48° from August to December during the decade of 1920 ……….27
LIST OF FIGURES Continued……….………Page #
21 Graph of the total monthly sightings for 1921 ………...28
22 Graph of the total monthly sightings for 1922 ………...28
23 Graph of the total monthly sightings for 1923 ………...29
24 Graph of the total monthly sightings for 1924 ………...29
25 Graph of the total monthly sightings for 1925 ………...29
26 Graph of the total monthly sightings for 1926 ………...30
27 Graph of the total monthly sightings for 1927 ………...30
28 Graph of the total monthly sightings for 1928 ………...30
LIST OF TABLES
………Page #1 Iceberg classification chart ……….4 2 Percentage of total sightings from each source per year ………19 3 Percentage of total sightings from each source for the full decade from
1920 to 1929 ………..19
APPENDICES
Appendix A - VMAP Iceberg Charts for the Decade of 1920
Appendix B - Excerpt from IIP’s “Table of ice and other obstructions –1927” Appendix C - Excerpt from the July 21st, 1920 Issue of the HB
LIST OF SYMBOLS AND ABBREVIATIONS
& And ~ Approximately ° Degrees ‘ Minutes # Number “ Seconds ft Feet HB Hydrographic Bulletin HH Halifax HeraldIIP International Ice Patrol
IOT Institute for Ocean Technology
ISD Iceberg Sightings Database
kg Kilogram
KML Google Earth File
Ltd. Limited
m Meters
MO Marine Observer
MS DOS Microsoft Disk Operating System
N North
NRC National Research Council
NYMR New York Maritime Register
P.E.R.D Program for Energy Research and Development
S South
SAR Synthetic Aperture Radar
SICDB Ship Iceberg Colision Database
SOLAS Safety of Life at Sea
S.S. Steamship
U.S. United States of America
VMAP Versamap Computer Mapping Program
W West
WNW West Northwest
1.0 INTRODUCTION
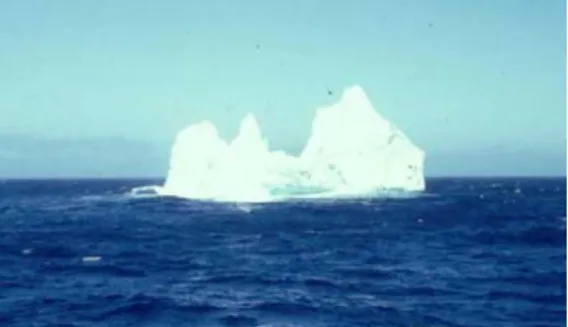
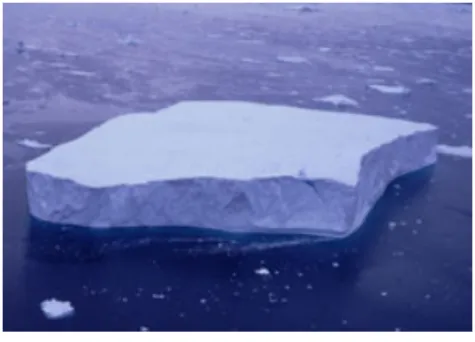
Here in Newfoundland, icebergs are a common occurrence; a spectacle so familiar that they are often taken for granted. Tourists come from all over the world to witness these spectacular and awe inspiring pieces of nature. But, despite they’re cold beauty, icebergs, like any other large ocean obstruction, must be viewed and navigated around with extreme caution.
Fig. 1 A large iceberg floating in the North Atlantic
Modern day ice patrol is a detailed and expansive process using all sorts of new and improved technology to accurately locate, identify and predict the location and size of icebergs. Before all of these technological advancements however, iceberg tracking wasn’t such an easy or accurate process. The information that was obtained came from visual sightings by individuals traveling aboard various ships who then took the time to record the date, location, quantity, and
sometimes size of the iceberg(s). To add even more confusion to this
rudimentary system, before the sinking of the titanic in 1912, there was no set foundation to which ships could report their iceberg sightings.
The International Ice Patrol (IIP) was started by the United States Coast Guard in 1914, and grew from this time up to the late 1920’s when it finally seems to have dominated the iceberg sightings records which are currently being filed away in an iceberg sightings database.
This database is a comprehensive record of all the iceberg data available from the 1890’s onward. This extremely large quantity of data is currently being entered into an Excel file and will eventually be transformed into a convenient database format. The analysis of this data will hopefully lead to informative conclusions regarding ice flow in the Western North Atlantic.
2.0 BACKGROUND INFORMATION
2.1 Iceberg Origin
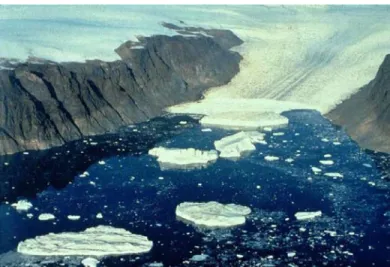
Thousands of icebergs are calved from Arctic glaciers every year. Ninety
percent of those that plague Newfoundland’s Grand Banks are pieces of the west Greenland glaciers. These bergs travel at sea for around two years, covering approximately 1,800 nautical miles in the process. The Labrador Current, which extends down the eastern coast of Newfoundland, is responsible for carrying these bergs south, towards their eventual demise in the slightly warmer waters surrounding the island.
Fig. 2 A calving glacier in Northwest Greenland
It is estimated that 30 – 40 thousand icebergs break away from Greenland glaciers each year. Most are not carried very far by ocean currents and stay in
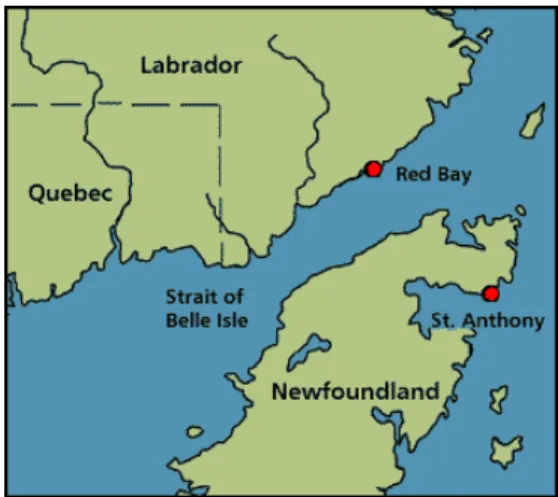
cold, northerly places such as Baffin Bay. A lot more are lost from being trapped in shore ice, or from being grounded along the Labrador coast during their trip south. Only around 10% of the original bergs actually make it as far south as Newfoundland. Out of this 10%, even fewer reach waters south of 48 degrees latitude. The main reason for this being that a lot of bergs get pushed into the Strait of Belle Isle [Fig. 3]. In the Strait, they either run aground and melt or continue on to the western side of the island, down towards Cape Breton, Nova Scotia (melting progressively along the way). Other bergs become grounded on the eastern seaboard of Newfoundland where they remain fixed, eventually breaking apart into insignificant pieces and melting. More still have simply melted away in the water by the time they reach the 48th parallel, and therefore cannot be counted.
Fig. 3 Strait of Belle Isle
Despite the significantly reduced iceberg quantity around the shores of
Newfoundland, they still pose a huge threat to any ocean going vessel. Unlike other ocean obstructions, the most dangerous part of the iceberg is not what we witness above the water. As is commonly known, 90% of an iceberg’s mass resides beneath the ocean’s surface. This fact, along with others to be
discussed later in this report, are major reasons for icebergs being named one of the North Atlantic’s most menacing obstructions for ships.
2.2 Iceberg Descriptions and Classifications
The International Ice Patrol has adopted a set of standard guidelines surrounding the naming and size classification of icebergs.
Table 1 Iceberg classification chart Iceberg Size Height above
waterline (meters)
Length (meters) Weight (Megatons)
Growler Less than 1 m Less than 5 m 0.001
Bergy Bit 1 m to less than 5 m 5 m to less than 15 m 0.01
Small Berg 5 m to 15 m 15 m to 60 m 0.1
Medium Berg 16 m to 45 m 61 m to 120 m 2.0
Large Berg 46 m to 75 m 121 m to 200 m 10.0
Very Large Berg Greater than 75 m Greater than 200 m Greater than 10.0
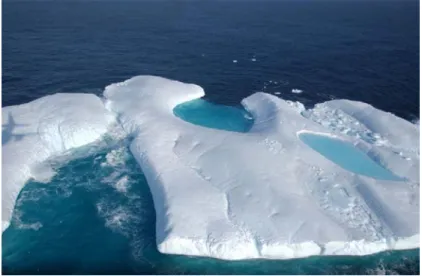
While most of icebergs observed during any particular season fall into these general size classifications, a few still manage to exceed any normal
expectations. These abnormally sized bergs, generally in excess of 500 m long, are recorded as “ice islands.” The number of ice islands charted varies from year to year. [Fig. 17] However, the largest iceberg (ice island) ever recorded in the Northern Hemisphere was found in 1882, near Baffin Island. It was approximately 13 kilometres long, six kilometres wide, and 20 metres above sea level with a mass of about nine billion tonnes.
The naming of icebergs is a little different. There are two basic forms of icebergs: tabular and non-tabular. Tabular icebergs have steep, vertical sides and flat tops. Their length-to-height ratio is generally greater than 5:1.
Fig. 5 A tabular iceberg
Non-tabular icebergs, which do not resemble a huge plateau, are sub-divided further into more specific classification categories. These categories are:
Iceberg Shape General Description
Dome
An iceberg with a rounded top
Pinnacle
An iceberg which has one or more spires (tall peaks)
Wedge
An iceberg resembling a giant wedge (a steep vertical edge on one side, with the other side sloping gradually to the water’s surface)
Dry-Dock
An iceberg which has eroded away in the center forming two pinnacle-like icbergs that are attached underneath the suface (a water channel is found in the center)
Blocky
An iceberg with steep vertical sides and a relatively flat top. They have a smaller length-to-hegith ratio than a tabular iceberg. (They look more like a block)
2.3 The Dangers Associated with Icebergs
Icebergs are major ocean obstructions in the North Atlantic. Since the density of pure ice approximately 920 kg/m3 and the density of sea water is approximately 1025 kg/m³, typically only one-tenth of the volume of an iceberg is above the waterline. This makes it very difficult to estimate the true destructive potential of any iceberg, as its underwater section is nearly impossible to classify.
Icebergs also have an audacious tendency to roll over quickly with very little, if any warning. Pieces of ice may fall from a berg, or they may calve (split into two or more pieces). All of these occurrences could potentially create waves capable of swamping a deck, or cause swells large enough to endanger the stability of a ship.
It is generally assumed that the larger the iceberg, the more damage it is capable of causing. While this is technically true since the large icebergs are significantly heavier and stronger, due to visibility issues, the smaller bergs are actually the ones which generally cause the most damage to ships. The main reason behind this increased risk is the high potential for smaller icebergs to “slip under the radar”. Modern day radar and satellite systems use the reflecting potential of an iceberg’s surface to identify and track their movement through the ocean.
followed. Modern tracking however is still much more effective and efficient than relying solely on the gift of human sight as was common in the early 20th century. Smaller bergs were hard for helmsmen to see until the ships were practically on top of them. This left little or no time to slow down and/or react in a practical fashion.
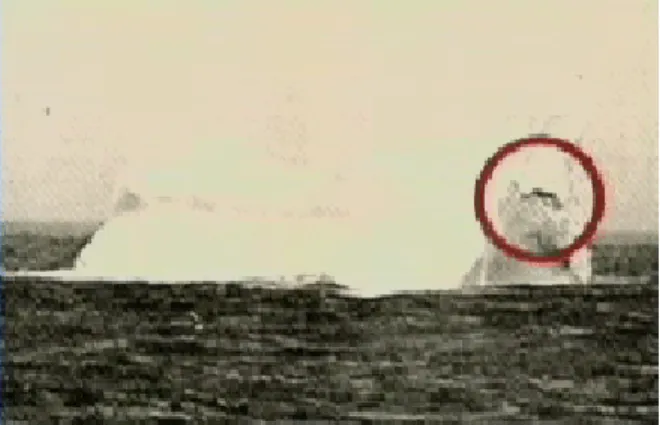
For example, the iceberg which sunk the Titanic early in the morning on April 15th, 1912 is speculated to have been around 50 to 100 feet (15.24 to 30.48 m) high and 200 to 400 feet (60.96 to 121.92 m) long. [Fig. 6] By modern day standards this would be classified as a medium sized berg. This berg tore a hole straight through the Titanic’s supposedly “unsinkable” double hull, sinking the ocean liner within three hours of contact. Consequently an estimated 1503 individuals lost their lives in the cold, unyielding waters of the North Atlantic. The ship is estimated to have sunk to a depth of 12,600 ft at the location 41° 43’ 42” N, 49° 56’ 49” W, southeast of the island of Newfoundland.
Fig. 6 Recently discovered picture of the iceberg believed to have sunk the titanic.
2.4 Establishment of the International Ice Patrol (IIP)
Icebergs had always been known to be a nuissance and a slight menace to ships. However, it was only after the sinking of the Titanic that their true
catastrophic potential was realized. It became the consensus of many countries that something had to be done to address the issue.
For the remainder of 1912, the United States Navy stepped in to patrol the Grand Banks area for the presence of any more potentially dangerous bergs. When the Navy couldn’t spare any ships in 1913, the Revenue Cutter Service (forerunner of the coast guard) took over the task.
On November 12th of 1913, the first International Conference on the Safety of Life at Sea (SOLAS) was held in London, England. The idea of ice patrol for the northerly regions was discussed at great length. A few months later, on January 30th of 1914 a convention was signed. The main objective of this conference was, as the name SOLAS indicates, to protect human life while at sea. To initiate and fullfill this protection promise, it was decided that an “ice patrol service, consisting of vessels, which should patrol the ice regions during the season of iceberg danger and attempt to keep the trans-Atlantic lanes clear of derelicts during the remainder of the year” would be put in place. It was agreed that the United States Government would take up responsibility of this task while
receiving funding from the various countries interested in the patrol. A formula specifically designed to estimate each country’s individual benefit was derived, and each country was to make a financial contribution accordingly.
For the remainder of the decade of 1910, and continuing into the 1920’s, the International Ice Patrol (IIP), as it was named, continued to grow in both
experience and the number of sightings which it reported. [Table 2] The second SOLAS international conference was held in London on April 16th of 1929. A total of 18 countries were present and the final act was signed by all on May 31st, 1929. This conference addressed many of the same issues as its predecessor in 1914, with only a couple of new and/or revised sections annexed into the
documentation.
Since the 1929 conference, up to modern day, three more SOLAS conferences have been held. These conferences, in 1948, 1960 and 1974 updated and
improved upon rules and regulations regarding previously introduced topics but offered no real change to the fundamental concepts of the IIP organization.
Currently, 17 countries provide funding for the IIP. These countries are:
o Canada
o United States of America o United Kingdom o Belgium o Denmark o Finland o France o Germany o Greece o Italy o Japan o Netherlands o Norway o Panama o Poland o Spain o Sweden
The funding proportion provided by each individual nation is now based on the percentage of total cargo tonnage travelling through the patrol area which they control during ice season. In other words, the more you ship, the more you pay!
2.5 Accomplishments of the SOLAS Conferences
Since the sinking of the Titanic in 1912, major improvements have been made to the safety regulations onboard ships travelling the North Atlantic through iceberg alley (the section of the Labrador Current which runs approximately 250 miles east and southeast off Newfoundland’s Grand Banks). On top of creating a
constant ice patrol in the North Atlantic (IIP), a few of the changes that were induced by SOLAS are:
Regulations regarding the speed at which a ship may travel through icy waters were put in place. At night all ships are recquired to slow down to a moderate pace or alter their course away from the known danger ahead.
A comprehensive public address system must now be present onboard all vessels. Therefore, if an emergency does occurr, all passengers and crew can be informed of the situation quickly and in an effective manner.
All crew members now have to be properly trained to use the saftey equipment onboard the vessel. Also, they must have easy access to comprehensive instruction manuals.
There must be enough life vessels (some of which may be substituted for liferafts) to support all persons onboard the ship.
Lifeboats must now be partially or completely covered to avoid prolonged open exposure to the cold North Atlantic waters. Partially enclosed lifeboats must have a collapsible roof to fully enlcose the vessel once everyone is inside. A certain number of cold water immersion suits must now be kept on all
passenger and cargo vessels.
Evacuation chutes must meet a quality standard for both saftey and speed of use.
It is now a requirement that an ‘abandon ship’ and fire drill routine be conducted weekly on all passenger ships.
2.6 Progression of Iceberg Tracking Technology
For decades the main source of ice data came from visual sightings made by helmsmen or other individuals onboard a ship. Although these sightings were numerous in quantity, they were often disorganized, low in accuracy, and repetitive.
Many variables, such as the weather, affected the reliability of a visual iceberg sighting. Extensive cloud cover (which significantly diminishes the daylight), fog, snow, rain, sleet, etc. all affected the accuracy of an iceberg count, or the
determination of an iceberg’s approximate size. Ocean swells (often due to high winds) were also effective in masking both berg quantity and quality.
Determining an accurate iceberg count during the night was also a major
challenge. Since the reflection of moonlight on icebergs wasn’t the most reliable mode of identification, only bergs in the immediate vicinity of a ship were visible. Therefore, nights that were plagued by immense cloud cover were even less likely to yield an accurate iceberg count.
Also, visual sightings were only as good as the eyes designated to identify the potential dangers. Therefore, weak or damaged telescopes had a negative impact on iceberg sighting accuracy. The potential for human error after many hours completing such a monotonous, repetitive task could have also caused accuracy problems. Therefore, the chances of missing or recounting an iceberg were high with visual recording, especially in the vicinity of dense ice.
Coupled with the problems associated with actually sighting ice, the recording and transmission of acquired visual information was also problematic. These problems would have been especially evident in the beginning of the 20th century as only the rudimentary Marconi signal transmission was available as the outside communication device onboard a ship. It was common for information to be delayed or lost in the transmission process. Often ships had a transmission limit. For example, the Titanic had a signal that only reached around 500 nautical miles. Therefore, long distance transmission of ice information was essentially non-existent.
The 1930’s brought the introduction of aerial surveillance of the oceans as another method of iceberg tracking. Planes made it easier to identify and trace ocean currents and therefore track the icebergs that they carried with them.
Fig. 7 U.S. Coast Guard plane similar to those used for ice patrol purposes
In 1945, radar had made its initial appearance as a potential tracking device for large ocean obstructions, including icebergs. By 1955, oceanographic
monitoring outposts using radar technology were established. These outposts were used for the purpose of monitoring and gathering information of the changing ocean front in the general vicinity of wherever they were located. Another giant step for oceanographic monitoring technology occurred in 1964 when the first computer was installed on a ship to be used for this purpose.
The decade of 1970 brought the introduction of the satellite into ocean
surveillance. It became standard for icebreakers to be equipped with systems for automatically transmitting photographs via satellites. However, at this point in time, these transmissions were still fairly limited by weather conditions.
Technological potential and reliability has increased steadliy since the 1970’s. Currently the Canadian Government is employing a system using Synthetic Aperture Radar (SAR) and multipolarization modes to track iceberg location and progress. SAR transmits microwave energy to the ocean’s surface where they can reflect off any large obstruction and give an exact location. This system can also accurately measure changes in surface height of the ocean.
Despite the high accuracy of modern day satellite and radar systems, they are still incapable of tracking every iceberg floating in the North Atlantic. These electronic systems may malfunction at any time, often without warning. They may produce blurry images as a result of storm interruption or extreme ocean
glare. Therefore, it can be argued that satellite and radar systems shouldn’t completely replace visual sightings from ships and planes. Instead, they should be viewed and used as a valuable complimentary tool. Together the old and new tracking methods make finding icebergs and following their southbound progress more accurate, more effective, and more reliable than one or the other by
themselves.
3.0 THE
ICEBERG
SIGHTINGS DATABASE
3.1 Contents of the Excel File
The Iceberg Sightings Database is in-depth electronic record of all the recoded iceberg sightings from the late 1800’s up to modern day. It is currenty an
extensive array of Excel spreadsheets (.xls files). Each spreadsheet consists of thousands of lines of information for each year which has been recorded thus far. Each spreadsheet also consists of an arrangement of titled fields which are
designed to aid with appropriately sorting the entered data into categories and classifications if needed. These columns are:
Source (In the case of this database, the source is always IOT) Flag
IIP #
Iceberg # (Same as the IIP #) Resight Sighting Source Vessel Name Sighting Method Latitude Longitude Ice Season
Year (Same as the Ice Season) Month
Time Size #Bergs #Growlers #Bergy Bits Small Medium Large Very Large Ice Island Unidentified Shape Length Length Flag Height Height Flag Width Width Flag Draft Draft Flag Mass Mass Flag Drill Site Comments
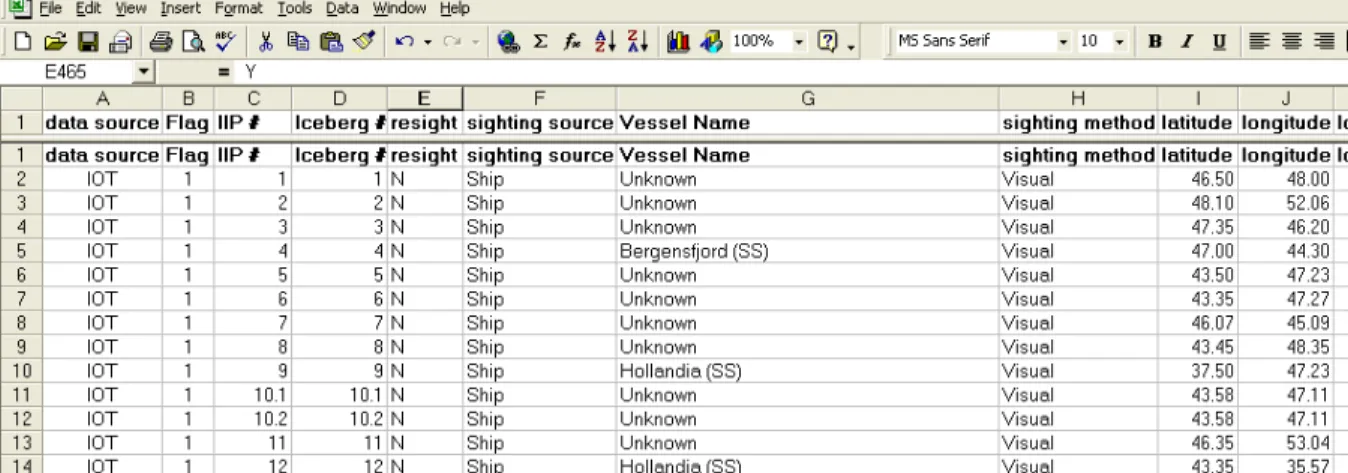
Fig. 8 The first ten columns of the database file for 1921.
Each new sighting at a particular location is designated its own ‘iceberg #’ (which is the same as the IIP #) as to effectively identify resights. If more than one type of iceberg was seen at a particular location or if the sighting extended over a specified distance, decimal places are added accordingly. The first decimal place of the iceberg # is assigned to designate multiple iceberg sightings in one location. For example, “4 large bergs and 2 growlers seen at 42°09’N, 47°45’W” might be given iceberg #’s of 42.1 and 42.2 respectively.
The second decimal place of the iceberg # is assigned to designate a sighting given over a certain distance range. For example, if the entry reads “30 small bergs were seen from 47°28’N, 50°10’ W to Belle Isle, then the iceberg #’s would be 376.01 and 376.02 respectively. If one entry reported both multiple sightings and a specified distance range, then both decimal places are simply utilized at the same time. For example, the iceberg #’s would be 43.11, 43.12, 43.21, and 43.22.
A flag value of either 1 or 0 is also designated to each line of every entry. The flag number was entered as 0 if it is the second location of a “from here to here” entry. A flag number of 1 is given for all other entries.
The resight column simply requires the entry of a ‘Y’ if there are repeat entries for bergs in that loaction, and ‘N’ if there are not.
The sighting source, ship name, and method of sighting each also have their own separate column. For earlier decades, all sightings would have been visual as satellite and radar tracking was not yet available.
In the column for size, a title of either berg, growler, bergy bit, small, medium, large, very large or ice island is given to the particular berg or bergs being described. Which category an iceberg is placed in depends on if the entry in question specifically titles the iceberg, or gives its dimensions. If no information has been given besides its location, then it is placed in the general ‘berg’
category.
Under the columns titled ‘berg’, ‘growler’, ‘bergy bit’, etc, the quantity of icebergs are recorded accordingly.
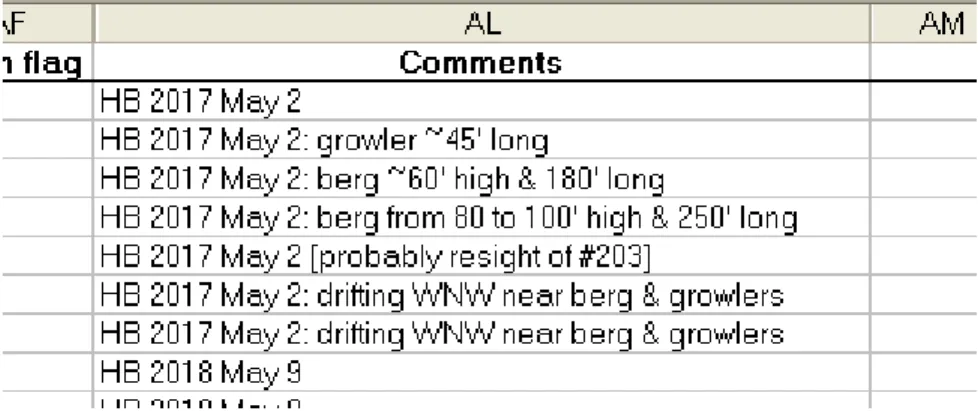
In the column designated for comments, the original source of the data is stated. Any other new and relevant information not classified within the other columns can also be entered in this section.
Fig. 9 Excerpt from the Comments Coulmn in the Excel Database File for 1928
The information recorded in IOT’s Iceberg Sightings Database is also submitted to the Program for Energy Research and Development (P.E.R.D). This
government funded program is administered by NRC and maintained by BMT Fleet Technology Limited. IOT has already contributed over 90,000 records from the era prior to 1960.
3.2 Using the Information Stored in the Excel Files
When all the information from all the available sources has been properly stored in the database, the information is converted into various formats convenient for further analysis. For example, the identifications and locations of each iceberg are converted into a .KML file which can be uploaded and viewed in Google Earth. A little green balloon appears in each of the locations where icebergs would have been. Therefore, it is very easy to recognize those sightings which have accidently been given land coordinates. An accurate approximation of the correct location for these icebergs can then be made in Google Earth. The new coordiantes are then transcribed back into the file, and a note made in the ‘Comments’ column as to what they were changed from and why.
Fig. 10 Google Earth image depicting the iceberg dispersion of 1925
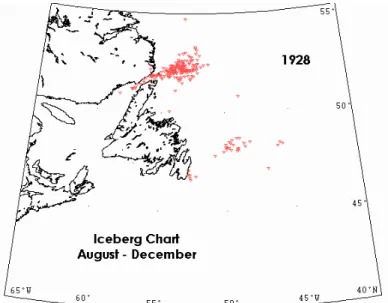
Another useful tool for plotting maps showing yearly iceberg trackings is the MS DOS program called VMAP. In this program, .prn files created from the original Excel database files are converted into visual representations of the iceberg sightings. A template map (in this case Newfoundland and its immediate
surroundings) is called up and each iceberg is represented on the map by a marker such as the red triangles seen below. [Fig.11] Once these files are created they can be saved for future analysis purposes.
Fig. 11 The image created by VMAP for all of the iceberg sightings during 1928
4.0 DATABASING THE 1920’s
4.1 Information Sources
The iceberg sightings made during the decade of 1920 were analyzed and recorded in detail. Multiple sources were used to obtain this data. These sources were:
o International Ice Patrol (IIP) o Hydrographic Bulletin (HB)
o New York Martime Register (NYMR) o Ship Iceberg Collision Database (SICDB) o Halifax Herald (HH)
o Marine Observer (MO)
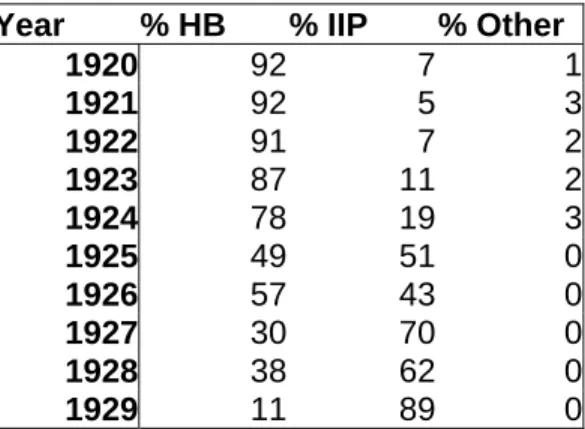
As the decade of the 1920’s progressed, the trend for iceberg sighting sources gradually reversed. In the beginning of the decade (Ex: 1920), the majority of the
sightings came from the HB, and a small percentage came from the IIP. By the end of the decade (Ex: 1929) the percentages had roughly reversed, giving the IIP most of the sightings. The proportion of sightings that came from the other four sources remained minimal and relatively stable throughout the 10-year span.
Table 2 Percentage of total sightings from each source per year Year % HB % IIP % Other
1920 92 7 1 1921 92 5 3 1922 91 7 2 1923 87 11 2 1924 78 19 3 1925 49 51 0 1926 57 43 0 1927 30 70 0 1928 38 62 0 1929 11 89 0
When the total number of sightings from each source was tabulated, the following percentages presented themselves:
Table 3 Percentage of total sightings from each source for the full
decade from 1920 to 1929 Source Percents HB 59% IIP 40% Other 1%
As is evident from the complete decade analysis, the HB supplied the majority of the iceberg sighting information during the 1920’s. However, as is also evident, the percentage of sightings from the IIP escalated dramatically in the late 1920’s. This information provides evidence for the statement that by the beginning of the 1930’s the IIP had successfully taken control of the North Atlantic ice sightings.
4.2 Importance of the Hydrographic Bulletin (HB)
It may seem that by the 1930’s papers such as the Hydrographic Bulletin had become obsolete. However the HB kept record of a lot of interesting and
valuable information regarding a variety of ocean related obstructions and points of interest. This is the main reason behind the continuation of publication of the HB up until 1954 when printing ceased. Some of the other information recorded by the HB was:
Dangerous Ocean Debris (In the North Atlantic, the South Oceans and the Great Lakes)
Seismic Activity (including tide rips) Astral Activity
Volcanic Activity Bottle Drifts
Occurrence of Waterspouts Occurrence of Sea Waves
Whale Sightings
4.3 Comparing Our Statistics to Those Provided by the IIP
As a source of comparison reference, an Excel file, prepared by individuals associated with the IIP was obtained. This file was analyzed and plotted in a similar fashion as the information from the database, focusing particularly on sightings south of 48° from the months of August through December during the decade of 1920-1929.
IIP DATA (1920-1929) Total # of Sightings August to December SOUTH OF 48 N 0 10 20 30 40 50 60 70 1920 1921 1922 1923 1924 1925 1926 1927 1928 1929 Year # of Sightings Fig. 12 Graph of the data obtained from the IIP
VS. DATABASE Total # of Sightings August to December South of 48 degrees 0 10 20 30 40 50 60 70 80 90 100 1920 1921 1922 1923 1924 1925 1926 1927 1928 1929 Year Number of Sightings
The trend found from August to December for both the IIP data [Fig.4.1], and the database information [Fig.4.2] is very similar. The significant number of sightings observed during the first four years of the decade was followed by a two-year absence of iceberg recording. The sightings re-occurred during the last four years of the decade, however their quantity was significantly reduced.
The information contained in the database graph [Fig.4.2] is a collection of
sightings from all the possible sources that were available for the decade. When the graph of only the IIP sightings was plotted:
DATABASE Total # of IIP Sightings
South of 48 1920-1929 0 10 20 30 40 1920 1921 1922 1923 1924 1925 1926 1927 1928 1929 Year # of sightings
Fig. 14 Graph of solely the IIP data collected in the Iceberg Sightings Database
Based on this graph, it is logical to conclude that the information received from IIP has also been assembled from a variety of sources. The IIP wasn’t a
significant supplier of iceberg sightings until 1929 and therefore must have used sightings from other sources as information references for the prior era.
4.4 Implications of the Analyzed Data
As stated before, the data obtained throughout the decade of the 1920’s is very divided. The latter half of the ten-year span shows a significantly reduced iceberg count below the 48th parallel. This observation can lead to much speculation surrounding a climate shift that may have occurred around 1924.
Given that the average iceberg calving rate from the Greenland glaciers remained relatively steady throughout the decade, a high iceberg count below the 48th parallel generally indicates low mean yearly temperatures.
Consequently, a low iceberg count below 48° north generally indicates higher yearly mean temperatures.
It has been deduced by many that a gradual increase in average yearly
temperatures began during the 1920’s. The reason could be that a significant “increase in human-created greenhouse gases in the atmosphere” occurred around this time. The information obtained through analysis of the data
contained in the Iceberg Sightings Database supports this warming theory. More specifically, the Iceberg Sightings Database may even be able to indicate a more specific time period as to when these trends first began, along with its yearly changes throughout the proceeding decades.
5.0 CONCLUSION
Since the sinking of the Titanic in 1912, iceberg tracking has steadily become more accurate and reliable. The foundation of the International Ice Patrol along with the impressive technological advancement of the past century has made this possible. Historic journals and/or bulletins that existed prior to the IIP, such as the Hydrographic Bulletin, have also aided in this growth process. These
documents provided a rich cushion of information for the IIP to rely on for periods both prior and including those that they recorded.
Recording the details pertaining to the icebergs sighted each year has proven to be a very important and informative practice. Despite still being in its primitive stages, the Iceberg Sightings Database has already yielded valuable information regarding historic ice flow and potential climate shifts. With the continuation of the current Excel files and the creation of a more interactive database format, even more elucidative information may be obtained. Also, the plans for a web
page dedicated to the Iceberg Sightings Database are in the process of being created. With the introduction of this easy-to-use web page, the considerable information obtained in the database will be readily available for public use.
6.0 REFERENCES
1) International Ice Patrol Documentation:
“Table of Ice and Other Obstructions-1920” “Table of Ice and Other Obstructions-1921” “Table of Ice and Other Obstructions-1922” “Table of Ice and Other Obstructions-1923” “Table of Ice and Other Obstructions-1924” “Table of Ice and Other Obstructions-1925” “Table of Ice and Other Obstructions-1926” “Table of Ice and Other Obstructions-1927” “Table of Ice and Other Obstructions-1928” “Table of Ice and Other Obstructions-1929”
2) Hydrographic Bulletin Documentation:
Photographs taken of all issues of the Hydrographic Bulletin from the years between 1889 and 1947 were used as reference. The photographs for the years between 1920 and 1929 were of particular interest for this report.
3) Websites:
http://www.uscg.mil/LANTAREA/IIP/home.html
http://www.wikipedia.org/
~ http://en.wikipedia.org/wiki/International_Ice_Patrol ~ http://en.wikipedia.org/wiki/RMS_Titanic http://www.canadiangeographic.ca/magazine/ma06/indepth/nathistory.asp http://www.radio.cz/en/article/31001 http://www.exn.ca/titanic/icebergs.cfm http://www.titanic-titanic.com/titanic_wreck_location.shtml http://www.uscg.mil/LANTAREA/IIP/pdf/IMO_TITANIC.pdf http://www.mss-int.com/solas.html http://archive.greenpeace.org/climate/arctic99/reports/seaice3.html
7.0 ACKNOWLEDGEMENTS
I would like to acknowledge Mr. Brian T. Hill of the Institute for Ocean
Technology (NRC-CNRC) for his extensive contribution to this report. Without his superior knowledge pertaining to the subject of ice distribution and trends in the Western North Atlantic, and without his vast amounts of acquired historical data, this report would not have been possible.
Another acknowledgment is extended to Mr. Wayne Pearson, also of the Institute for Ocean Technology (NRC-CNRC), for his creation of the conversion program necessary for transcribing the Excel (.xls) database files into Google Earth (.KML) files.
HB vs. IIP (All entries) 0 500 1000 1500 2000 2500 1920 1921 1922 1923 1924 1925 1926 1927 1928 1929 Year # of reported sightings HB IIP
Fig. 15 Graph comparing the number of iceberg sightings from the HB and the IIP for all locations during the decade of 1920
HB vs. IIP (South of 48) 0 500 1000 1500 2000 1920 1921 1922 1923 1924 1925 1926 1927 1928 1929 Year # of reported sightings HB IIP
Fig. 16 Graph comparing the number of iceberg sightings from the HB and the IIP for locations South of 48° during the decade of 1920
Ice Islands 0 5 10 15 20 25 192 0 192 1 192 2 192 3 192 4 192 5 192 6 192 7 192 8 192 9 Year # of Ic e Is la nds Ice Islands
HB vs. IIP August to December All Sightings 0 50 100 150 200 250 300 350 400 450 500 550 600 650 700 750 800 850 900 950 1000 1050 1100 1150 1200 1920 1921 1922 1923 1924 1925 1926 1927 1928 1929 Year Number of Sightings HB IIP
Fig. 18 Graph comparing the number of iceberg sightings from the HB and the IIP for all locations from August to December during the decade of 1920
HB vs. IIP August to December South of 48 degrees 0 10 20 30 40 50 60 70 80 90 100 1920 1921 1922 1923 1924 1925 1926 1927 1928 1929 Year Number of Sightings HB IIP
1920 0 50 100 150 200 250 Oct ober Nov embe r Dec embe r Janu ary Febru ary Ma rch April May June Ju ly Augu st Sept emb er Month # of S ightings
Fig. 20 Graph of the total monthly sightings for 1920
1921 0 50 100 150 200 250 October November Dec ember Januar y Februar y Ma rch April May June Jul y Augus t September Month # of Sightings
Fig. 21 Graph of the total monthly sightings for 1921
1922 0 50 100 150 200 250 300 Oc tober No vember De cember Janu ary Februar y Mar ch Apr il May June July Augus t September Month # of Sightings
1923 0 10 20 30 40 50 60 70 80 90 Oc tober
November December Janu ary Febr uar y Mar ch Apr il May June July Augus t September Month # of Sightings
Fig. 23 Graph of the total monthly sightings for 1923
1924 0 1 2 3 4 5 6 7 Octo ber
November December Janu ary Februar y Mar ch Apr il May Jun e July Augus t September Month # of Sightings
Fig. 24 Graph of the total monthly sightings for 1924
1925 0 10 20 30 40 50 60 70 October
November December Januar y
Febr uar
y Ma
rch April May June July Augus
t
September
Month
# of Sightings
1926 0 20 40 60 80 100 120 140 160 180 Oc tober
November December Janu ary Febr uar y Mar ch Apri l May June July Augus t September Month # of Sightings
Fig. 26 Graph of the total monthly sightings for 1926
1927 0 20 40 60 80 100 120 140 160 180 October November Dec ember Januar y Februar y Ma rch April May June Jul y Augus t September Month # of Sightings
Fig. 27 Graph of the total monthly sightings for 1927
1928 0 20 40 60 80 100 120 140 160 180 200 Octo ber
November December Janu ary Februar y Mar ch Apr il May June July Augus t September Month # of Sightings
1929 0 50 100 150 200 250 300 350 400 450 500 Octo ber
November December Janu ary Febr uar y Mar ch Apr il May June July Augus t September Month # of Sightings